Turbulence characteristics of
electron cyclotron and ohmic heated discharges
I. Pusztai(1), S. Moradi(1),
T. Fülöp(1), N. Timchenko(2)
(1)
Department of Applied Physics, Nuclear Engineering, Chalmers
University of Technology and Euratom-VR Association, Göteborg,
Sweden
(2) Institute of Tokamak Physics, NRC “Kurchatov
Institute”, 123182, Kurchatov Sq. 1, Moscow, Russia
Abstract
Turbulence characteristics of electron cyclotron (EC) and ohmic heated (OH) discharges has been analyzed by electrostatic gyrokinetic simulations with gyro [J. Candy, R.E. Waltz, Journal of Computational Physics 186, 545-581 (2003)] aiming to find insights into the effect of auxiliary heating on the transport. Trapped electron modes are found to be unstable in both OH and the EC heated scenarios. In the OH case the main drive is from the density gradient and in the EC case from the electron temperature gradient. The growth rates and particle fluxes exhibit qualitatively different scaling with the electron-to-ion temperature ratios in the two cases. This is mainly due to the fact that the dominant drives and the collisionalities are different. The inward flow velocity of impurities and the impurity diffusion coefficient decreases when applying EC heating, which leads to lower impurity peaking, consistently with experimental observations.
1 Introduction
Even if there is a wealth of experimental data and theoretical models relating to the effect of auxiliary heating on transport there are still many open issues regarding the sign and magnitude of the transport and its parametric dependencies. One example of this is the experimental observation that the density profiles of electrons and impurities depends on the auxiliary heating. Results from many different devices have shown a flattening effect of electron cyclotron resonance heating (ECRH) on the electron density [1, 2, 3]. Furthermore, impurity accumulation also can be reduced by central ECRH [4, 5, 6]. However, in some parameter regions ECRH does not affect the electron or impurity density profiles, or even peaking of these profiles is observed [7, 8]. The physical mechanism giving rise to the differences is not clearly identified, although it seems that collisionality plays a crucial role in determining the particle transport [9, 10, 11, 12], while the electron-to-ion temperature ratio [8], and the density and temperature scale lengths [7] are also important. In order to be able to make predictions confidently for future fusion devices understanding of the underlying transport processes is necessary for a wide range of these parameters. In particular, to understand how and why the transport processes are different in the ohmic and EC heated discharges it is important to analyze the turbulence characteristics and scalings with key parameters such as collisionality, electron-to-ion temperature ratio, and density and temperature scale lengths.
The aim of the paper is to calculate the turbulence characteristics and the corresponding particle and energy fluxes for two similar experimental scenarios, one with ECRH and one with only ohmic heating. The steady-state impurity density gradient for trace impurities will also be calculated. As there is a consensus that the transport in tokamak core plasmas is mainly dominated by transport driven by drift wave instabilities, we focus on these instabilities and use quasilinear numerical simulations with the gyro code [14] to calculate the turbulence characteristics. As shown in [15, 16] the quasilinear electrostatic approximation retains much of the relevant physics and reproduce the results of nonlinear gyrokinetic simulations for a wide range of parameters.
The experimental scenarios from T-10 are well-suited for the study we perform. One of the advantages is that there are measurements of turbulence characteristics on T-10 which can be used to compare with our theoretical calculations. The selected discharges have hot-electron plasma, relatively high density and collisionality; analyzing experimental scenarios from it gives insights into a range of parameters that have not been studied before.
Our results show that the dominant instability is trapped electron mode in both OH and the EC heated scenarios. As expected, the collision frequency plays an important role stabilizing the trapped electron mode driven turbulence in both cases. The EC heated case is more strongly suppressed for lower collisionalities. This is due to the drop of the electron temperature gradient drive which is stabilized by collisions. The growth rates and particle fluxes exhibit qualitatively different scalings with the electron-to-ion temperature ratios in the two cases. This is mainly due to the different collisionalities, but in the case of the electron particle flux also the difference in density gradients contributes. Sensitivity scalings for electron density and electron temperature gradients show that both of these drives are present in the investigated experimental scenarios. The inward flow velocity of impurities and the impurity diffusion coefficient decreases when applying EC heating, which leads to lower impurity peaking, consistently with experimental observations.
The remainder of the paper is organized as follows. In Sec. 2, the experimental scenario and theoretical modeling are described. In Sec. 3, the simulation results are presented and interpreted. We present the instability properties, the background ion and electron transport fluxes and convective and diffusive transport of a trace impurity species. Finally, the results are summarized in Sec. 4.
2 Scenario and theoretical modeling
2.1 Description of the T-10 discharges
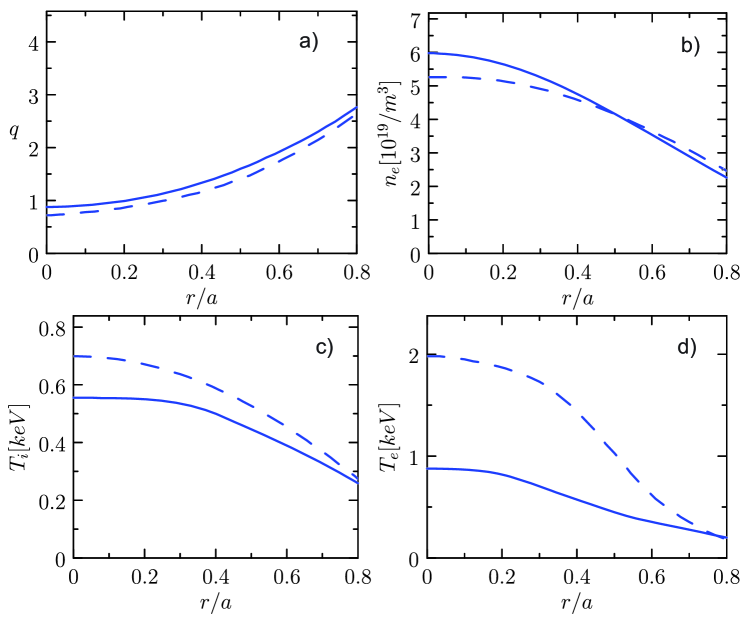
The T-10 plasma has circular cross-section with major radius and minor radius . The plasma current in the discharges was and the toroidal magnetic field was . The effective charge in the comparatively high density discharges we studied was rather low . We study two typical experimental scenarios from T-10, one with electron cyclotron heating (EC), and one with only Ohmic heating (OH). The plasma parameter profiles used in our study are given in Fig. 1. Carbon is an intrinsic impurity in all the discharges and here it is taken to be unless otherwise is stated.
In discharges with on-axis EC heating, the electron density was found to decrease in the plasma center. There is sawteeth activity in the central part of the plasma in both discharges and the inversion radius is around . Therefore we will concentrate our studies outside .
2.2 Gyrokinetic modeling
The linear gyrokinetic dynamics of all ion specii (deuterium, carbon and a trace species with the concentration ) and electrons has been simulated using the gyro code. We consider only electrostatic fluctuations relevant for low and circular geometry. All the species are kinetic, and we include parallel compressibility and electron-ion collisions. We note that the ion-ion collisions were found to be unimportant even in the highest collisionality regions we studied. The carbon impurity is treated self-consistently. Unless otherwise specified, the following conventions and units are employed throughout this paper. Frequencies and growth rates are normalized to where is the ion sound speed, is the plasma minor radius, and is the main ion species. The fluxes are normalized to the flux surface average of , where is the amplitude of the fluctuating electrostatic potential, is the poloidal wave number, is the ion sound Larmor radius with the ion cyclotron frequency. The radial scale lengths are defined as and , where denotes the particle species.
The magneto-hydrodynamic equilibrium – including the Shafranov shift of the circular flux surfaces – is calculated by the astra code [17]. As the plasma rotation in the T-10 tokamak is weak it is neglected in our simulations.
The linear gyro simulations were carried out using flux-tube (periodic) boundary conditions, with a 128 point velocity space grid (8 energies, 8 pitch angles and two signs of velocity), and the number of poloidal grid points along particle orbits is 14 for passing particles. The location of the highest energy grid point is at . In the cases investigated here varied in the range of .
In the following chapter we present the linear frequencies and growth rates from gyro simulations to identify microinstabilities present in the experimental cases. Then for mid-radius and a representative wave number we perform parameter scalings to investigate the effect of collisions, temperature ratio, electron density and ion temperature gradients on frequencies and linear particle and energy fluxes. Finally, the diffusion and particle flow and the zero flux density gradient of a trace impurity species is studied through impurity density gradient scalings.
3 Instabilities and transport
3.1 Instability characteristics
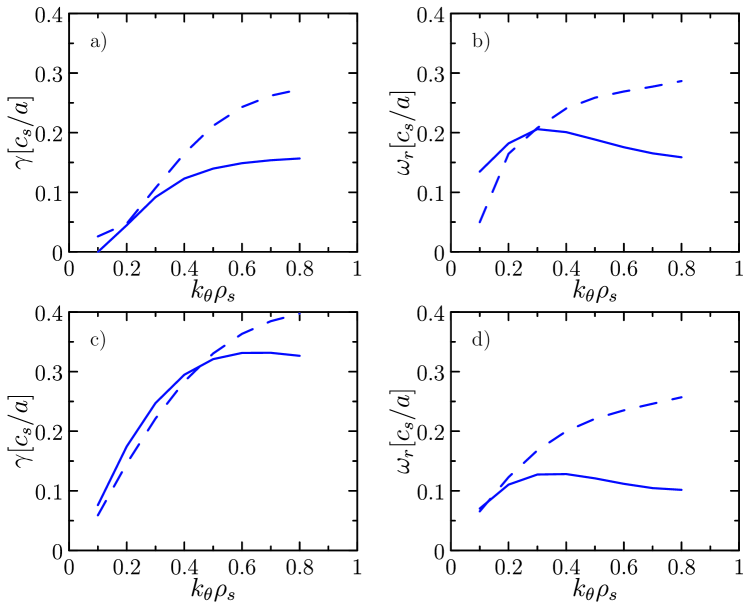
Figure 2 shows the growth rates and real frequencies of the instability as a function of at both in the collisionless case (a,b) and with collisions included (c,d). The linear simulations were performed for a range of -values using the Maxwell dispersion matrix eigenvalue solver method of gyro to solve linear gyrokinetic (GK) equations. This method is capable of finding all the unstable roots of the Maxwell dispersion matrix, even the sub-dominant ones.
The real part of the mode frequency is positive in all cases that suggests that the unstable modes are Trapped Electron (TE) modes. This is confirmed by the fact that no unstable mode could be found if the non-adiabatic electron response was switched off. It is known that the non-adiabatic electron response can increase the ion temperature gradient (ITG) mode growth rates, but the only unstable root is found to be a TE mode in both the OH and EC cases. This is in agreement with the experimental observations of the turbulent characteristics in high density cases similar to the ones studied here [13].
Trapped electron modes can be destabilized by both electron density and electron temperature gradients [18]. The normalized logarithmic density and temperature gradients at were and in the OH, and and in the EC case. One might expect that the higher growth rates in the EC case (dashed line in Fig. 2a) are due to the high value of , but from Fig. 2c it becomes clear that the difference is mainly due to the effect of different collision frequencies, as without collisions the growth rates are rather similar.
3.2 Effect of collisions
It is interesting to note that the growth rate of the instabilities are reduced by the collisions as it can be seen on Fig. 2 comparing the upper (with collisions) and lower (without collisions) figures. This is due to the collisional de-trapping of trapped electrons and has been noted before in e.g. Ref. [21] where the growth rate of a Dissipative Trapped Electron (DTE) mode in the long wavelength limit is found to be , where is the inverse aspect ratio, is the electron diamagnetic frequency, , and is the electron-ion collision frequency. Our cases are quite similar to the DTE region, the parameter is typically much higher than one due to the modest temperatures and the high aspect ratio. On the other hand, the mentioned expression for the DTE growth rate in [21] is obtained excluding magnetic drifts therefore we do not expect to find the same parametric dependence on collision frequency. The sensitivity of the growth rate and electron particle flux to the variation of the collision frequency in the OH and EC cases is illustrated on Fig. 3 a and b respectively. The curves of the figure, as in all figures henceforth, correspond to mid-radius and which in these TE mode cases does not correspond to the fastest growing mode being at higher wave numbers, but to a typical maximum of nonlinear fluxes.
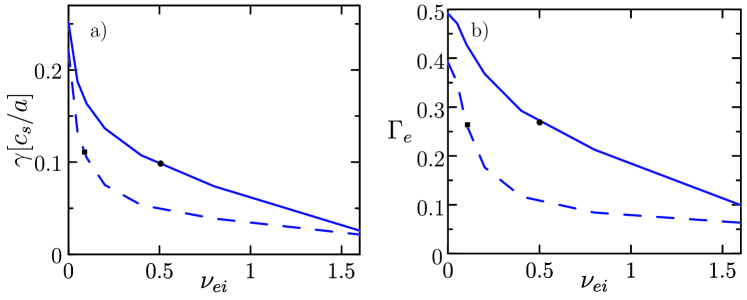
In previous trapped electron mode studies [18] it was found that the electron temperature drive of the TE modes is strongly suppressed as the collision frequency increases, while the density gradient drive can remain for higher collisionalities. From this perspective – although our experimental cases are not extreme examples for pure electron density or temperature driven TE modes – the OH case is more similar to the density gradient driven TE mode while the EC case having higher temperature gradient and lower density gradient is mainly driven by . For lower collision frequencies – around the experimental value of in the EC case – the EC growth rate strongly decreases with increasing collisionality as the drive is suppressed, but for higher collisionalities the mode is not completely stabilized due to the finite density gradient drive. The growth rate in the OH case or low collisionalities does not exhibit so strong dependence on , and that is what we expect in the density gradient driven TE case.
The collisional stabilization of the modes also affects the electron particle fluxes (Fig. 3 b), which exhibit qualitatively similar dependence on collision frequency as the growth rates for most of the plotted collisionality region.
Regarding both the growth rates and particle fluxes the experimental values are approximately the same in the two experimental scenarios, but this seems to be a coincidence considering the strong dependence of these quantities on collision frequency (and accordingly even stronger dependence on electron temperature).
3.3 Temperature ratio effects
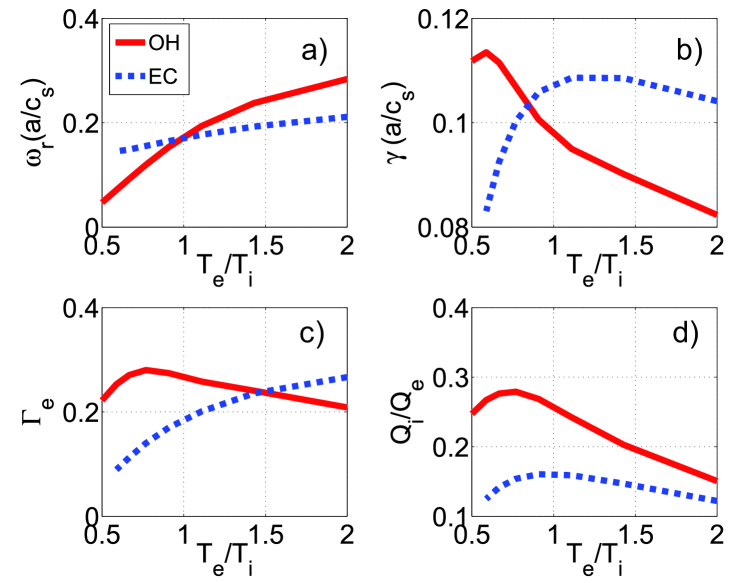
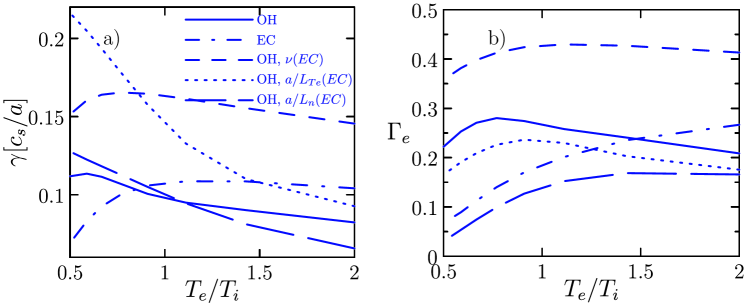
It is reasonable to assume that one of the most important parameters that causes the differences between the OH and EC plasmas is the electron-to-ion temperature ratio. This parameter is indeed quite different for these cases; at , in the OH and in the EC case. However, the effect of on the properties of the instability and the transport is qualitatively different in the two cases, as it can be seen in Fig. 4, where the real frequencies and growth rates of the instability are plotted together with the electron particle flux and as a function of . [We note that these scalings are performed keeping the electron-ion collision frequency () and the normalized ion sound Larmor radius () fixed.]
In the OH case the growth rate of the instability strongly decreases with this parameter almost on the whole temperature ratio region plotted, while the dependence is much weaker in the EC case, in the experimentally relevant regions. It is interesting to note that the slope of the EC growth rate curve is positive for the experimental value of the temperature ratio in the OH case. The slope of the curve is negative in the OH case while it is positive for the EC case. Thus – although the experimental electron particle flux values happen to be the same – the flux in the two cases exhibit qualitatively different behavior. The shape of the ion-to-electron energy flux ratio curves are similar in the two cases, the EC case being lower due to the higher electron energy flux corresponding to the stronger heating of electrons.
In order to determine which parameter causes the qualitatively different scalings between the OH and EC scenarios we performed simulations where all parameters were identical to those of the OH case, except one, which we set to the corresponding value in the EC case. We expect that the TE mode growth rates are mainly affected by the density and electron temperature scale length and, as we saw in the section 3.2, the collisionality. The result of these simulations are shown in Fig. 5. The growth rate in the OH case (solid line, figure a) is mainly decreasing with and this trend is even emphasized when we changed (dotted) or (long dashed) to their value in the EC case. However, when the collision frequency was changed (dashed) the behavior of the growth rate curve became somewhat similar to that in the EC case (dash-dotted); the region for lower temperature ratios where the OH case showed increase in this parameter widened and the negative slope of the curve after the maximum growth rate is reduced. This effect of the collision frequency can be due to that for lower collisionalities – as it is in the EC case – the temperature gradient drive of the TE modes is more pronounced.
One might expect that the difference in the particle fluxes have the same origin as for the differences in the growth rates; that would mean that the modified collisionality particle flux (dashed curve, Fig. 5 b) should exhibit similar behavior to the EC flux (dash-dotted). This is partly true, as the positive slope region of the modified collisionality flux become somewhat wider and for higher values of the negative slope of the curve decreased. However, changing the density gradient (long dashed curve) shifted the shape of the particle flux curve closest to the EC heated case. From this we can conclude that the qualitative behavior of the temperature ratio scaling of the growth rates is mainly affected by collisions, while for the electron particle flux the electron density gradient is also an important parameter from this aspect.
3.4 Sensitivity to density and electron temperature gradients
Figure 6 shows the real frequencies and growth rates of the instability, together with the electron particle flux and as a function of the logarithmic density scale length .
Recalling that the logarithmic density gradients were in the OH, and in the EC case, for , we find that around these values the growth rate as a function of increases in both cases. This is not in contradiction with our previous statement that the EC case is more similar to a temperature gradient driven TE and the ohmic case is to a density gradient driven TE since both of them has some contributions from both drives. There is no qualitative difference in the curves in the experimentally relevant region, but interestingly if we allow higher density gradients we find that above the electron flux decreases with in the EC case, in contrast to the OH case which always drives higher particle flux for higher density gradient. This difference in the fluxes is related to the different behavior of the growth rates for higher density gradients; in the EC case saturates, while it is steadily growing with in the OH case. The sensitivity of the energy flux ratio to the density gradients is more pronounced in the OH case than the EC case, but in both cases has a positive slope.
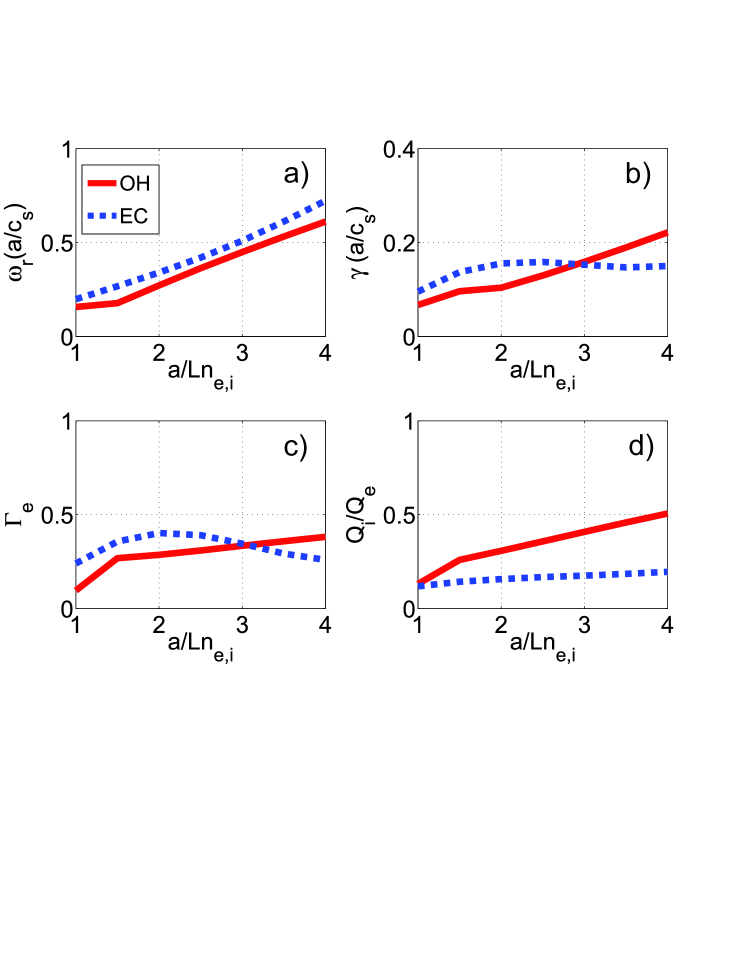
Figure 7 shows the real frequencies and growth rates of the instability, together with the electron particle flux and as a function of the logarithmic electron temperature scale length .
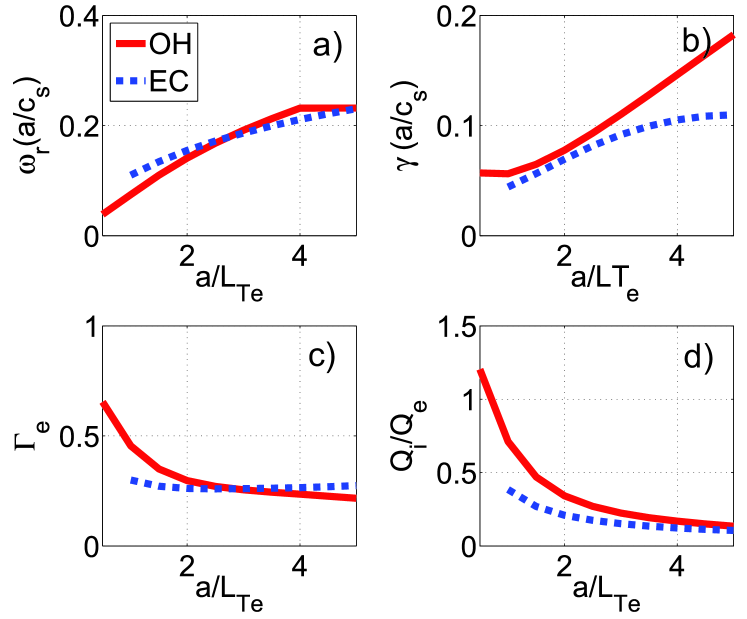
Keeping in mind that in the OH and in the EC case, we can see that the growth rate in the OH case are more strongly affected by a change in the electron temperature gradients than that in the EC case. This can be seem somewhat counter-intuitive while we state that the EC case is mainly driven by the electron temperature gradient. However, we should consider that in both of these cases the TE mode is not exclusively driven by either of the gradients, but both of them with different weights; clearly, increasing the in the OH case leads to that the case becomes more strongly driven by electron temperature gradients. Interestingly, although in the OH case the growth rate increases rapidly when the temperature gradient is increased and the ratio is decreasing due to the higher electron energy flux, the electron particle flux decreases with this parameter. In the EC case the electron particle flux is approximately constant over the plotted region, having a slight positive slope at the experimental value of .
3.5 Impurity peaking factor
In similar experiments as the one studied here, a short argon gas-puff was applied in a stationary phase of both OH and EC heated discharges, and the evolution of the density of Ar+16 impurity (with density ) was studied [6]. In discharges with on-axis EC heating, the argon density was found to decrease in the plasma center. The argon density reduction was proportional to the total input power. In this work we have studied the transport of a trace impurity with different charge in both EC and OH discharges. Our results indicate that the peaking factor becomes lower in the EC case, but it is still positive.
In experimental work, the particle diffusivity is often separated into a diffusive part and a convective part
where is the diffusion coefficient and is the convective velocity. This separation of the flux into diffusion and convection can be done in the trace limit of impurity concentrations, because then the turbulence remains unaffected by the presence of the impurity, and the impurity flux varies linearly with the impurity density gradient. The particle flux of higher concentration minority ions, bulk ions or electrons depends non-linearly on their density gradient as it can affect the growth rates of the mode.
The amplitude of the perturbed quantities cannot be calculated in linear simulations, accordingly the convective velocity and diffusivity are plotted in arbitrary units in Fig. 8 a, still allowing the comparison of the two experimental cases. In Fig. 8 b the steady state density gradient (or peaking factor) of impurities, is shown. The peaking factor is calculated from the criterion (assuming the non-turbulent particle fluxes and the impurity sources in the core negligible). All three quantities plotted in Fig. 8 exhibit a rather weak dependence on impurity charge. Furthermore for all three quantities, the ratio of their values for the two different experimental cases is almost independent of .
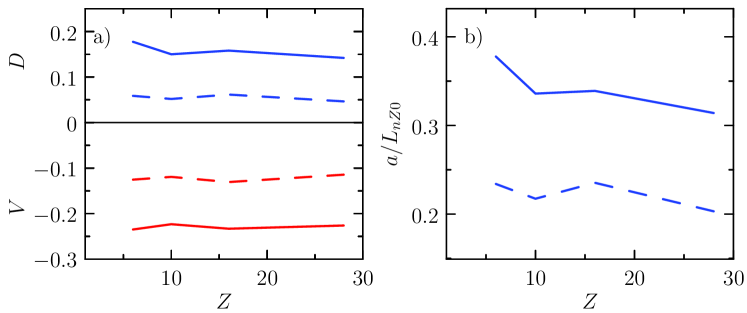
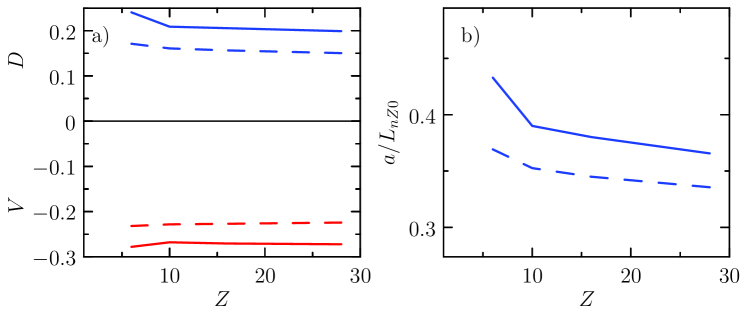
The impurity peaking factor is approximately times lower in the electron cyclotron heated case, consistently with the experimentally observed decrease of impurity content with EC heating. The inward pinch velocity is approximately times lower in the EC heated case than in the OH case and the ratio of diffusion coefficients in the EC and the OH case is lower being around , which leads to the lower peaking factor in the EC case.
The reduction of the peaking factor and in some cases even reversal of the impurity flux from inward to outward in the presence of ECRH has been noted before also in other experiments [4, 5]. This was partly explained by the fact that the fluctuation of the parallel velocity of impurities along the field lines can generate an outward radial convection for TE-modes [19]. We can identify the contribution of this effect in our cases by switching of the parallel ion dynamics in the gyrokinetic simulations, see the corresponding plots of , and impurity peaking factor in Fig. 9. The difference between the two experimental cases is smaller without parallel ion dynamics which means that, indeed, the contribution of the parallel ion compressibility drives the system away from peaked impurity profiles. However, the value is positive for both cases, although in experiments the impurities have a hollow profile corresponding to negative peaking factor. The reasons for the discrepancy might be due to that the effect of the Ware pinch is not considered, and we have only one wave number in a linear simulation instead of a whole range of interacting modes as in a nonlinear simulation. It should also be mentioned that gyrokinetic simulations perform usually better in terms of energy fluxes than for particle fluxes [24, 25], thus we do not expect perfect agreement between the experimental and simulated peaking factors.
4 Conclusions
We compared the transport characteristics in electron cyclotron heated and purely ohmic plasmas on the T-10 tokamak using linear eigenvalue solver gyrokinetic simulations with the gyro code. The aim was to obtain insights to the effect of electron cyclotron heating on the microinstabilities driving the turbulence, the corresponding particle and energy fluxes, and on the impurity particle transport.
The only linearly unstable mode found in these experimental cases is a trapped electron mode. The frequency of collisional de-trapping is typically much higher than the mode frequency in these cases, accordingly the instabilities exhibit dissipative TE mode features; they are stabilized by collisions. However the modes are not completely stabilized by the collisions similarly to what was previously found in [18] for density driven trapped electron modes. The higher linear growth rates found in the EC case are mainly due to the lower collision frequency in this high electron temperature plasma, and it is not an effect of the higher electron temperature gradient.
The dependence of electron particle flux on is qualitatively different in the two cases; in the OH case the electron particle flux decreases with this parameter, while it increases in the EC case. This behavior can be understood noting that the growth rate in the OH case decreases with increasing , but in the EC case the dependence of the growth rate on this parameter is much weaker. The TE mode growth rate in the EC case strongly increases with increasing density gradient, while the growth rate in the OH case is almost independent on this parameter for the experimentally relevant region . In spite of the differences in the growth rate in this region, the electron particle flux shows qualitatively the same behavior in both cases.
In TE mode dominated plasmas – as in our experimental scenarios – moving from pure ohmic to electron cyclotron heating leads to higher electron energy flux, since the collisional stabilization of the TE mode is less effective, and increasing the electron temperature gradient and electron-to-ion temperature ratio enhances the energy flux even further. On the other hand the turbulent electron particle flux can remain approximately unchanged as the TE growth rate decreases with increasing electron-to-ion temperature ratio, balancing the opposite effect of the lower collisionality and the higher electron temperature gradient. It leads to the conclusion that the experimentally observed slight flattening of the electron density profile may have other reasons, e.g. the strength and period of sawteeth in the central region can be different and this can have implications on the density profile.
The simulations indicate that the impurity convective flux is negative in both the EC and OH cases, but it is significantly lower in the EC case. Furthermore the impurity diffusion coefficient is lower in that case. As a consequence, the impurity peaking factor is lower in the EC case, however according to the simulations it does not change sign when electron cyclotron heating is applied. A sign change in the peaking factor is therefore probably due to some additional physical mechanism, not accounted for in the linear gyrokinetic simulations. Recent work shows that impurity poloidal asymmetries may lead to a reduction or even sign change in the peaking factor [22]. Poloidal asymmetries may arise due to large pressure or temperature gradients if the plasma is sufficiently collisional [23], and in this case it could be caused of the large temperature gradient due to EC heating. Finally, impurity accumulation is affected also by neoclassical processes, and the neoclassical impurity inward pinch is expected to be reduced in the presence of ECRH due to the flatter ion density profile.
Acknowledgments
The authors gratefully acknowledge helpful conversations with V. Krupin and V. A. Vershkov, and would like to thank J. Candy for providing the gyro code. The authors acknowledge the work of the T-10 experimentalists, who provided the information about plasma parameters. This work was funded by the European Communities under Association Contract between EURATOM and Vetenskapsrådet. The views and opinions expressed herein do not necessarily reflect those of the European Commission. One of the authors, S. M., acknowledges support from the Wenner-Gren Foundation.
References
- [1] P. Gohil, L. R. Baylor, K. H. Burrell, T. A. Casper, E. J. Doyle, C. M. Greenfield, T. C. Jernigan, J. E. Kinsey, C. J. Lasnier, R. A. Moyer, M. Murakami, T. L. Rhodes, D. L. Rudakov, G. M. Staebler, G. Wang, J. G. Watkins, W. P. West, and L. Zeng, Plasma Phys. Control. Fusion 45, 601 (2003).
- [2] H. Takenaga, S. Higashijima, N. Oyama, L. G. Bruskin, Y. Koide, S. Ide, H. Shirai, Y. Sakamoto, T. Suzuki, K. W. Hill, G. Rewoldt, G. J. Kramer, R. Nazikian, T. Takizuka, T. Fujita, A. Sakasai, Y. Kamada, H. Kubo, and the JT-60 Team, Nucl. Fusion 43, 1235 (2003).
- [3] A. Zabolotsky, H. Weisen and TCV Team, Plasma Phys. Control. Fusion 48, 369 (2006).
- [4] R. Dux, R. Neu, A. G. Peeters, G. Pereverzev, A. Muck, F. Ryter, J. Stober, and ASDEX Upgrade Team, Plasma Phys. Control. Fusion 45, 1815 (2003).
- [5] E. Scavino, J. Bakos, H. Weisen, and TCV Team, Plasma Phys. Control. Fusion 46, 857 (2004).
- [6] N. Timchenko, V. Vershkov, V. Karakcheev, D. Shelukhin, A. Dnestrovskij, V. Krupin, A. Gorshkov, D. Ryzhakov, I. Belbas, “The effect of EC heating on impurity transport in T-10”, Proceedings of the EPS Conference on Plasma Physics, Warsaw, (2007).
- [7] C. Angioni, A. G. Peeters, X. Garbet, A. Manini, F. Ryter, and ASDEX Upgrade Team, Nucl. Fusion 44, 827 (2004).
- [8] C. Angioni, R.M. McDermott, E. Fable, R. Fischer, T. Pütterich, F. Ryter, G. Tardini and the ASDEX Upgrade Team, Nucl. Fusion 51, 023006 (2011).
- [9] C. Angioni, A. G. Peeters, G. V. Pereverzev, F. Ryter, G. Tardini, and the ASDEX Upgrade Team, Phys. Rev. Lett. 90, 205003 (2003).
- [10] H. Weisen, A. Zabolotsky, C. Angioni, I. Furno, X. Garbet, C. Giroud, H. Leggate, P. Mantica, D. Mazon, J. Weiland, L. Zabeo, K. D. Zastrow, and JET-EFDA Contributors, Nucl. Fusion 45, L1 (2005).
- [11] M. Greenwald, C. Angioni, J. W. Hughes, J. Terry, and H. Weisen, Nucl. Fusion 47, L26 (2007).
- [12] H. Takenaga, K. Tanaka, K. Muraoka, H. Urano, N. Oyama, Y. Kamada, M. Yokoyama, H. Yamada, T. Tokuzawa, and I. Yamada, Nucl. Fusion 48, 075004 (2008).
- [13] N. Timchenko, V. Vershkov, V. Karakcheev, S. Krasnjanskii, V. Krupin, D. Shelukhin, V. Merejkin, D. Sarichev, A. Gorshkov, I. Belbas, “Experimental study of particles and heat transport in T-10 Ohmic plasmas”, Proceedings of the EPS Conference on Plasma Physics, Sofia, (2009).
- [14] J. Candy, R. E. Waltz, J. Comput. Phys. 186, 545-581 (2003). https://fusion.gat.com/theory/Gyro
- [15] T. Dannert and F. Jenko, Phys. Plasmas 12, 072309 (2008).
- [16] A. Casati, C. Bourdelle, X. Garbet, F. Imbeaux, J. Candy, F. Clairet, G. Dif-Pradalier, G. Falchetto, T. Gerbaud, V. Grandgirard, Ö. D. Gürcan, P. Hennequin, J. Kinsey, M. Ottaviani, R. Sabot, Y. Sarazin, L. Vermare and R. E. Waltz, Nucl. Fusion 49, 085012 (2009).
- [17] G.V. Pereverzev, P.N. Yushmanov, “ASTRA - Automated System for TRansport Analysis”, Max-Planck-Institut Für Plasmaphysik, IPP-Report, IPP 5/98 (2002).
- [18] C. Angioni, A. G. Peeters, F. Jenko, and T. Dannert, Phys. Plasmas 12, 112310 (2005).
- [19] C. Angioni and A. G. Peeters, Phys. Rev. Lett. 96, 095003 (2006).
- [20] C. Angioni, R. Dux, E. Fable, A. G. Peeters and the ASDEX Upgrade Team, Plasma Phys. Control. Fusion, 49 2027, (2007).
- [21] J. W. Connor, R. J. Hastie and P. Helander, Plasma Phys. Control. Fusion 48, 885 (2006).
- [22] T. Fülöp and S. Moradi, to appear in Physics of Plasmas (2011).
- [23] T. Fülöp and P. Helander, Phys. Plasmas 8, 3305 (2001).
- [24] C. Angioni, E. Fable, M. Greenwald, M. Maslov, A. G. Peeters, H. Takenaga, and H. Weisen, Plasma Phys. Control. Fusion 51, 124017 (2009).
- [25] R. E. Waltz, A. Casati, and G. M. Staebler, Phys. Plasmas 16, 072303 (2009).