Gravitational lens candidates in the E-CDFS
Abstract
We report ten lens candidates in the E-CDFS from the gems survey. Nine of the systems are new detections and only one of the candidates is a known lens system. For the most promising five systems including the known lens system, we present results from preliminary lens mass modelling, which tests if the candidates are plausible lens systems. Photometric redshifts of the candidate lens galaxies are obtained from the combo-17 galaxy catalog. Stellar masses of the candidate lens galaxies within the Einstein radius are obtained by using the -band luminosity and the color-based stellar mass-to-light ratios. As expected, the lensing masses are found to be larger than the stellar masses of the candidate lens galaxies. These candidates have similar dark matter fractions as compared to lenses in slacs and cosmos. They also roughly follow the halo mass–stellar mass relation predicted by the subhalo abundance matching technique. One of the candidate lens galaxies qualifies as a LIRG and may not be a true lens because the arc-like feature in the system is likely to be an active region of star formation in the candidate lens galaxy. Amongst the five best candidates, one is a confirmed lens system, one is a likely lens system, two are less likely to be lenses and the status of one of the candidates is ambiguous. Spectroscopic follow-up of these systems is still required to confirm lensing and/or for more accurate determination of the lens masses and mass density profiles.
Subject headings:
dark matter – gravitational lensing: strong – methods: data analysis – surveys: gems1. INTRODUCTION
Within the current standard cosmological model of the Universe, the gravitationally dominant component of matter is dark. Hence, dark matter governs the formation and evolution of the luminous matter like galaxies in the Universe. Gravitational lensing has proved to be a promising technique in the past few decades allowing us not only to measure the mass of dark matter halos which host luminous galaxies in their centres but also to probe the underlying dark matter distribution of the lensing halo.
Lensing has been used, for example, to constrain the slopes of density profiles in the central regions of galaxies (e.g., Koopmans et al., 2006; More et al., 2008) and clusters (e.g., Sand et al., 2002; Kneib et al., 2003), and to constrain cosmological parameters like the Hubble constant to a better accuracy (e.g., Fassnacht et al., 2002; Coles, 2008) and the cosmological constant (e.g., Oguri et al., 2008). Lensing surveys complemented with Hubble Space Telescope (HST) observations have explored various aspects of galaxy formation and evolution like studying the interstellar medium of lens galaxies (Falco et al., 1999), surface brightness evolution (Kochanek et al., 2000), mass density profile evolution (Koopmans et al., 2006), and stellar populations (Treu et al., 2006) of early-type galaxies.
Among the large-area surveys at high spatial resolution, the gems (Galaxy Evolution from Morphologies and SEDs, Rix et al. 2004) survey in the Extended Chandra Deep Field South (E-CDFS) is the largest contiguous HST survey with color imaging data to date. gems was initiated to study the evolution of normal and active galaxies out to high redshifts. gems observed 0.22 sq. deg. inside the E-CDFS in the optical F606W (=) and F850LP (=) filter band passes with one orbit per pointing. In the center, it contains the goods south area. Of 60 000 objects in the field, 14 000 are galaxies down to with photometric redshifts from the combo-17 survey. The spectral energy distributions (SEDs) available from combo-17, besides allowing accurate photometric redshift estimates, allow classification into various galaxy types, including active nuclei (Wolf et al., 2004). Stellar mass estimates for all the galaxies are also available from SED fitting (Borch et al., 2006).
The depth and relatively large volume of the GEMS survey is apt for finding incidences of strong gravitational lens systems. For example, the strong lens survey from All-wavelength Extended Groth strip International Survey (aegis) which has comparable depth and survey area to gems, has found a sample of three lenses (Moustakas et al., 2007). Also, the strong lens survey from COSMOlogical evolution Survey (cosmos) which has a much larger survey area in a single band with HST, find about 20 good lens candidates (Faure et al., 2009). An unbiased sample of lenses can be used to constrain the faint end of the background source luminosity function, to measure the optical depth for lensing, to study the dark matter fraction in galaxies and its evolution, and to study the connection between dark matter halos and galaxy properties.
In this paper, we present a sample of gems lens candidates in the E-CDFS. The structure of the paper is as follows. In section 2, we calculate the expected number of lenses and explain the steps involved in the selection of the lens candidates. In section 3, we describe the decomposition of HST images into candidate lensing galaxy and candidate lensed images. The decomposition is carried out by using the two-dimensional surface brightness modelling program Galfit (Peng et al., 2010). We model the candidate lens systems as gravitational lenses and check whether the derived model parameters are consistent with a gravitational lens case. If the image configuration is not due to gravitational lensing, it is likely that no sensible lens model can reproduce the lensed image configuration. We present results of the mass modelling in section 4. In section 5, we compute the stellar mass of the candidate lensing galaxy, using color-based stellar mass-to-light ratio (MLR) and compare with the lensing masses as a sanity check. Furthermore, we compare the sample properties with those in the literature, and discuss the probability of the candidates being lens systems. We end with a brief summary in section 6. We use the following cosmological parameters in our calculations: , , and H km s-1 Mpc-1.
2. GEMS LENS SAMPLE
2.1. Expected Number of Lenses
The number of lenses expected to be found in a given survey depends upon the survey area, the source number density, , and the optical depth for lensing, . The number of lenses per unit steradian, is given by
| (1) |
where is the source redshift and is the intrinsic source limiting magnitude. We estimated the expected number of lenses in the gems survey by using optical depths from Table 2 of Faure et al. (2009). These optical depths were estimated by integrating the lensing cross-section of halos in the Millennium Simulation. We calculated by following Eq. 1Eq. 3 of Faure et al. (2009) which requires the distribution of source redshifts and source counts. We adopt the source redshift distribution given by
| (2) |
where and and use the cumulative source counts distribution from the F814W() band data of the Hubble Deep Field South (HDF-S, Casertano et al., 2000). The band limiting magnitude of gems is used to calculate a corresponding band limiting magnitude. The HDF-S sources follow the relation and gems has a band limiting magnitude of 28.25 (Rix et al., 2004). Thus, a corresponding equivalent limiting magnitude in band for gems would be 27.76. We note that due to lensing magnification, sources which are intrinsically fainter than the limiting magnitude might also fall into our lens sample. This would mean that our calculation of expected no. of lenses based on sources only brighter than limiting magnitude might be biased. However, we can de-magnify the lensed images, using the magnification factors from the lens mass models, to calculate the intrinsic magnitudes of respective sources. These source magnitudes happen to lie well-above the limiting magnitude used in our calculation. Therefore, assuming our lens mass models are correct, our calculation of expected number of lenses is less likely to be biased due to this effect. By integrating Eq. 1 from to , we expect about eight lens systems in a survey area of 0.22 sq. degrees, down to the limiting magnitude.
2.2. Selection of Lens Candidates
We adopted the following approach to find gravitational lens candidates in the GEMS field. As a first step, we selected all galaxies above a stellar mass of and redshift from the combo-17 catalog (Borch et al., 2006) of 25 000 galaxies. Massive lens galaxies are generally more efficient lenses and produce larger image separations which are easier to detect. These galaxies are also, generally, the more luminous galaxies at each redshift. As a result, such galaxies have a high signal-to-noise ratio (SNR). The cut at ensures that galaxies with reliable redshifts are included in the sample. Also, this limit corresponds to the redshift at which the redder -band filter moves beyond the 4000Å-break, so we would start to see pure UV images beyond this redshift. In addition to a decrease in the SNR, more clumpy star forming structures show up more prominently in such cases, increasing the chance for contamination of good lens candidates with normal star-forming galaxies. These limits helped us to narrow down our search to a massive subsample of galaxies which are more likely to exhibit strong lensing signatures. The first step leaves 1225 combo-17 galaxies of which 1054 are covered with ACS imaging data by the gems survey.
In the second step, we visually inspected the 1054 galaxies, looking at both color composite images as well as the two bands individually in different gray-scale stretches. This allowed us to see both the surface brightness structures as well as color-differences, if any, between the image components. We selected possible lens candidates based on the presence of a) multiple image components or arc-like structures mimicking typical lensed image configurations, and/or b) color differences to the main body of the central galaxy. We found 29 candidates at the end of this inspection with some being more likely lens systems than others. Three people ranked these candidates visually from 1 being the least likely to 4 being very likely candidates. A total of 19 candidates had average ranks below 2. Of the remaining 10 candidates, five had average ranks between 2 and 3 and five had ranks . One of the top five candidates is a confirmed lens system (J033238-275653, Blakeslee et al., 2004) with combo-17 ID 15422. We analyze this system along with the rest of the candidates. The top five candidates with ranks are listed in Table 1 and examined in the rest of this paper whereas the five low probability candidates are described in the appendix.
3. Surface Brightness Modelling
We use the publicly available software Galfit to model the two-dimensional light distribution in images. Galfit is a very flexible code and allows fits to the light distribution with a large choice of radial surface brightness profiles, number of distinct components, choice of PSFs. Galfit in its newest version (V3, Peng et al., 2010) allows a more flexible analysis through the possibility of applying “bending” modes to components and adding a banana-shaped bend to an otherwise elliptical shape. This facilitates adapting the models of the source in the presence of gravitational arcs.
Generally, we model all systems with one or two components for the lensing galaxy and up to four for the lensed images. The choice of component numbers is not physically motivated but was adapted to describe the whole system well enough so that the candidate lensing galaxy and the putative lensed images can be well separated. Testing was done iteratively from repeated modelling runs with different numbers of components and different degrees of freedom to each component e.g. bending modes switched on or off. The final choice is slightly subjective but the solution regarding the exact parameters, at the same time, is quite degenerate. Since we do not use output model parameters from Galfit itself, but only from the extracted images, this procedure is very robust. We give the individual number of components used for each object in Table 1.
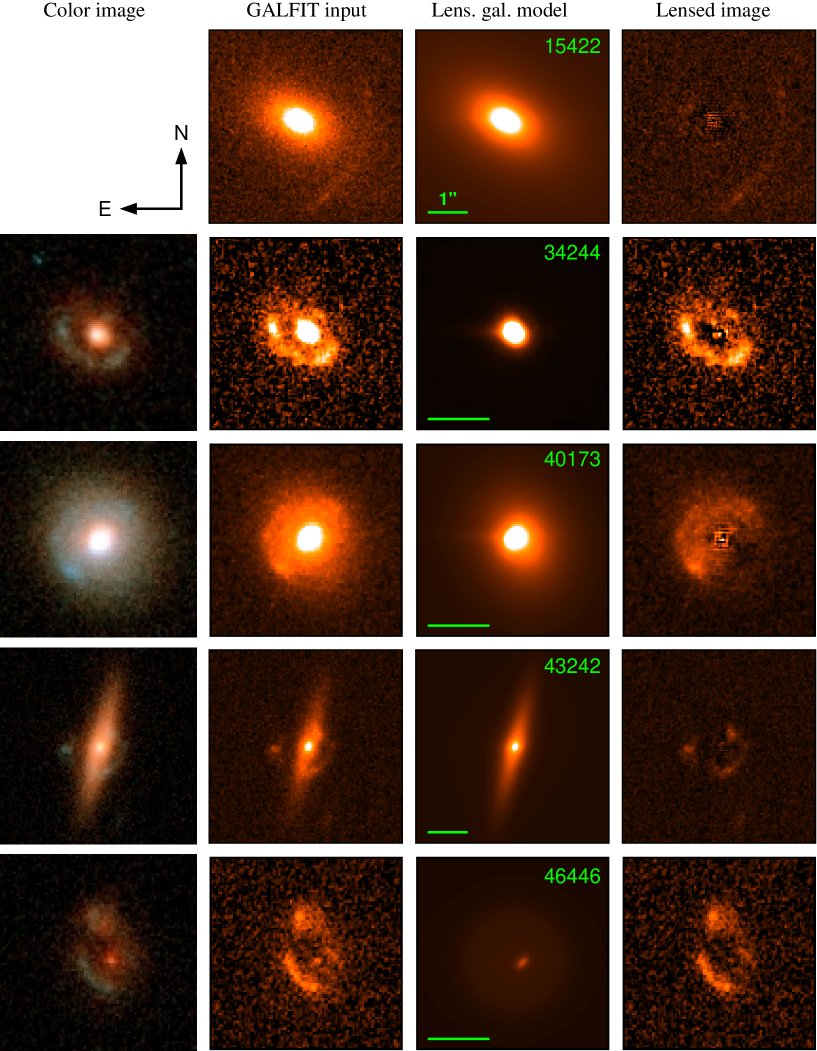
For four out of five objects, both and band images are available and we model the deeper band images using the Galfit software. The object 15422 lies on GEMS tile #44 for which the band is missing and thus, we revert to modelling the band. Each row in Fig. 1 corresponds to one candidate. From left, the columns show a composite – color image of the sample object, where available, as well as the Galfit modelling results: the input (or ) band image, the surface brightness model for the lensing galaxy, and the frame resulting from subtraction of the model showing only the lensed images.
4. Lens Mass Modelling
4.1. Standard Mass Models
The magnitude of deflection and distortion of a light ray bundle arriving at a point in the lens plane from a background source depends upon the surface density distribution of mass in the lens. To zeroth order, the surface mass density distribution around galaxies follows a spherically symmetric singular isothermal profile (SIS) given by
| (3) |
where is the velocity dispersion of the dark matter particles, is the physical separation in the lens plane and is the gravitational constant. Dark matter halos are triaxial in nature. Therefore an elliptical mass distribution is a more realistic description of the surface density distribution. The expression that describes the surface density distribution for a singular isothermal ellipsoid (SIE) with an axis ratio, q, is given by Kormann et al. (1994),
| (4) |
Here, and denote the projected physical separations along the major and minor axes of the distribution, respectively. The lensing observables are sensitive to a quantity called convergence () which is defined as the ratio of the surface mass density distribution to a critical surface density. The critical surface density depends upon the geometrical distances between the source, the lens, and the observer and is given by , where is the speed of light, is the angular diameter distance between the observer and the lens, is the distance between the lens and the background source, and is the distance between the observer and the background source.
Using constraints from extended images is particularly helpful when the background source is to be reconstructed for further analysis.
We use the software package gravlens (Keeton, 2001) to make lens mass models for our candidates. The software package uses the image positions (and optionally, their fluxes) and the lens position along with their error bars as constraints and outputs a model that best fits the constraints. For the purpose of estimating masses of the lens galaxies, use of the surface brightness peak positions is usually sufficient. A significant improvement is not expected in the estimate of the Einstein radius by using the extended surface brightness information. This is postponed until deeper imaging is obtained especially for studying the background sources.
The convergence at a point (, ) in the sky is defined as111For further details, see eqs. in the GRAVLENS manual.
| (5) |
where is the critical radius (also known as the Einstein radius). As is clear from Eqs. 4 and 5, the critical radius and the velocity dispersion () are related by
| (6) |
Integrating the surface mass density within the area enclosed by the tangential critical curve222The tangential critical curve is an iso-density contour within which the . It is the locus of points where lensed images are infinitely magnified and are stretched in a tangential direction. yields the lens mass within the critical curve, , which is given by
| (7) |
The first factor on the right hand side of Eq. 7 becomes unity in the case of a SIS profile (i.e., when ). In addition to the surface mass density distribution, an external shear is often added to the lens model to account for the tidal effects of the environment on the lensed image observables. The position angles in the lens models are measured East of North such that North is 0 deg and East is 90 deg.
An SIS model has a total of 5 free parameters: the position of the lens, its critical radius, and two parameters that describe the position of the source. An SIE model has two additional parameters, the ellipticity (given by ) and its position angle. The external shear introduces 2 more parameters, the shear strength, and its position angle, to each of these models. A doubly imaged system provides a total of 6 constraints: 4 constraints from the 2 image positions and 2 constraints from the lens position. In the absence of any constraints from the flux ratios, we only use the SIS model so as to avoid an over-fit to the data. Similarly, a quadruply imaged system will have a total of 10 constraints: 8 constraints from the 4 image positions and remaining 2 constraints come from the lens position. This allows us to fit the data with SIS+shear and SIE+shear models. In case of SIE+shear model, the external shear is often found to be degenerate with the ellipticity.
4.2. Mass Modelling Results
Using the above models, we present results from preliminary mass modelling of the lens candidates. The aim is to test if simple mass models can reproduce the configuration of lensed images with reasonable values of the model parameters.
Two kinds of image configurations are commonly seen in four-image lens systems, namely, a cusp and a fold. In the former, three lensed images are highly magnified and tend to merge whereas, in the latter, any of the adjacent two images are highly magnified and tend to merge. We assume either of the above image configurations (except for candidate 40173 which is probably doubly imaged) for our mass models and describe the tests carried out on all of our candidates.
Throughout the modelling, we use peak positions of the images and the lens galaxy as constraints for the mass models. The positions of the images were visually determined at the peak of surface brightness (whenever possible) whereas the peak position for the lens galaxy was chosen by fitting a Sersic profile. The errors on the positions of the images and the lens galaxy were assumed to be arcsec and arcsec, respectively. Note that the pixel scale is arcsec.
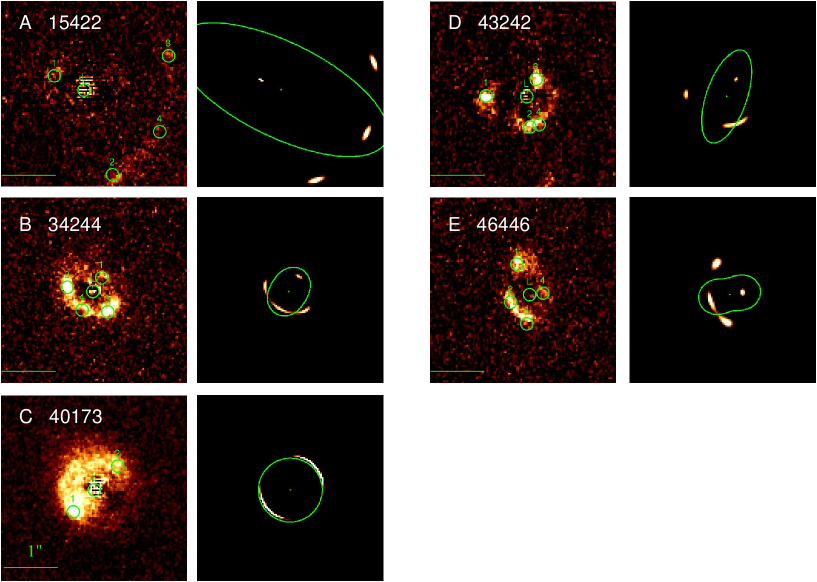
In the following, we describe the mass modelling analysis for five of the best candidates. The results of the mass models for each candidate are shown with a pair of panels in Fig. 2. Every left panel has the model-predicted positions overlaid on the true lensed images with the foreground galaxy subtracted. Every right panel shows a reconstructed lensed image configuration assuming a Sersic model for the background source with arbitrarily chosen values for the parameters and using the best-fitting model for the lens galaxy. This is for illustrative purposes only. The solid green curves in the figure are the critical curves corresponding to the best-fitting lens model.
15422: This is the only system from our sample which is known to be a confirmed lens system (Blakeslee et al., 2004, hereafter, B04). The lens galaxy has a spectroscopic redshift of 0.62 and a photometric redhift of 2.4 is estimated for the background source. The mass modelling of B04 suggests that the velocity dispersion of the lens galaxy is 305 km s-1.
For the sake of consistency and completeness, we make mass models with our data and compare our modelling results with B04. In this system, one can clearly see a thin elongated arc. A faint counter-image is usually expected and can actually be seen in Fig. 1 where the lens galaxy has been subtracted. This counter-arc is clearly visible in B04. We use the peak positions of all four images as constraints to the mass models.
We test an SIE mass model alone motivated by the elliptical light distribution of the lens galaxy. A SIE model fits reasonably to this lens system with a reduced of 3. The Einstein radius is found to be 1.20 arcsec. The mass model suggests an ellipticity of 0.60 with a position angle of 64 deg. This is consistent with the ellipticity and the position angle measured from the distribution of light from the lens galaxy. The image positions predicted by the SIE model are shown with circles in the left panel of A in Fig. 2 overlaid on the lens-subtracted optical image. The right panel of A in the figure shows a reconstructed lensed image assuming a source lensed by the best-fitting SIE model. The green ellipse shows critical curves of this model.
In conclusion, the SIE model constrained by the arc and counter-image provides a reasonably good fit. A comparison of our modelling results with B04 is done in Sect. 5.2.
| IDaafootnotemark: | Tilebbfootnotemark: | RAccfootnotemark: | DECccfootnotemark: | ddfootnotemark: | ddfootnotemark: | eefootnotemark: | fffootnotemark: | comp.ggfootnotemark: | log(hhfootnotemark: | log()iifootnotemark: | jjfootnotemark: | kkfootnotemark: | log()llfootnotemark: |
|---|---|---|---|---|---|---|---|---|---|---|---|---|---|
| 15422 | 44 | 03:32:38.21 | –27:56:53.2 | – | 19.20 | 0.58 | 0.62 | 1+3 | 11.4 | 11.22 | 1.20 | 0.40 | 11.80 |
| 34244 | 94 | 03:32:06.45 | –27:47:28.6 | 23.43 | 21.11 | 1.00 | 1.02 | 1+4 | 11.0 | 10.82 | 0.40 | 0.48 | 11.04 |
| 40173 | 35 | 03:33:19.45 | –27:44:50.0 | 20.86 | 19.67 | 0.44 | 0.42 | 2+3 | 10.7 | 10.58 | 0.59 | 1.00 | 10.85 |
| 43242 | 45 | 03:31:55.35 | –27:43:23.5 | 21.85 | 20.00 | 0.66 | 0.66 | 2+3 | 11.1 | 11.04 | 0.57 | 0.60 | 11.08 |
| 46446 | 47 | 03:31:35.94 | –27:41:48.2 | 23.60 | 21.70 | 0.88 | – | 2+3 | 10.6 | 10.37 | 0.42* | 1.00 | 10.90 |
a–ID from the combo-17 catalog. b–gems tile number (1–63 gems, 80–95 goods region). c–positions of candidates are in J2000 with units of hrs:min:sec and deg:min:sec. d–Apparent = and = HST/ACS magnitudes of the whole system (Caldwell et al., 2008). e–Photometric redshift of lensing galaxy from combo-17. f–Spectroscopic redshift of lensing galaxy (see Sect. 5.2 for details). g–Number of components used in Galfit composition for lensing galaxy + lensed images. h–Total stellar mass of the lens galaxy in units of from Borch et al. (2006). i– Stellar mass of the lens galaxy inside the critical radius in the units of . j–Einstein radius in arcsec corresponding to SIE model except * is corresponding to SIS+shear model. k– axis ratio from the lens mass model l–Mass within the critical curve in units of . The upper and lower limits correspond to the 16th and 84th percentile of the lens mass PDF.
34244: In this system, a cusp configuration is likely and a counter-image is clearly detected. As before, we test three possible mass models namely, SIE, SIS+shear and SIE+shear.
The SIE model suggests an ellipticity of 0.52 with a position angle of deg. The Einstein radius is found to be 0.40 arcsec. The model predicted image positions overlaid on the lens-subtracted residual image are shown in left panel of B in Fig. 2. The right panel of B shows an artificial source lensed with the best SIE model along with the critical curves. A SIS+shear model indicates a high shear of about 15 per cent also at the position angle of deg and Einstein radius of 0.42 arcsec.
Both the ellipticity and shear could not be simultaneously constrained with the image positions unless a prior on the ellipticity was used from the intensity distribution. Thus, to test a SIE+shear model, an ellipticity of 0.36 with a position angle of deg was used from the light profile of the lens galaxy. The best-fit model has a moderately high shear of 9 per cent with a position angle of deg.
All of the above models have reduced and hence, are equally favorable. Using the constraints from the image positions, the SIE, and SIS+shear models suggest a position angle of deg for the ellipticity in the lens potential. On the other hand, the position angle of the intensity distribution of the lens galaxy shows a significant offset from the model predicted value indicating inconsistencies in the alignment of matter and light distribution. It is unclear if any one of the above models is better than the others due to lack of physically motivated values of the parameters.
Here, the SIE model may be referred to as the current best-fitting model. A subsequent investigation of the lens and its environment might help in testing whether the misalignment between the matter and light distribution is physical.
40173: Owing to the circular symmetry of the surface brightness distribution, this candidate could be an example of a partial Einstein ring or a double lens system. Since the lens-galaxy light subtraction may not be accurate, the residual arm-like structure could be misleading. Instead, we choose a two-image configuration. An SIS model, centered at the position of the lens galaxy, can be tested using the peak positions of two images as constraints. An Einstein radius of arcsec with a symmetric isothermal density profile reproduces the image separation. Model predicted image positions and an ideal source lensed by the mass model are shown in left and right panels of C in Fig. 2, respectively.
However, fitting the image separation alone can not, necessarily, indicate gravitational lensing in the system. Spectra of the lensed images will be crucial in concluding whether blue arc-like feature is a site of star-formation at the lens redshift or a lensed arc. Note that, if this indeed is a lens system then size of the Einstein radius can give a very accurate measure of the mass within the Einstein radius, irrespective of the assumed density profile.
43242: This lens system appears to be in a fold configuration. We assumed that the two southernmost images are merging to form an arc-like feature. With the positions of four images, following models are tested.
Firstly, SIE and SIS+shear models are tested. Both the models fit equally well with a reduced . The Einstein radius of the lens galaxy is about arcsec with an ellipticity of at a position angle of deg or alternatively, a shear with per cent strength at the same position angle. The panels of D in Fig. 2 show the critical curves for an SIE mass model on the right whereas the observed and model-predicted image positions (green circles) on the left. The ellipticity of the bulge of the lens galaxy is with a position angle of deg which is consistent with the ellipticity of the SIE model. Using this ellipticity as a constraint in a SIE+shear model results in equally good fit. The shear for this model is per cent with a position angle of deg. This implies that the bulge component along with reasonable shear strength can reproduce the configuration of the lensed images.
Deep observations are certainly desirable to well-resolve the arc and high surface brightness images which are contaminated due to the emission from the lens galaxy. Furthermore, if this system hosts a lens then spectroscopic redshifts will provide better constraints in measuring the total mass of the late type lensing galaxy bulge. This would be interesting since there are only few late type lenses known in the literature (e.g., Féron et al., 2009; Sygnet et al., 2010; Dutton et al., 2011).
46446: This candidate indicates a fold configuration, more obvious in the bottom-right residual image of Fig. 1. We model the lens system with standard isothermal models.
The SIS+shear and SIE models for this system suggest Einstein radii of arcsec and arcsec for the lens galaxy, respectively. The reduced for these models is . The models need either high shear of 30 per cent at a position angle of deg or a high ellipticity of at a position angle of deg. The brightness profile fitting to the lens galaxy also implies an unusually high ellipticity of . However, the extremely high shear is unexpected for a galaxy-scale lens system. Using priors on the ellipticity from the light profile, a SIE+shear model is tested. The parameter space of ellipticity and shear has a broad degeneracy resulting in a range of equally favorable models.
The left panel of E in Fig. 2 shows the predicted image positions with green circles using SIS+shear model overlaid on the lens-subtracted image. The right panel of E in Fig. 2 shows the critical curves and the reconstructed image configuration assuming the best-fitting SIS+shear model parameters which well-reproduce the positions of the observed lensed images.
The high ellipticity of the lens from the mass model is inconsistent with the morphology and optical properties of the central galaxy. The concentration of light in the central regions of the lens galaxy does not suggest a high concentration of mass which is required for it to be a lens. In addition, statistically, we expect more red galaxies with star-forming shells than red lens galaxies. Therefore, it would be decisive to know the redshifts of the blue features.
5. DISCUSSION
5.1. Color-based Stellar Masses
We compute the stellar mass inside of the critical curves (see Sect. 4.2) by weighting the luminosity in the -band with the stellar MLR as derived from the () color. According to Gallazzi & Bell (2009), who used a large Monte-Carlo library of star formation histories to assess the systematic uncertainties in calculating stellar mass-to-light ratios, a blue rest-frame optical color is a good proxy for the MLR. Dust attenuation, metallicity, and age have degenerate effects on the MLR derived from colors and on the luminosity. Incidentally, the effects act in opposite directions on MLR and luminosity which cancel out to a good extent. As a result, the estimated stellar mass is fairly robust against variations in these parameters, of which it is not possible to have independent estimates.
We estimated the stellar masses for our lens galaxies with a Bayesian statistical approach as outlined in Gallazzi et al. (2005). We created a library of model SEDs by convolving Bruzual & Charlot (2003) simple stellar population (SSP) models of different metallicities, ranging from 20 per cent to 2 times the solar metallicity, with a Monte Carlo library of complex star formation histories (SFH), and dust attenuations. We followed the prior distribution adopted by Salim et al. (2005) and assumed an initial-mass-function (IMF) of Chabrier (2003). The stellar mass of each model is computed by multiplying the of the redshifted model with the observed luminosity of the lens galaxy. Inputs for each target are the observed and fluxes of the candidate lensing galaxy inside the critical curve after Galfit-based subtraction of the lensed images as well as the redshift of the lens galaxy. For each galaxy, we built the probability density function (PDF) of by comparing the observed color with the color of the models computed at the redshift of the galaxy. Only models with formation age younger than the age of the Universe, at the redshift of the galaxy, contribute to the PDF. The stellar mass of the galaxy is then estimated as the median of the PDF with a 68% confidence interval given by the 1684th inter-percentile range. The results are listed in Table 1.
For the object 15422, we only have the flux at F850LP. Hence, no color information can be obtained. Motivated by the S0-like morphology of this galaxy, we assume that it has a rather smooth SFH and intermediate/old stellar population. This translates into selecting models without a burst in the last 2 Gyr and with Åbreak values typical of S0 galaxies (roughly between 1.4 and 2, Poggianti et al. 2008), in addition to the constraint that the formation age be younger than the age of the Universe at the galaxy redshift. To estimate the stellar mass of this galaxy, instead of computing the PDF, we simply take the median and percentiles of the distribution in for the models satisfying these criteria.
5.2. Lensing Mass Estimates
The Einstein radii and the axis ratios of the best-fitting mass models are listed in Table 1 along with the photometric and spectroscopic (whenever available) redshifts of the lens galaxies. Spectroscopic redshifts of the main galaxies were available for 15422 (Blakeslee et al., 2004) and 34244 (Vanzella et al., 2005). Furthermore, as a part of Arizona CDFS Environment Survey (ACES) spectroscopic redshifts have been measured for the main galaxies in 40173 and 43242 (Cooper et al. 2011, in prep). Thus, we use the photometric redshift for 46446 only although we note that any flux contamination from the putative lensed features might bias the photometric redshift estimate and hence, the lens mass. Any quantitative estimation of this bias would require tests with simulations which is beyond the scope of this paper. Since the redshifts of the lensed sources are not known, we use the PDF of the redshifts of the background sources333We note that B04 provide a photometric redshift for the background source in 15422. However, we use the source redshift PDF as a sanity check of our analysis and compare our lens mass estimate to that of B04. (see Eq. 2 in Sect. 2.1. Thus, masses of the lens galaxies within the Einstein radii are calculated by substituting above described parameters in Eq. 7. The median masses are given as in Table 1. The error bars reflect the 16th and 84th percentile of the PDF of mass, given the lens model parameters and the source redshift PDF.
Using the Einstein radius, lens and source redshifts of B04 in case of 15422, we find that their lens mass within the Einstein radius is log. This mass is consistent with our estimate of log from our mass model and assuming a PDF for source redshift instead (see Table 1). In the case of 40173, we note that there is a hint of an inner arc-like feature from another source which may or may not be at the same redshift as the source lensed into the outer arc. Given the quality of the image it is difficult to say which of the blue features in the inner and outer arcs correspond to which sources. Nevertheless, if we assume that the outer arc does have a counter-arc on the inner side, then the fractional change in the masses is about 0.1 dex which is within the uncertainty arising from the lack of knowledge of the source redshift.
5.3. Comparison of Lensing and Stellar Masses
Table 1 gives the mass estimates obtained from lens mass modelling and stellar masses within the critical curve of each system. Comparison of the two masses shows that lens mass estimates are consistently higher than the respective stellar masses of all the candidates. This conforms to the scenario that lensing measures total projected mass (dark matter and luminous matter) and should be larger than the stellar mass, which is sensitive to the luminous mass alone, within the same aperture.
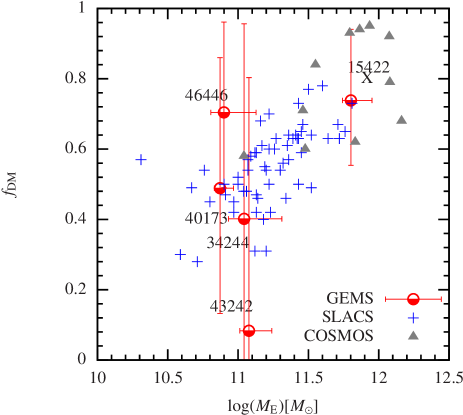
Early-type galaxies happen to lie on a Fundamental Plane (FP) defined by the surface brightness, the effective radius, and the velocity dispersion. However, observationally the early-type galaxies are found to deviate from the naive L expectation and this deviation is referred to as the tilt of the FP. The origin of the tilt is thought to be due primarily to the content of dark matter in the early-type galaxies (e.g., Padmanabhan et al., 2004, although variations in stellar MLR and structural non-homology can affect the tilt as well, possibly to a minor degree). Projected dark matter (DM) fractions for lens galaxy samples have been calculated in surveys like slacs (Auger et al., 2010) and cosmos (Faure et al., 2010). The projected DM fraction is found to be positively correlated with the lens mass in early-type lensing galaxies as shown in Fig. 3. The projected DM fraction () is calculated for all the gems candidates and shown as a function of the lens mass () in Fig. 3. For 15422, we also estimate the using the lens mass of B04 and stellar mass from Table 1. This is denoted by label “X” in Fig. 3 and is consistent with our estimate within the uncertainties. Comparison with the slacs and cosmos lenses shows that the gems candidates roughly follow the same correlation. A more conclusive result can be presented when the background source redshifts are measured which will accurately determine the lens masses.
We further checked where do the candidate lens galaxies lie on the halo massstellar mass plane. To test the above, we need to compare the mass of the halo with the total stellar masses. We calculated the velocity dispersion () using the Einstein radius and Eq. 6. We used the to calculate the virial mass () for each of the lens galaxies following the relation given by Bryan & Norman (1998),
| (8) |
Here, is the redshift dependent Hubble parameter and is the gravitational constant. The virial mass is defined to be the mass of the halo within a radius that encloses a density contrast of with respect to the critical density of the Universe. We used the fitting function provided by Bryan & Norman (1998) to calculate as a function of the cosmological parameters and the redshift.
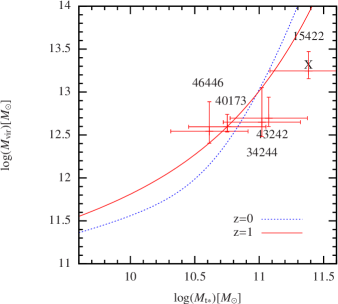
The halo masses () of these galaxies thus obtained are shown as a function of their stellar masses () in Fig. 4. We use total stellar masses444Note that the total stellar masses () and stellar masses integrated inside the critical curve () are consistent within the 0.3 dex uncertainties. from Borch et al. (2006) which are given in Table 1. The horizontal error bars show an uncertainty of 0.3 dex in the stellar mass. The vertical bars represent the masses within the 16th and 84th percentile of the PDF. Note that the error bars on the mass do not include any systematic uncertainties due to the assumption of an isothermal density profile or the effects of adiabatic contraction of the halo. Observationally, early-type galaxies show evidence for the contraction of the halo (see e.g., Schulz et al., 2010; Dutton et al., 2010) whereas late type galaxies show the opposite (Dutton et al., 2010). Note that adiabatic contraction, if present, will cause the density profile to be closer to our assumption of an isothermal density profile in the inner regions.
We also plot the halo massstellar mass relation inferred from the subhalo-abundance matching technique by Behroozi et al. (2010) at redshift of 0 (dashed curve) and redshift of 1 (solid curve) in Fig. 4 for comparison. Their relation at is in agreement with results from weak lensing (Mandelbaum et al., 2006), kinematics of satellite galaxies (More et al., 2010), and studies using a SDSS group catalog (Yang et al., 2009) while the relation at is consistent with results from Drory et al. (2009). For 15422, we also estimate the using the lens velocity dispersion of B04 and total stellar mass from Table 1. This is denoted by label “X” in Fig. 4 and is consistent within the uncertainties.
It is interesting that within the uncertainties of our measurements, all of the five systems roughly follow the halo massstellar mass relation predicted by the subhalo abundance matching technique. Although this does not conclusively confirm the lensing nature of these candidates, it certainly adds more credibility to the candidates being lens systems.
5.4. Cross-identification in Imaging at Other Wavelengths
The HST lens candidates from gems were checked for cross-identifications in data at other wavelengths, namely X-rays, mid-infrared, and radio. The E-CDFS was observed with the Chandra X-ray telescope by Lehmer et al. (2005), with Multi-band Imaging Photometer for Spitzer (MIPS) at 24m by Papovich et al. (2004), and the CDFS was surveyed in the radio using the Very Large Array (VLA) by Kellermann et al. (2008). None of our lens candidates were found in X-ray imaging. However, astrometric comparison with the 24m and radio catalogs yielded one matched candidate.
Object 34244 from our sample is identified as object 82 from the VLA sample with an offset of 07 in position. The radio object 82 lies at an RA of and DEC of and was measured to have a flux density of 80 Jy at 1.4 GHz. This corresponds to a 1.4 GHz rest-frame luminosity of 1023.55 W Hz-1. This candidate is also detected with MIPS at a flux density of 315.76 Jy.
We inferred the total infrared (TIR) luminosity of 34244 both from the radio flux using the radio-IR correlation (e.g., Yun et al., 2001), and from the 24 m flux using the templates of Chary & Elbaz (2001) to convert it to TIR. Hence, the TIR inferred from either the 1.4 GHz radio flux of 80Jy (Kellermann et al., 2008) or the 24m flux of 315.76 Jy (Papovich et al., 2004), is 1–5 . This is in the range of the TIR luminosity of the luminous infrared galaxies (LIRGs). We use the radio–SFR and TIR–SFR relations from Bell (2003) to convert the radio and the TIR luminosities into a star-formation rate. The star-formation rates derived from the radio and IR are 16 /yr and 80 /yr, respectively. Thus, in accordance with their fluffy and not very sharp appearance the blue arc-like features in 34244 could well be star-forming shells instead of being lensed images of a background galaxy. We note that, recently, an optical spectrum of the galaxy was taken with VIMOS on the Very Large Telescope (VLT) by Silverman et al. (2010). The slit had a width of 1 arcsec and was oriented along north-south. The slit is expected to go through a part of the arc-like feature. There is no clear detection of presence of a higher redshift object, however, any signal in the composite spectrum could have been washed out due to the seeing (J. Silverman, private communication).
| Name | Reference | Telescope | Bands | Area | Depth | lens | Confirmed |
|---|---|---|---|---|---|---|---|
| (deg2) | mag | candidates | /followed-up systems | ||||
| aegis | Moustakas et al. (2006, 2007) | HST | , | 0.18 | 7 | 3/0 | |
| gems | This work | HST | , | 0.22 | 10 | 1/0 | |
| cosmos | Faure et al. (2010) | HST | 1.80 | 88 | 4/18 | ||
| CFHTLS-sl2s | Gavazzi et al., in prep | CFHT | ,,,, | 170 | 330 | 40/65 | |
| SDSS-slacs | Bolton et al. (2006) | Sloan | spectroscopy | 3732 | 131 | 63/131 |
5.5. Future Investigations
In this paper, we have carried out various tests to investigate the lensing nature of our candidates. However, none of our tests can be considered conclusive and the candidates need further investigation. We give directions for future work in order to confirm or rule out lensing and/or what one could learn from these systems, if they are true lenses.
Although 15422 is a confirmed lens system with a known spectroscopic redshift for the lens galaxy, no spectroscopic redshift for the background source is available. We note that the lens subtracted images of B04 reveal another source at a different redshift which is lensed as a quad with a smaller Einstein radius than the arc visible in Fig. 1. Spectroscopic redshifts of both the background sources need to be measured for a detailed and sophisticated analysis of this system. Currently, very few lens systems are known to have chance occurrence of two background sources at different redshifts behind a galaxy-scale lens (e.g., Gavazzi et al., 2008; Tu et al., 2009). These kind of systems are interesting because one can constrain the slope of the mass density profile and cosmological parameters to a better accuracy (Gavazzi et al., 2008).
The SFR calculations of the main galaxy in 34244 suggest that it is a LIRG and the arc-like features could be sites of star formation. The orientation of ellipticity from our mass models are misaligned to the light distribution. Although such misalignments have been noted earlier, this might also imply that 34244 is less likely to be a lens system. Furthermore, an optical spectrum of the candidate suggests no significant detection of a higher redshift object which needs to be confirmed with a high resolution high SNR spectrum.
The current imaging and mass modelling are insufficient to comment on the likelihood of lensing in 40173. It is not clear if the arc-like feature corresponds to a background galaxy unless it is confirmed by spectroscopy.
The candidate 43242 shows two lines-of-sight to the same background galaxy wherein one of the images can be seen rather unobstructed and the others are seen through the dust in the foreground galaxy. Such lensed images can be used to estimate the amount of differential dust extinction from the foreground lens galaxy (Elíasdóttir et al., 2006). This system could also be used to constrain the disk mass in the lens galaxy which is a near edge-on spiral.
Although the model-predicted positions of lensed images in 46446 can be reproduced and they show similar colors, the morphology is complex and perhaps contaminated by dust in the lens galaxy. Spectroscopy and observations at other wavelengths of this system can shed some light on the spectral type of the candidate lens galaxy and confirm if it is a star-forming galaxy or not.
5.6. Comparison with other surveys
In this section, we briefly compare the efficiency of detection of lens systems in gems with that of the detection of lenses in other surveys. Table 2 summarizes the characteristics of the surveys like aegis, cosmos, CFHTLS-sl2s, SDSS-slacs along with the gems survey. Lens candidates in aegis, cosmos and gems were selected from photometric data from HST while the candidates in CFHTLS-sl2s were selected from photometric data from ground-based telescope. SDSS-slacs on the other hand, used spectral information of galaxies from the SDSS and selected candidates based on the presence of emission lines at redshifts higher than that of the main galaxy. Another sample of ten lens candidates was reported from the HST Medium Deep Survey (Ratnatunga et al., 1999). However, we do not include their results in our comparison because their sample is compiled from a set of 400 random fields observed with varying limiting magnitudes which complicates the selection function.
The number of lenses found in ground-based surveys is large thanks to their large areal coverage. However, the small area, high resolution, deep surveys carried out with the HST are able to find a large number of lens candidates per square degree. The exquisite resolution of these surveys allows them to find lens systems with small image separation. These lens systems probe the lower end of the halo mass function as opposed to the average lenses found in low resolution wide-imaging surveys from the ground. Such systems are often missed by ground-based surveys due to de-blending issues unless one uses spectral information, as was done by the slacs team. The depth of the HST surveys also allows detection of fainter lensed images around galaxies and also, lenses that lie on average at higher redshifts.
Among the surveys carried out with the HST, cosmos has the largest area, however it has imaging only in a single band. gems and aegis have a smaller areal coverage but have imaging information in two distinct bands. The multi-band information allows a more robust detection of lensed images with distinct colors with respect to the lens galaxy. In this respect, the gems and the aegis samples are expected to have a better completeness compared to cosmos. Also, the imaging for cosmos was carried out in the band which is not particularly suited for detecting lensed images given that they are usually fainter in redder bands. On the other hand, in terms of the fidelity of the samples, multi-band information is a double-edged sword. As can be seen from the system 34244 in this paper, shells of star formation in the candidate lens galaxy could also be confused to be lensed images thus affecting the purity of the sample.
The aegis survey has a very similar survey design in terms of area, depth and wavelengths of imaging compared to gems. Unless the surveys are severely affected by cosmic variance, we expect to roughly find similar number of lenses in these surveys. The visually identified candidate list from aegis was further matched to the spectroscopic information from the DEEP2 survey which reduced false positives in their case.
We note that a quantitative comparison between the completeness, efficiency and fidelity of lens samples in different surveys is difficult, primarily due to inherent differences in the design of the surveys and methods used to select the candidates. Large uncertainties in our current understanding of the faint end of the galaxy luminosity function and the redshift distribution of sources complicate the quantitative comparison further.
6. SUMMARY
The gems survey consists of HST imaging in and bands within the E-CDFS covering an area of 0.22 sq. deg. We searched for lens candidates from a sample of 25 000 galaxies in combo-17 (Borch et al., 2006). After applying our initial selection criteria, a total of 1054 candidates were selected for visual inspection and ranking. This resulted in ten lens candidates (that is, nine new candidates and one known lens system) from the gems survey, five of which are best cases and were further investigated.
The lensing masses of these five candidates were calculated under the assumptions of standard density profiles and a PDF for source redshifts. We estimated stellar masses within the Einstein radii found from the lens models. The stellar masses are consistently lower than or equal to the lensing masses, as expected. We compared the projected dark matter fractions from galaxy-scale lenses from surveys like slacs and cosmos to those in the gems lens candidates. Although uncertainty in the background source redshifts leads to weak constraints on the estimated parameters, we find that all of the candidates roughly follow the trend shown by lenses in slacs and cosmos. Also, these candidates follow the halo massstellar mass relation of Behroozi et al. (2010) within the uncertainties.
15422 is the only known and confirmed lens system in our sample. Our mass estimate is consistent with that from B04. However, the imaging in B04 indicates presence of a second lensed source in 15422 which deserves a detailed analysis. We note that the main galaxy of 34244 is detected in radio, and the TIR luminosity suggests that it is a LIRG and that the blue arc-like features might be star-forming shells. The model ellipticity of the main galaxy of 46446 is unusually high and inconsistent with the light distribution. Results from the analyses of the candidates presented here suggest that 43242 is very likely lens system, 46446 and 34244 are less likely to be lens systems whereas the nature of 40173 is not clear. Spectroscopic observations of the candidates are ultimately needed to definitively confirm or exclude lensing in these systems. Also, redshifts of the background galaxies will allow the determination of the mass of the lens more correctly. Our calculations imply that there should be about eight lens systems in gems. Given the large uncertainties in the assumptions made in these calculations, it is broadly consistent with the two good systems or ten plausible candidates in the sample.
Appendix A FIVE LOW PROBABILITY CANDIDATES
The five candidates with average ranks from 2 to 3 are presented here. Color images of these candidates are shown in Fig. 5. The candidates are indicated with their identification number from combo-17. Further information like their positions, tile numbers, and photometric redshifts of the candidates is given in Table 3. As before, the identification numbers and the photometric redshifts are from combo-17 catalog. All candidates are on the gems tiles which range from 1 to 63. The and band magnitudes in AB are from Caldwell et al. (2008).
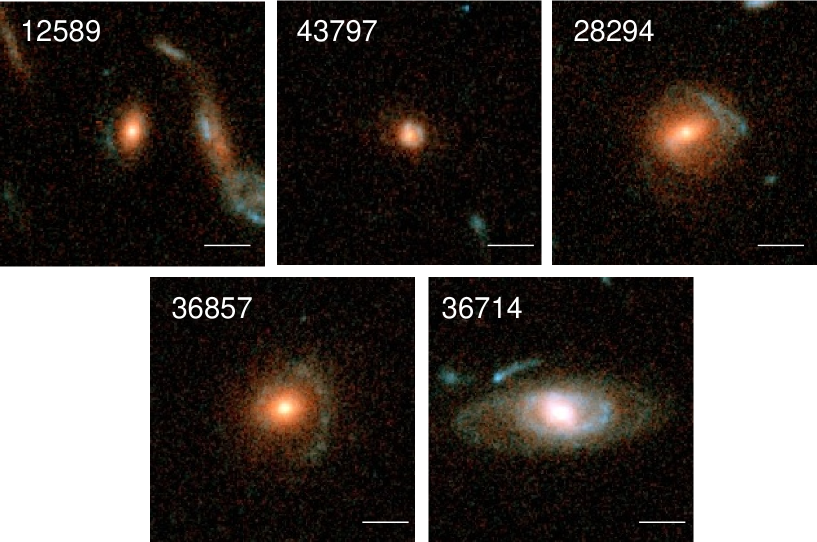
| ID | RA | Dec | Tile | |||
|---|---|---|---|---|---|---|
| 12589 | 03:31:24.89 | 27:58:07.0 | 17 | 23.36 | 21.68 | 0.79 |
| 43797 | 03:31:31.74 | 27:43:00.8 | 47 | 23.72 | 21.94 | 1.02 |
| 28294 | 03:31:50.54 | 27:50:28.4 | 33 | 22.50 | 20.32 | 0.66 |
| 36857 | 03:31:53.24 | 27:46:18.9 | 38 | 22.19 | 20.44 | 0.42 |
| 36714 | 03:32:59.78 | 27:46:26.4 | 37 | 20.92 | 19.73 | 0.44 |
References
- Auger et al. (2010) Auger, M. W., Treu, T., Bolton, A. S., Gavazzi, R., Koopmans, L. V. E., Marshall, P. J., Moustakas, L. A., & Burles, S. 2010, arXiv:1007.2880
- Behroozi et al. (2010) Behroozi, P. S., Conroy, C., & Wechsler, R. H. 2010, ArXiv e-prints
- Bell (2003) Bell, E. F. 2003, ApJ, 586, 794
- Bell et al. (2006) Bell, E. F. et al. 2006, ApJ, 640, 241
- Blakeslee et al. (2004) Blakeslee, J. P., et al. 2004, ApJ, 602, L9
- Bolton et al. (2006) Bolton, A. S., Burles, S., Koopmans, L. V. E., Treu, T., Gavazzi, R., Moustakas, L. A., Wayth, R., & Schlegel, D. J. 2008, ApJ, 682, 964
- Borch et al. (2006) Borch, A., et al. 2006, A&A, 453, 869
- Bruzual & Charlot (2003) Bruzual, G., & Charlot, S. 2003, MNRAS, 344, 1000
- Bryan & Norman (1998) Bryan, G. L., & Norman, M. L. 1998, ApJ, 495, 80
- Caldwell et al. (2008) Caldwell, J. A. R., et al. 2008, ApJS, 174, 136
- Casertano et al. (2000) Casertano, S., et al. 2000, AJ, 120, 2747
- Chabrier (2003) Chabrier, G. 2003, PASP, 115, 763
- Chary & Elbaz (2001) Chary, R., & Elbaz, D. 2001, ApJ, 556, 562
- Coles (2008) Coles, J. 2008, ApJ, 679, 17
- Drory et al. (2009) Drory, N., et al. 2009, ApJ, 707, 1595
- Dutton et al. (2010) Dutton, A. A., et al. 2010, arXiv:1012.5859
- Dutton et al. (2011) Dutton, A. A., et al. 2011, arXiv:1101.1622
- Elíasdóttir et al. (2006) Elíasdóttir, Á., Hjorth, J., Toft, S., Burud, I., & Paraficz, D. 2006, ApJS, 166, 443
- Falco et al. (1999) Falco, E. E., et al. 1999, ApJ, 523, 617
- Fassnacht et al. (2002) Fassnacht, C. D., Xanthopoulos, E., Koopmans, L. V. E., & Rusin, D. 2002, ApJ, 581, 823
- Faure et al. (2009) Faure, C., et al. 2009, ApJ, 695, 1233
- Faure et al. (2010) Faure, C., et al. 2010, arXiv:1009.1545
- Féron et al. (2009) Féron, C., Hjorth, J., McKean, J. P., & Samsing, J. 2009, ApJ, 696, 1319
- Gallazzi & Bell (2009) Gallazzi, A., & Bell, E. F. 2009, ApJS, 185, 253
- Gallazzi et al. (2005) Gallazzi, A., Charlot, S., Brinchmann, J., White, S. D. M., & Tremonti, C. A. 2005, MNRAS, 362, 41
- Gavazzi et al. (2008) Gavazzi, R., Treu, T., Koopmans, L. V. E., Bolton, A. S., Moustakas, L. A., Burles, S., & Marshall, P. J. 2008, ApJ, 677, 1046
- Keeton et al. (1997) Keeton, C. R., Kochanek, C. S., & Seljak, U. 1997, ApJ, 482, 604
- Keeton (2001) Keeton, C. R. 2001, astro-ph/0102340
- Kellermann et al. (2008) Kellermann, K. I., Fomalont, E. B., Mainieri, V., Padovani, P., Rosati, P., Shaver, P., Tozzi, P., & Miller, N. 2008, ApJS, 179, 71
- Kneib et al. (2003) Kneib, J.-P., et al. 2003, ApJ, 598, 804
- Kochanek et al. (2000) Kochanek, C. S., et al. 2000, ApJ, 543, 131
- Koopmans et al. (2006) Koopmans, L. V. E., Treu, T., Bolton, A. S., Burles, S., & Moustakas, L. A. 2006, ApJ, 649, 599
- Kormann et al. (1994) Kormann, R., Schneider, P., & Bartelmann, M. 1994, A&A, 284, 285
- Lehmer et al. (2005) Lehmer, B. D., et al. 2005, ApJS, 161, 21
- Mandelbaum et al. (2006) Mandelbaum, R., Seljak, U., Kauffmann, G., Hirata, C. M., & Brinkmann, J. 2006, MNRAS, 368, 715
- More et al. (2008) More, A., McKean, J. P., Muxlow, T. W. B., Porcas, R. W., Fassnacht, C. D., & Koopmans, L. V. E. 2008, MNRAS, 384, 1701
- More et al. (2010) More, S., van den Bosch, F. C., Cacciato, M., Skibba, R., Mo, H. J., & Yang, X. 2010, MNRAS, 1464
- Moustakas et al. (2006) Moustakas, L. A., Marshall, P., & AEGIS Collaboration 2006, Bulletin of the American Astronomical Society, 38, 926
- Moustakas et al. (2007) Moustakas, L. A., et al. 2007, ApJ, 660, L31
- Oguri et al. (2008) Oguri, M., et al. 2008, AJ, 135, 512
- Padmanabhan et al. (2004) Padmanabhan, N., et al. 2004, Nature, 9, 329
- Papovich et al. (2004) Papovich, C., et al. 2004, ApJS, 154, 70
- Peng et al. (2010) Peng, C. Y., Ho, L. C., Impey, C. D., & Rix, H. 2010, AJ, 139, 2097
- Poggianti et al. (2008) Poggianti, B. M., et al. 2008, ApJ, 684, 888
- Ratnatunga et al. (1999) Ratnatunga, K. U., Griffiths, R. E., & Ostrander, E. J. 1999, AJ, 117, 2010
- Rix et al. (2004) Rix, H.-W., et al. 2004, ApJS, 152, 163
- Salim et al. (2005) Salim, S., et al. 2005, ApJ, 619, L39
- Sand et al. (2002) Sand, D. J., Treu, T., & Ellis, R. S. 2002, ApJ, 574, L129
- Schulz et al. (2010) Schulz, A. E., Mandelbaum, R., & Padmanabhan, N. 2010, MNRAS, 408, 1463
- Silverman et al. (2010) Silverman, J. D., et al. 2010, arXiv:1009.1923
- Sygnet et al. (2010) Sygnet, J. F., Tu, H., Fort, B., & Gavazzi, R. 2010, A&A, 517, A25
- Treu et al. (2006) Treu, T., Koopmans, L. V., Bolton, A. S., Burles, S., & Moustakas, L. A. 2006, ApJ, 640, 662
- Tu et al. (2009) Tu, H., et al. 2009, A&A, 501, 475
- Vanzella et al. (2005) Vanzella, E., et al. 2005, A&A, 434, 53
- Wolf et al. (2004) Wolf, C., et al. 2004, A&A, 421, 913
- Yang et al. (2009) Yang, X., Mo, H. J., & van den Bosch, F. C. 2009, ApJ, 695, 900
- Yun et al. (2001) Yun, M. S., Reddy, N. A., & Condon, J. J. 2001, ApJ, 554, 803