The dynamics of the ionized and molecular ISM in powerful obscured quasars at z3.5††thanks: Based on observations carried out with the Very Large Telescope of ESO under Program ID 084.B-0161 and with the Plateau de Bure Interferometer of IRAM under Program ID T040.
Abstract
We present an analysis of the kinematics and excitation of the warm ionized gas in two obscured, powerful quasars at z3.5 from the SWIRE survey, SWIRE J022513.90-043419.9 and SWIRE J022550.67-042142, based on imaging spectroscopy on the VLT. Line ratios in both targets are consistent with luminous narrow-line regions of AGN. SWIRE J022550.67-042142 has very broad (FWHM2000 km s-1), spatially compact [OIII] line emission. SWIRE J022513.90-043419.9 is spatially resolved, has complex line profiles of H and [OIII], including broad wings with blueshifts of up to 1500 km s-1 relative to the narrow [OIII]5007 component, and widths of up to FWHM5000 km s-1. Estimating the systemic redshift from the narrow H line, as is standard for AGN host galaxies, implies that a significant fraction of the molecular gas is blueshifted relative to the systemic velocity. Thus the molecular gas could be participating in the outflow. Significant fractions of the ionized and molecular gas reach velocities greater than the escape velocity. We compare empirical and modeling constraints for different energy injection mechanisms, such as merging, star formation, and momentum-driven AGN winds. We argue that the radio source is the most likely culprit, in spite of the sources rather modest radio power of W Hz-1. Such a radio power is not uncommon for intense starburst galaxies at z2. We disucss these results in light of the co-evolution of AGN and their host galaxy.
keywords:
galaxies: formation, galaxies: high-redshift, quasars: emission lines, galaxies: kinematics and dynamics1 Introduction
Massive galaxies provide important constraints for our understanding of galaxy evolution. Observational and theoretical progress has led to a reasonably clear picture: Massive galaxies formed most of their stars in relatively short, intense bursts at high redshift, that were triggered by major, gas-rich mergers, and regulated by the energy injection from star formation and active galactic nuclei (e.g., Hopkins et al., 2006; Granato et al., 2006; Chakrabarti et al., 2008; Narayanan et al., 2008). This basic scenario is simple and elegant, and broadly consistent with ensemble studies of statistical samples of galaxies with intense star formation and powerful AGN. However, given the complexity of these processes, neither ensemble studies nor models alone can show conclusively if the different components of this model – merger, star formation and AGN activity – interact as postulated, and if this has the predicted impact on the interstellar medium. This is particularly true for the role of the energy injection by the AGN, for which we do not yet have a good physical understanding.
The most direct way of overcoming these limitations is through detailed observations of the gas kinematics and energetics in massive galaxies that are in key phases along this sequence. Ideally, such an approach must focus on an in situ study of massive galaxies during their major phase of growth – hence we must observe galaxies at high redshift.
Here we present an analysis of the warm ionized interstellar medium in two such galaxies, which is based on deep rest-frame optical integral-field spectroscopy obtained with the Very Large Telescope of ESO. SWIRE J022513.90-043419.9 and SWIRE J022550.67-042142.2 (SW022513 and SW022550 hereafter) are two obscured quasars at z3.5 (Polletta et al., 2008) and are the two most luminous 24m emitters at high redshift in the SWIRE survey (Lonsdale et al., 2003). We also include the results of a recent CO(4–3) analysis into our discussion, which has been presented by Polletta et al. (2011).
Polletta et al. (2008) presented a detailed analysis of the multi-wavelength photometric properties of these galaxies. Both galaxies host powerful starbursts () and luminous, obscured quasars with bolometric luminosities . Centimeter radio observations suggest the presence of moderately powerful radio sources of order W Hz-1 at 1.4 GHz in both targets, which appear too powerful to be entirely powered by star formation. The rest-UV spectrum of SW022550 shows bright, high-ionization emission lines, in particular NV1240, and weak UV continuum emission, which are the typical signatures of luminous, obscured quasars (Polletta et al., 2008). SW022513 is well detected in the X-ray (Pierre et al., 2007) with a luminosity, (2-10 keV) = erg s-1 in the hard X-ray that is 7 times brigher than the soft X-ray luminosity at 0.5-2 keV. It is thus a luminous absorbed X-ray source, e.g. a factor 3 brighter than the archetypal type-2 quasar CDFS-202 at z3.700 (Norman et al., 2002). SW022513 is most probably Compton-thick since its hard X-ray band luminosity is about only 1/50 of that measured around 24m.
Polletta et al. (2008) also present low-resolution ISAAC longslit spectroscopy in the near-infrared for both targets, and rest-frame UV spectroscopy for SW022550, showing that both sources are luminous line emitters. Recent IRAM Plateau de Bure millimeter interferometry of the CO(4–3) line shows that both galaxies are luminous CO line emitters with K km s-1 pc2 each, corresponding to M⊙ of cold molecular gas (Polletta et al., 2011). SW022550 has a broad, double-horned CO line profile, whereas the CO(4–3) line in SW022513 is also broad, FWHM1000 km s-1, and featureless, and is not very well fit with a Gaussian profile. Short gas consumption timescales suggest the galaxies may be near the end of their epoch of intense star formation, which is when galaxy evolution models postulate the impact of the AGN should be greatest (Springel et al., 2005; Narayanan et al., 2008).
Targeting particularly powerful quasars is important to isolate the impact of the AGN from that of the starburst (or potentially a merger). By contrasting our targets and galaxies that have equally intense star formation, but less powerful AGN we may hope to identify the unique signatures of the AGN. In addition we may set upper limits on what impact a luminous, obscured AGN may possibly have on the gas kinematics of its host galaxy. Both aspects are important to quantify the impact of AGN on the evolution of their host galaxies, as they may serve as benchmarks to develop analyses of less powerful, more frequent forms of feedback later on – and to infer whether these are indeed observationally feasible with present-day instruments.
Both galaxies have kpc-sized narrow-line regions (NLRs) that have strongly disturbed gas kinematics and forbidden line emission with widths of up to few 1000 km s-1. SW022513 has complex line profiles with broad, blueshifted components seen in [OIII]4959,5007 and H. These are qualitatively similar, but broader than the blue wing previously found by Alexander et al. (2010) in the submillimeter-selected quasar SMMJ1237+6203. Our analysis focuses on the gas kinematics, including the ionized and molecular gas studied by Polletta et al. (2011). We compare with the energy output of SW022513 and SW022550 through AGN and star formation and discuss what physical processes may contribute to driving such an outflow.
Throughout our analysis we adopt a flat cosmology where H0 = 70 km s-1 Mpc-1, =0.7, . With this cosmology, the luminosity distance to SW022513 at z=3.42 is 29.7 Gpc. 1 arcsec corresponds to a projected distance of 7.4 kpc. SW022550 is at a luminosity distance D34.4 Gpc, and 1 arcsec corresponds to a projected distance of 7.0 kpc.
2 Observations and data reduction
We observed both targets with the SINFONI integral-field spectrograph on the VLT. SINFONI is an image slicer which gives a field of view of 8″8″ with a pixel scale of 250 mas in the seeing-limited mode. We used the HK grating which covers the near-infrared H and K bands simultaneously from 1.45m to 2.45m at a spectral resolving power of R1500 (200 km s-1).
Both targets were observed in October and November 2009 under good and stable atmospheric conditions. The program was carried out in service mode under Program ID 384.B-0161. We obtained 3 hrs of on-source observing time per target, split into individual exposures of 300 seconds to allow for a good sky subtraction. Since we expected that both sources were smaller than the field of view we adopted a dither pattern where the sources fall onto different parts of the detector, but within the field of view at all times during observations. This allows to use one exposure to subtract the sky from the subsequent exposure, and makes taking dedicated sky frames unnessesary.
Data reduction relies on the standard IRAF tools to reduce longslit spectra (Tody, 1993), which we modified to meet the special requirements of integral-field spectroscopy. Our data reduction has been extensively described elsewhere (e.g., Nesvadba et al., 2006, 2007, 2008). The absolute flux scale was determined from standard star observations at the end of each one-hour long observing sequence, and we used the same stars to measure the seeing, which typically has a full-width-at-half-maximum of 0.5″ to 0.6″.
3 Results
3.1 Continuum emission
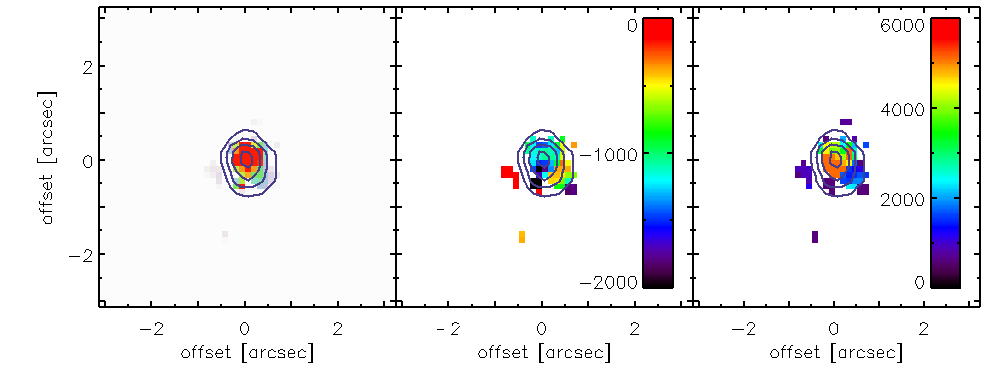
We detect continuum emission at the position expected from the IRAC 3.6m imaging in both galaxies. The spectral coverage of our HK data corresponds to 3300Å to 5500Å and to 2900Å to 5000Å in the rest-frame of SW022513 and SW022550, respectively. The continuum is relatively faint in both galaxies, but nonetheless detected at a significance of 12 per pixel in each spectral bin of SW022513 and SW022550. To obtain a more robust measurement, we collapsed both cubes at wavelengths without strong line emission, and detected the continuum at significances of 3 and up to 14 per spatial pixel in the collapsed image over the area of one PSF. We did not attempt to constrain the overall spectral shape of the continuum, however notice that it seems to have a blue slope in both targets broadly consistent with originating from the AGN. In this case, the continuum could be either produced by scattered or direct light from the AGN, or represent nebular continuum (e.g., Vernet et al., 2001), A more detailed discussion of the continuum emission is beyond the scope of this paper.
The continuum of SW022550 is compact, in SW022513 it is marginally extended along the North-South axis at significance (per spatial pixel, see Figure 2). We also detect very faint continuum emission associated with the faint line emission north from the nucleus in SW022513.
3.2 Emission-line gas
3.2.1 SW022513
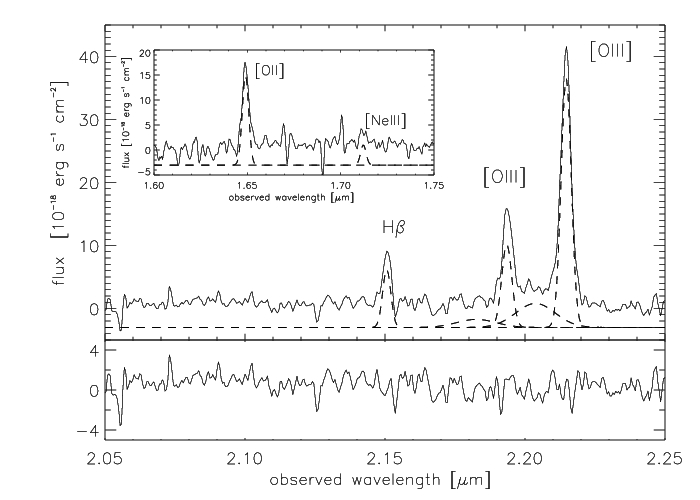
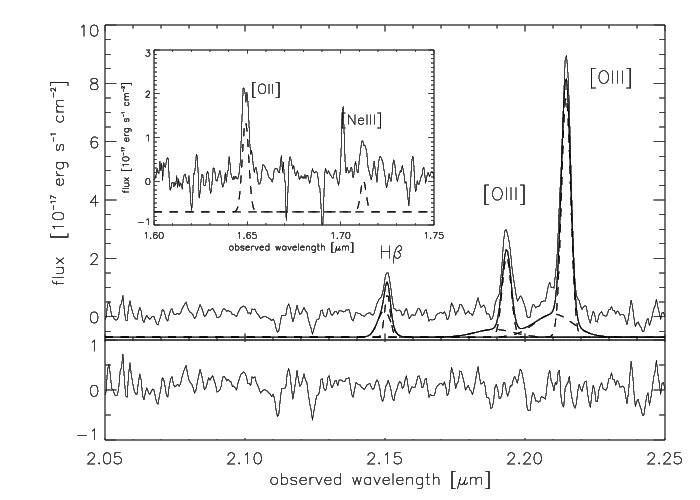
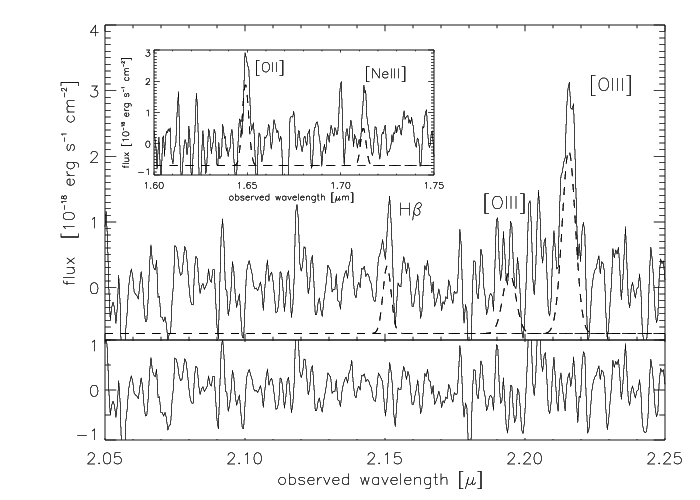
We show the integrated spectrum of SW022513 in Figure 1. Line properties are broadly consistent with those found by Polletta et al. (2008) with ISAAC longslit spectroscopy at 3 lower spectral resolution and lower signal-to-noise ratios. The lines are spectrally well resolved with typical widths of FWHM700 km s-1. Due to the broad width of the lines we did not resolve the individual components of the [OII]3726,3729 doublet.
SW022513 has luminous [OII]3727, [OIII]4959, 5007, and H line emission, with [OIII]5007/H. [NeV]3346,3426 fall outside the atmospheric windows, but we detect [NeIII]3869. We will argue in §4 that, for galaxies with the overall characteristics of SW022513, the [OIII]/H ratio and the detection of [NeIII] suggest that most of the warm ionized gas is photoionized by the AGN.
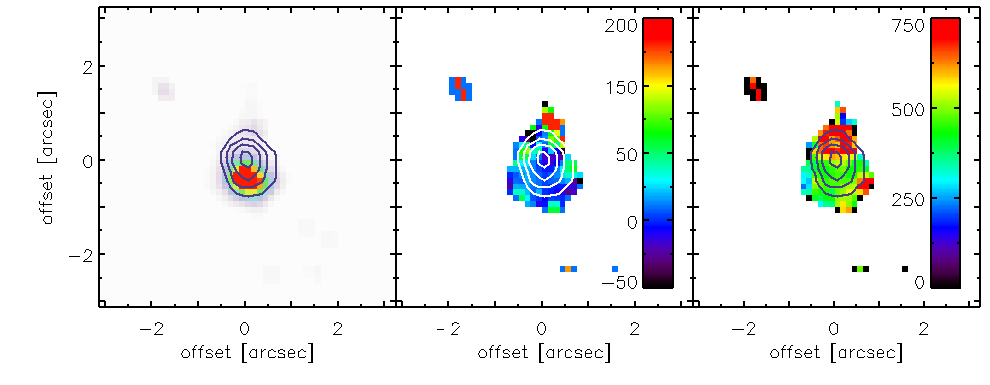
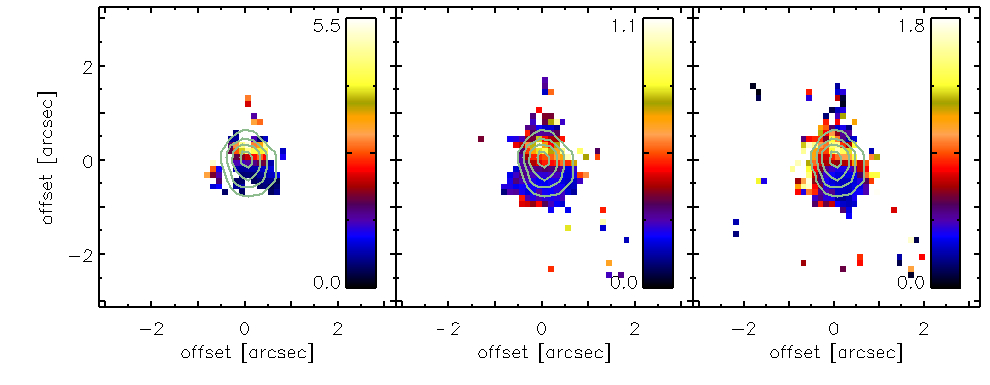
Line emission in SW022513 is extended over sizes of 1.6″2.5″ in right ascension and declination, respectively. The [OIII]5007 emission-line morphology is shown in the upper left panel of Figure 2. The [OIII]5007 line flux does not peak on the continuum peak, but is offset by 0.75″ to the South (corresponding to a projected distance of about 5 kpc).
Emission-line profiles are complex. We identify broad, blueshifted components in [OIII]4959,5007 and H. Unlike [NeIII]3869 and [OII]3726,3729, the H and [OIII]5007 lines are fairly bright and do not suffer blending of several components with uncertain relative line widths. They are therefore particularly suited to investigate their line profiles, and we will focus our discussion on those two lines. Line profile fits to [OIII]4959 yield similar results as [OIII]5007 within the measurement uncertainties.
The broadest [OIII]5007 component is found near the continuum peak, with FWHM5078 km s-1 and an offset of 1314 km s-1 relative to the narrow [OIII]5007 component measured in the same spectrum. At the same position we also detect a broad component in H, with FWHM1000 km s-1 and a blueshift of -183 km s-1 relative to the narrow component (which has FWHM=369 km s-1). All emission-line properties and their uncertainties are listed in Tables 3, 4, and 5.
We obtained maps of the relative velocities and line widths from fitting emission lines extracted from apertures of 3 pixels 3 pixels (0.4″0.4″) at all positions where [OIII]5007 line emission was detected at 3, adopting the prodedure outlined in Nesvadba et al. (2008). To account for the complex profile of the line, we performed fits with 2 Gaussian components for each line. We fitted the [OIII]4959,5007 doublet simultaneously, requiring that both lines have the same redshift and line width, and a ratio as expected between the two components of R(5007,4959)3. Overall this gives a line fit of 4 Gaussian components, where the narrow and broad components of [OIII]4959 and [OIII]5007 are required to have the same kinematics and a line ratio consistent with their Einstein coefficients.
The maps of relative velocities and line widths (full width at half maximum) of the narrow [OIII]5007 component are shown in the upper middle and right-hand panel of Figure 2, respectively. Velocities are relatively uniform across most of the source, with a sudden redshift jump of 200 km s-1 northward of the nucleus. The corresponding maps for the broad component are shown in the lower panel of Figure 2. We detect a very broad (FWHM5000 km s-1) component of [OIII]4959,5007 associated with the continuum peak, and a somewhat less extreme, but nonetheless broad component with FWHM1000 km s-1 associated with the peak of the [OIII]4959,5007 emission.
To map line ratios relative to [OIII]5007 we also fitted the spatially resolved emission of H and [OII]3726,3729, where we assumed a single Gaussian distribution for the [OII] doublet which is not spectrally resolved. In Figure 5 we show the maps of line ratios relative to the narrow [OIII]5007 component. The ratios of [OII]3727 and of H to [OIII]5007 are smallest near the [OIII]5007 emission-line peak, and have larger values near the brightest continuum emission.
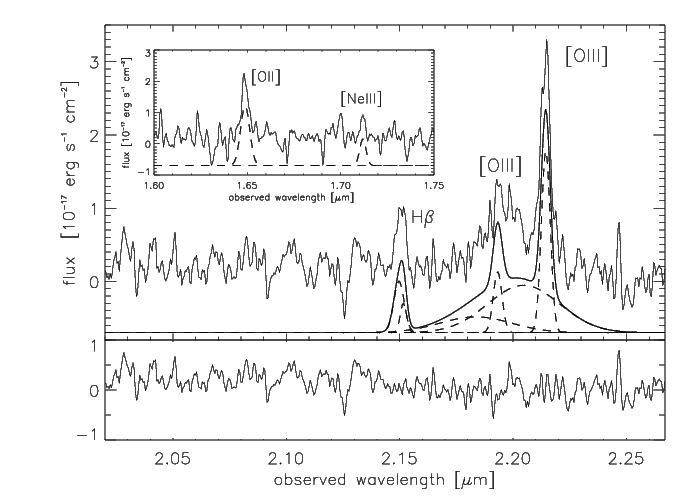
H and [OII]3726,3729 are too faint to map the kinematics of multiple components. Therefore we extracted integrated spectra associated with the peaks in [OIII]4959,5007 and continuum emission respectively, and from the faint, extended region to the North. These spectra are shown in Figure 3 and their properties are summarized in Tables 3, 4, and 5.
3.2.2 SW022550
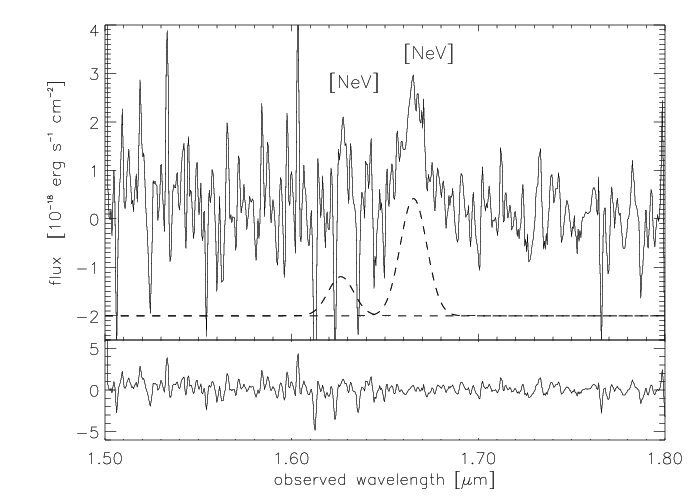
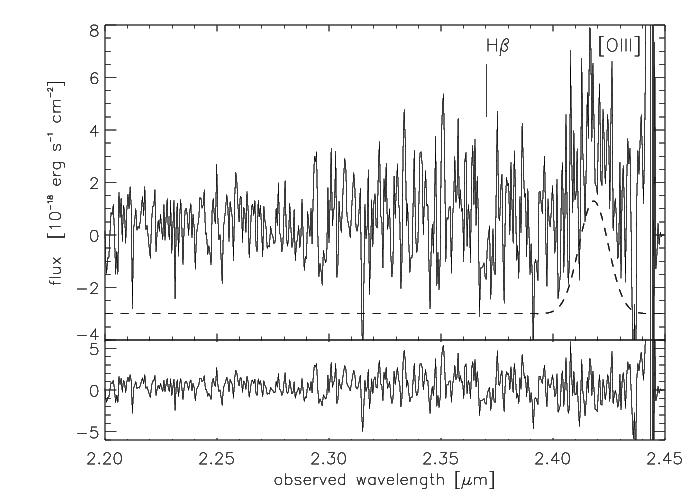
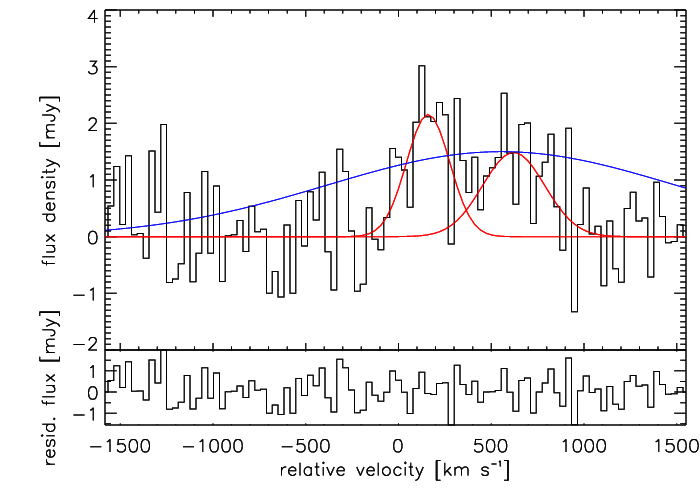
SW022550 is a luminous line emitter in the rest-frame UV as discussed by Polletta et al. (2008). Unfortunately at z3.867 it is at a somewhat unfavourable redshift for ground-based observations, where [OIII]5007 and [OII]3726,3729 fall outside the atmospheric windows. However, we did identify the [OIII]4959 line at =24182 Å, corresponding to a redshift , which is consistent with the redshifts measured in the rest-frame UV. The [OIII]4959 line is very broad, FWHM=2212 km s-1, not very different from the width of the rest-frame UV lines, which have line widths of up to few 1000 km s-1 (Polletta et al., 2008). The line flux is F(4959)8.2 erg s-1 cm-2. For F(4959)/F(5007) = 0.3 this corresponds to a [OIII]5007 flux of F(5007)2.5 erg s-1 cm-2. We did not detect H but place an upper limit of erg s-1 cm-2 at 3 significance, assuming it has a similar width as [OIII]4959.
We also detect the [NeV]3346,3426 doublet, although [NeV]3346 is heavily blended with night sky line residuals, making it difficult to measure anything but the line core. These lines give redundant kinematic and flux information and are well fit with a common redshift of z=3.861 and line width of FWHM2985 km s-1. For [NeV]3426 we measure a flux of erg s-1, and the core of [NeV]3346 is consistent with being 3 fainter as expected from the transition probabilities of the two lines. The rest-frame optical spectral properties of SW022550 are listed in Table 1.
All line emission appears compact and associated with the compact continuum emission.
4 Two quasars with giant narrow-line regions at z3.5
Our spectroscopic results suggest that the AGN is the dominant source of ionization in our targets. For SW022550 this follows directly from the detection of [NeV]3426. Line emission from this galaxy is not spatially resolved, the size of the seeing disk of 0.6″ implies an upper limit on the radius of the NLR of about 2.5 kpc, provided that we did not miss fainter, extended structures due to the somewhat unfavorable redshift of the source (§3.2).
At the somewhat lower redshift of SW022513, [NeV]3426 does not fall into the atmospheric windows. We do however, observe [NeIII]3869 and find a relatively high [OIII]/H ratio of 6. A priori, both features could be produced either by the AGN or by intense star formation in galaxies with high ionization parameters and low metalicities, leading to hot electron temperatures, like, e.g., in high-redshift HII or Lyman-break galaxies (e.g., Pettini et al., 2001; Fosbury et al., 2003; Nesvadba et al., 2006, 2007, 2008). Villar-Martín et al. (2008) find that star formation may photoionize parts of the gas in 3/50 type-2 quasars drawn from the SDSS; however, these are much less powerful than the targets we observe, and have less luminous optical lines, e.g., erg s-1 compared to few erg s-1 for SW022513 (Table 2). We are not aware of any star-forming galaxy without AGN and with erg s-1.
In addition, the bright 24m and millimeter continuum emission of SW022513 and SW022550 shows these are dusty galaxies. Dust and metal lines are very efficient coolants, so that for a given ionizing spectrum (e.g., due to intense star formation), we may expect lower electron temperatures than in HII galaxies and LBGs, which would lead to lower [NeIII] fluxes and lower [OIII]/H ratios. The FIR/millimeter properties of SW022513 and SW022550 are indistinguishable from those of submillimeter-selected starburst galaxies at z2, which have supersolar metallicities (Tecza et al., 2004; Swinbank et al., 2004; Nesvadba et al., 2007) and fall near the local mass-metallicity relationship of Tremonti et al. (2004). In the absence of an AGN, these galaxies have [OIII]/H (Takata et al., 2006; Nesvadba et al., 2007), and [NeIII] is generally not observed. For SW022550 and SW022513, the mass-metallicity relationship would imply a gas-phase oxygen abundance of , supersolar even when accounting for the (large) scatter in the relationship (and supersolar by 0.4 dex when taken at face value). Polletta et al. (2008) came to a similar conclusion from the rest-frame UV line ratios of SW022550. Roughly solar metallicities have also been found by Humphrey et al. (2008) for dusty, massive radio galaxies at high redshift.
The line emission in SW022513 is well resolved spatially. This implies that the QSO narrow-line region (NLR) extends to radii of at least 1.25″ (corresponding to 10 kpc). Most notably, the peak of the narrow [OIII]4959,5007 line is offset by 0.75″ (5 kpc) towards South from the continuum peak and the peak of broad [OIII]4959,5007 emission. A spatial offset between broad and narrow line emission has previously been reported for the submillimeter-selected quasar SMMJ12376203 at z=2.1 (Alexander et al., 2010). Without additional constraints, this offset could be interpreted as a signature of an outflow of turbulent gas, at several 10s of kpc from the galaxy traced by the narrow-line emitting gas.
Our data on SW022513 allow us to perform a more complete analysis which suggests a different scenario. First, the broad [OIII] line emission is spatially coincident with the continuum peak, implying that the emission arises in the nuclear region of the galaxy and thus near the AGN. We also find that near the peak of narrow [OIII] emission, the [OII]/[OIII] and the H/[OIII] line ratios are smaller than near the continuum peak, and hence near the peak of broad [OIII] and the likely location of the AGN (Figure 5). This implies that the narrow line region is more highly ionized than the emission immediately surrounding the AGN. This increase can be caused by a harder radiation field for a constant ionization parameter (ratio of radiation field intensity to gas density), an increasing ionization parameter, or a decrease in gas-phase metallicity as we move from the continuum to the narrow-line peak. It could be a combination of all three (see Humphrey et al., 2008, for a more detailed analysis in related environments).
Given the bright FIR luminosity of SW022513, the extinction in the circum-nuclear region is likely to be high. However, large-scale extinction of the emission line gas cannot solely determine the variation in [OIII]/[OII] line ratio. The same trend is also found in [OIII]/H and given their similar wavelengths (including the [OIII] line at 4959Å) the influence of extinction must be relatively small. In relation to the nebula itself, the effect of dust on the ionization of the gas is complex. Since dust provides an additional source of cooling and competes directly with the gas for ionizing photons due to its large cross section over a wide range of wavelengths but also depletes metals from the gas (some of which provide important cooling lines like Oxygen and Carbon), a dusty gas will have a different ionization structure depending on the gas-to-dust ratio and amount of metal depletion. So it is not entirely clear what its impact will be, but it could well increase the ionization of the gas.
All these scenarios would produce the situation we observe and suggest that the characteristics of the extended ionized gas in SW022513 are consistent with a narrow-line region surrounding a luminous obscured quasar and extending over a radius of 10 kpc. Radii of few 10s of kpc are expected for the narrow-line regions of the most powerful quasars (Netzer et al., 2004) and consistent with empirical constraints for optically selected quasars (Bennert et al., 2002) and also type-2 quasars (Greene et al., 2011). In addition, the asymmetry of the narrow [OIII] line morphology relative to the nucleus supports this scenario as narrow-line regions are often highly elongated and asymmetric. Given the bright FIR luminosity of our targets of (Polletta et al., 2008), we expect these are highly dust-enshrouded, and that most of the rest-frame UV/optical light is obscured on kpc scales, with ionizing and non-ionizing radiation escaping to larger distances only along relatively few lines of sight that are comparably free of dust. This is analogous to the situation observed for local Seyfert 2s in their extended narrow-line regions (e.g., Veilleux et al., 2003, see Lehnert et al. 2009 for an example at z2.).
This does not imply that the quasar also dominates the gas kinematics. Quasar illumination cones without strong mechanical effect are known at low redshift (Veilleux et al., 2003) as well as at z2 (Lehnert et al., 2009). Note that this applies to radio-quiet quasars. Radio-loud AGN, including radio galaxies, often have much more extended emission-line regions with very energetic emission-line kinematics (e.g. McCarthy et al., 1996; Villar-Martín et al., 1999; Baum & McCarthy, 2000; Villar-Martín et al., 2003; Nesvadba et al., 2006, 2008).
4.1 Ionized gas mass
The molecular gas strongly outweights the ionized gas in strongly star-forming mergers at z2 (Nesvadba et al., 2007), but not in powerful radio galaxies at similar redshifts (Nesvadba et al., 2008, Nesvadba et al., in prep.) where much of the interstellar medium appears photoionized by the AGN (e.g., Villar-Martin et al., 1997; Villar-Martín et al., 2003; Humphrey et al., 2008) and accelerated by the radio source (e.g., Nesvadba et al., 2008). We will now use the H emission-line flux measured in SW022513 to illustrate that the ionized gas mass in this obscured quasar could plausibly be as large as the molecular gas mass.
Similar to Nesvadba et al. (2006, 2008) we will assume case B recombination to estimate the ionized gas mass from the luminosity of the Balmer lines, setting
| (1) |
where is the H luminosity in units of erg s-1, and is the electron density in units of 100 cm-3. This relationship is equivalent to Equation (1) of Nesvadba et al. (2006) assuming a Balmer decrement H/H2.9, and follows directly from Osterbrock (1989).
This estimate has two major uncertainties. First, the [OII]3726,3729 line doublet is blended, so we have no direct estimate of the electron density. Second, from H alone we cannot measure the extinction. We can loosely constrain these values with rather generic arguments. First, the presence of luminous forbidden emission lines like the [OII]3726,3729 doublet suggests that electron densities are below the critical densities for collisional deexcitation, a few 1000 cm-3, and we will in the following adopt a fiducial value of 1000 cm-3 (radio galaxies and submillimeter galaxies at similar redshifts have electron densities of few 100 cm-3 Nesvadba et al., 2006, 2007, 2008). Second, we will assume an average extinction of about mag, which is the average in submillimeter-selected galaxies without strong AGN (Smail et al., 2004) that are the closest analogs to our galaxies in the far-infrared/submillimeter (and consistent with a nuclear A4.6 mag derived by Polletta et al., 2008). Nesvadba et al. (2008) find A14 mag from the H/H line ratios in the extended ionized gas of z2 radio galaxies. For SW022513, this gives an H luminosity of erg s-1, a factor higher than the observed value (Table 2).
With these two assumptions, we find an ionized gas mass of M⊙ (compared to M⊙ if we strictly use the observed H flux). This can obviously only be an order-of mass estimate, but illustrates that the mass of ionized gas in SW022513 is likely between 10% and 100% of the molecular gas mass. This is in the same range as found for radio galaxies, and a factor 1001000 higher than for strongly star-forming galaxies. For SW022550 we only have an upper limit on the H flux, which is not very constraining. The above considerations suggest that the ionized gas mass estimate and derived quantities can only be accurate at an order-of-magnitude level.
4.2 What is the systemic redshift?
The lack of robust measurements of the systemic redshift is a major uncertainty in all studies of the gas dynamics in galaxies at high redshift, and yet, is indispensible to interpret the emission-line kinematics. At distances where direct measurements of stellar absorption line kinematics in AGN hosts are possible, observations suggest that the narrow emission-line components show only moderate offsets from the systemic velocity. This includes Seyfert galaxies (Nelson & Whittle, 1996) as well as powerful, type-2 quasars in the SDSS (Greene & Ho, 2005a), and also galaxies with very broad blueshifted [OIII]4959,5007 components (Wong et al., 2006).
The narrow [OIII]5007 component in SW022513 has a relatively small velocity gradient, 200 km s-1 (Figure 2), and lines of different species of ionized gas have very similar velocities. This is broadly consistent with what would be expected for rotation or merger-driven kinematics of galaxies with stellar masses of and is in the velocity range of submillimeter galaxies at z2 (Swinbank et al., 2006; Nesvadba et al., 2007) as well as nearby ULIRGs (Colina et al., 2005). We will thus in the following assume that the narrow optical emission lines of SW022513 trace the systemic redshift within km s-1. Specifically we will use the redshift of the narrow H component near the continuum peak (which we identify as the nucleus, §4), z3.4247 (Table 3) to approximate the systemic redshift. H is measured at good signal-to-noise (SNR8.5) and is more representative for the overall gas kinematics than [OIII]4959,5007, which are very sensitive to ionization effects.
4.3 Blue wings as signatures of outflows
If the narrow lines of AGN host galaxies are approximate tracers of the systemic velocity, then the broad, blueshifted components often found in [OIII]4959,5007 as well as other lines, most likely trace gas that is in outflow (e.g., Heckman et al., 1981; Greene & Ho, 2005b; Morganti et al., 2005; Nesvadba et al., 2007; Komossa et al., 2008; Holt et al., 2008; Nesvadba et al., 2008; Greene et al., 2009; Spoon & Holt, 2009; Spoon et al., 2009; Nesvadba et al., 2010). Scalings between the [OIII]5007 width and AGN power (either radio power; Heckman et al., 1981, or bolometric luminosity; Greene & Ho 2005b) broadly support this picture. Following these previous analyses, we therefore consider the broad wings of [OIII] and other lines in SW022513 and the broad [OIII] lines in SW022550 as signatures of outflows.
In SW022513 the broadest line widths of FWHM5000 km s-1 seen in [OIII] are broader than the other lines in the same aperture, and broader than all other lines including [OIII] in all other apertures. The [OIII] emissivity is very sensitive to electron temperature and excitation conditions, but not the total gas mass, so this component is unlikely to trace large amounts of gas. The most strongly blueshifted gas seen in the more representative H line, blueshifted by of order 1000 km s-1 relative to systemic, likely gives a more robust estimate of the overall gas kinematics (see also §4.4). We ran a Monte-Carlo simulation to infer for what H/[OIII]5007 line ratio we could have detected a broad H component with FWHM=5000 km s-1 and at the same redshift as the broad [OIII]4959,5007 lines (see § 3.1 of Nesvadba et al., 2011, for more details). For 1000 throws we found that H would have been detected at 3 for [OIII]5007/ H, compared to [OIII]5007/H=3.8 for the narrow component in the same spectrum. If the assumptions of §4.1 hold, then this would imply a upper limit to the mass of high-velocity ionized gas (with FWHM5000 km s-1) of (neglecting extinction), or M⊙ (for A2 mag; see §4.1), roughly 10% of the mass found at more moderate velocities. Interestingly, the higher [OIII]H ratio suggests this gas is more highly ionized than the narrow-line emitting gas.
4.4 Comparison with molecular gas
Polletta et al. (2011) recently discussed integrated CO(4–3) emission-line spectroscopy of SW022513 and SW022550 obtained with the IRAM Plateau de Bure Inteferometer at a spatial resolution of 4″. Both galaxies have luminous millimeter CO(4–3) line emission that corresponds to M⊙ of molecular gas, assuming a factor of 0.8 M⊙ K km s-1 pc2 to convert CO luminosity to a molecular gas mass. SW022550 has a double peaked profile with two components separated by 440 km s-1 in velocity. SW022513 has a single, very broad component with FWHM1000 km s-1, which is not very well fitted with a single Gaussian.
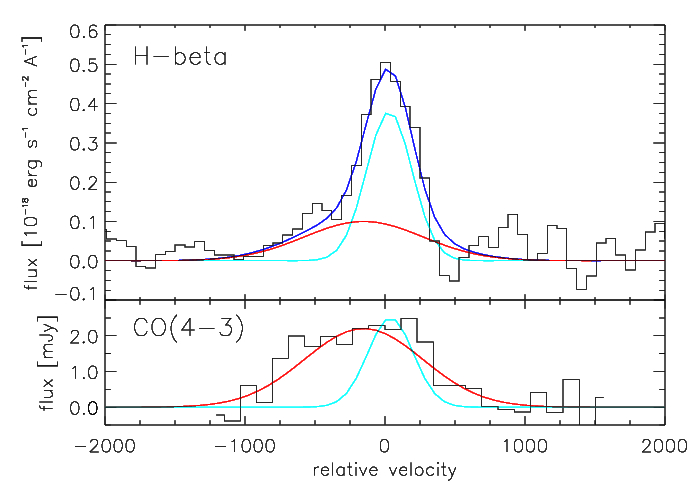
In Figure 6 we compare the CO(4–3) and [OIII]4959 line profiles of SW022550. The redshift of [OIII], z3.8760.001 falls between that of the two CO peaks. In SW022513, the CO(4–3) line profile shows an excellent match with the H profile extracted from the nuclear aperture centered on the continuum peak (Figure 7). This includes in particular the broad, blueshifted wings with velocities of up to -1000 km s-1 relative to the narrow H component. As we argued in §4.2, the narrow H component most likely approximates the systemic velocity to about 100 km s-1.
Comparison with telluric night-sky lines suggests that the absolute wavelength scale in our SINFONI data is accurate to about 20 km s-1. In the millimeter, wavelengths are measured relative to a local oscillator, therefore uncertainties in wavelength calibration are much smaller and can be neglected.
Formally, our Gaussian fits imply a velocity offset of -18367 km s-1 for an assumed Gaussian line core of the blueshifted H component, and of -18147 km s-1 for the Gaussian core of the CO(4-3) line. Molecular line emission is therefore found with blueshifts of up to 900 to 1000 km s-1 relative to the narrow H component, which, as argued in §4.2, is our most robust measure of the systemic redshift. Regardless of the detailed match between molecular and ionized gas, and neglecting possible projection effects, this is likely to be more than the escape velocity (§5.3).
5 The wind in a z3.5 quasar
Our targets have all the hallmarks of being in a short, decisive, and very complex stage of their evolution, where star formation, AGN, and gravitational interactions are likely to release an energy of erg, the equivalent of the binding energy of the host galaxy and its dark-matter halo. At their current luminosities, the AGN in SW022513 and SW022550 may release such energies in a few yrs, which corresponds to the lifetimes over which AGN may maintain bolometric luminosities erg s-1 (Hopkins et al., 2005). Similarly, the canonical energy release of erg per supernova explosion corresponds to a total energy of about erg released in the formation of M⊙ of stars, and observations have shown that the hydrostatic pressure of intense starbursts may balance gravity in z2 galaxies very similar to our targets (Nesvadba et al., 2007). Major mergers naturally release the equivalent of the binding energy of the merger remnant during the interaction. Hence, each of these mechanisms could have a strong influence on the kinematics and thermal state of the gas in our targets. What mechanism is dominating the gas dynamics in SW022550 and SW022513?
Important to address this question is not only the total energy injection, but also the timescales over which this energy is released, and the efficiency with which the energy output is turned into an input of (thermal or mechanical) energy into the ambient gas. Narayanan et al. (2008) find in SPH simulations of a gas-rich, major merger associated with intense star formation and AGN activity, that the AGN affects the gas more drastically than star formation and gravitational collapse because of the shorter energy injection time. Star formation and gravitational interaction release their energy in few yrs and up to yrs, respectively, much longer than the yrs lifetime of the AGN.
Observations lead to a similar conclusion. The spectral signatures of winds in submillimeter galaxies without strong AGN component appear much more subtle, with smaller blueshifts, and a smaller mass of entrained material (Nesvadba et al., 2007). Overall, these galaxies have velocity gradients and line widths of up to a few 100 km s-1, and more regular line profiles (e.g., Swinbank et al., 2005; Swinbank et al., 2006; Takata et al., 2006) in spite of stellar masses and star-formation rates very similar to our targets. Low-redshift ULIRGs including very advanced mergers have velocity gradients and line widths in a similar range (Colina et al., 2005), and are much smaller than 1000 km s-1 at any stage of merging.
SW022513 and SW022550 both show signatures that the AGN does affect the warm ionized ISM, evidenced through the broad, blue components in SW022513 and the very broad FWHM of [OIII]4959 in SW022550 (FWHM2000 km s-1). However, FWHM1000 km s-1 are only found around the nucleus in both cases, and , since we cannot constrain extinction very well, it is not clear if the warm ionized gas represents a major fraction of the ISM (§4.1). The CO profiles of both galaxies, which trace about M⊙ in molecular gas in each source, are very different in SW022513 and SW022550 (Polletta et al., 2011). In SW022550 the CO profile resembles the fairly common double-peaked profiles found, e.g, in submillimeter galaxies, where they are commonly interpreted as signatures of mergers or rotating disks (and where even disks may be signatures of (advanced) mergers; Downes & Solomon, 1998), in agreement with the merger models of Narayanan et al. (2008). In either case, the barycenter falls roughly inbetween the two CO peaks. This could suggest that the AGN affects only a small part of the multiphase ISM in SW022550, traced by the broad [OIII] line.
SW022513 is however different. The CO line profile is irregular and neither a clear single nor double-peaked Gaussian. The line extends to large relative velocities of up to 1000 km s-1 from systemic (§4.4), similar to the ionized gas near the AGN (Fig. 7). Outflows driven by the AGN are the most common interpretation of blue, broad wings of ionized gas (§4.3), which may suggest that parts of the molecular gas in SW022513 may be tracing outflowing gas as well. Winds are inherently multi-phase phenomena, where the warm ionized gas seen through optical line emission is being entrained by a hot, tenuous medium. It may therefore a priori not be entirely surprising to find an associated phase of molecular gas. However, this does raise fundamental questions of how molecular gas, which is 1-2 orders of magnitude denser ( cm-3) than ionized gas ( cm-3) is accelerated to high velocities. This could be alleviated if much of the gas is diffuse and distributed across the galaxy, perhaps through tidal effects or a starburst-driven wind (Narayanan et al., 2008).
It is also possible that the molecular gas is forming in situ in the outflow, as suggested by recent studies of the detailed mass and energy exchange in turbulent, multiphase gas in nearby extragalactic environments with galaxy-wide shocks, including radio galaxies (Guillard et al., 2009; Nesvadba et al., 2010; Ogle et al., 2010, see also Krause & Alexander, 2007 ). In these scenarios, the ionized line emission may arise from the turbulent mixing interfaces associated with the same clouds, which would explain why ionized and molecular gas have similar velocities. Papadopoulos et al. (2010, 2008) recently found bright CO(6-5) and CO(3-2) line emission in the nearby radio galaxy 3C293, which is a posterchild of a jet-driven outflow (Morganti et al., 2005; Emonts et al., 2005). CO line ratios in 3C293 suggest that most of the molecular gas is dense, turbulent, and gravitationally unbound, as expected in a multiphase scenario.
Possible kinematic signatures of outflows from star-forming AGN host galaxies traced through CO line emission have previously been reported in a few nearby cases (Appleton et al., 2002; Sakamoto et al., 2006; Alatalo et al., 2010; Iono et al., 2007; Feruglio et al., 2010; Irwin et al., 2010). These galaxies have AGN power and star-formation rates that are lower by 1-2 orders of magnitude than in SW022513. Outflow velocities are typically a few 100 km s-1, and entrainment rates can be up to few 100 M⊙ yr-1. The CO profiles found by Sakamoto et al. (2006); Alatalo et al. (2010) are well matched by HI absorption-line profiles tracing neutral outflows, and providing robust evidence for the outflow interpretation. However, typically these winds include only a small fraction of the CO luminosity, unlike in SW022513 where most of the CO emission appears to be blueshifted. This may partially be due to the higher-excitation gas probed in the J4–3 transition, or it may imply that more gas is being entrained compared to low-redshift galaxies. This is not implausible, given the much greater AGN power in SW022513 compared to nearby Seyfert galaxies, and the large molecular gas mass. We will in the following quantify the necessary and available amounts of kinetic energy in SW022513 to investigate whether the AGN may plausibly drive the gas to the velocities observed.
5.1 Kinetic energy of the gas
In Figure 7 we compared the line profiles of H and CO, and argued that, by analogy with a large number of previous AGN studies, the systemic velocity is typically well approximated by the narrow component of optical emission lines, whereas the outflowing component is in the blue wing. To estimate the kinetic energy in the outflowing gas, we therefore decompose the CO and H line profiles into a ’systemic’ and a blueshifted component, finding that about 40% of the total CO(4-3) emission-line luminosity is in the outflowing component (and about 30% of H). Assuming that the CO-to-H2 conversion factor and the CO excitation are independent of velocity, this suggests that 40% of the molecular gas is in the blueshifted component.
Based on these assumptions, we estimate the kinetic energy directly from the line profile, by setting
| (2) |
where is the gas mass in each velocity bin (relative to the systemic velocity, §4.2), and including only the flux from the blueshifted component. This corresponds to a kinetic energy of about erg. Adding the ionized gas mass would add another erg, depending on extinction (see §4.1). Obviously, these estimates have large systematic uncertainties related to the molecular gas mass estimate, excitation conditions, and velocity estimates including projection effects. We therefore consider this estimate accurate to about an order of magnitude.
5.2 Is the AGN capable of driving the outflow?
At the beginning of the section we have argued that a starburst-driven wind and an interaction are unlikely to accelerate significant amounts of gas to velocities of 1000 km s-1. We will now investigate for two popular AGN feedback mechanisms, if they may plausibly explain the observed gas kinematics.
5.2.1 Radiation pressure from AGN and starburst
Radiation pressure is often invoked to explain how AGN may expel significant amounts of gas from their host galaxies (e.g., King, 2003; Murray et al., 2005). Murray et al. (2005) discussed the outflow velocities that can be produced by radiation pressure from AGN and intense starbursts, finding that (their Equation 17)
| (3) |
where is the stellar velocity dispersion of the host galaxy, and is the quasar luminosity. is the launch radius of the outflow, and the radius at which the velocity of the wind is measured. is a critical luminosity that depends on the stellar velocity dispersion , the speed of light, , gravitational constant, , and the gas fraction, . For , radiation pressure may launch a wind. These equations are appropriate for the limiting case of an optically thick wind, in which case the interaction is most efficient.
Polletta et al. (2008) estimated the stellar mass and luminosity of the starburst and AGN from the dust and stellar emission of SW022513 with an exquisite set of multi-waveband photometry. They find a stellar mass of M M⊙, and bolometric luminosities of and erg s-1 for the starburst and AGN, respectively. For pressure-supported galaxies with approximately isothermal mass profile, this mass range corresponds to stellar velocity dispersions of km s-1. This can be found from setting M, where is the stellar velocity dispersion, the effective radius, the stellar mass, and G the gravitational constant. For our calculations we adopted = 2-3 kpc, and (Bender et al., 1992). To give a lower limit on the gas fraction, we use the molecular gas mass estimate of Polletta et al. (2011), M⊙, which gives a gas fraction of order f for a stellar mass of M M⊙ (Polletta et al., 2008).
Following Murray et al. (2005), to launch a wind in a galaxy with M M⊙ with =300-350 km s-1, and M M⊙ would require erg s-1. This is the most optimistic case consistent with our observational constraints, and would require a bolometric luminosity that is about 2.53 greater than observed. To accelerate a wind to a terminal velocity of km s-1 (as suggested by the broad blueshifted components in SW022513) would then require a bolometric luminosity of at least erg s-1 for a galaxy with 300350 km s-1, a factor 4-5 larger than what is measured. Thus, the luminosity of SW022513 is at least a factor 4 lower than required, if we consistently use the most optimistic estimates implied by our observations. It can be up to factors 10 lower for other plausible choices of parameters.
For these estimates we assume a launch radius of the wind, , of a few 100 pc (the sizes of the circumnuclear molecular disks found in low-redshift ULIRGs Downes & Solomon, 1998, and the lowest value in the AGN feedback models of Ciotti et al. 2009, 2010), and an outflow radius, , of 5 kpc, which roughly corresponds to the radius of the narrow-line region in SW022513. A larger launch radius (perhaps more plausible given the large gas masses) or a larger size of the outflow region, enhances the required energy. This suggests that radiation pressure may only drive the outflow if all parameters take values that are strictly at their lower limits and if we underestimate the luminosity by at least a factor 4. Otherwise, driving an outflow like in SW022513 through radiation pressure as proposed by Murray et al. (2005) would require an AGN and starburst with at least factors of a few higher bolometric luminosity than in SW022513, although this is one of the most luminous obscured high-z AGN in the SWIRE survey (Polletta et al., 2008).
5.2.2 Radio source
Examples of outflows in the literature associated with radio-loud AGN are numerous, and include not only powerful radio sources (e.g., Morganti et al., 2005; Holt et al., 2008; Nesvadba et al., 2008; Spoon & Holt, 2009; Spoon et al., 2009; Nesvadba et al., 2010), but also Seyfert galaxies with low radio power (Capetti et al., 1999; Ulvestad et al., 1999; Reynolds et al., 2009; Barbosa et al., 2009). Weak radio sources are common in Seyfert galaxies (Gallimore et al., 2006) but not always easily identified, and typically spatially asscociated with non-circular gas motions. The same is found for radio-quiet quasars (e.g., Leipski & Bennert, 2006; Leipski et al., 2006). Note that “radio-quiet” does not mean “radio-silent”, but that the radio power is less than 10 greater than the optical luminosity of a quasar, irrespective of whether the optical continuum is dominated by the direct or scattered AGN light, nebular continuum emission, or the obscured or unobscured stellar continuum of the host galaxy.
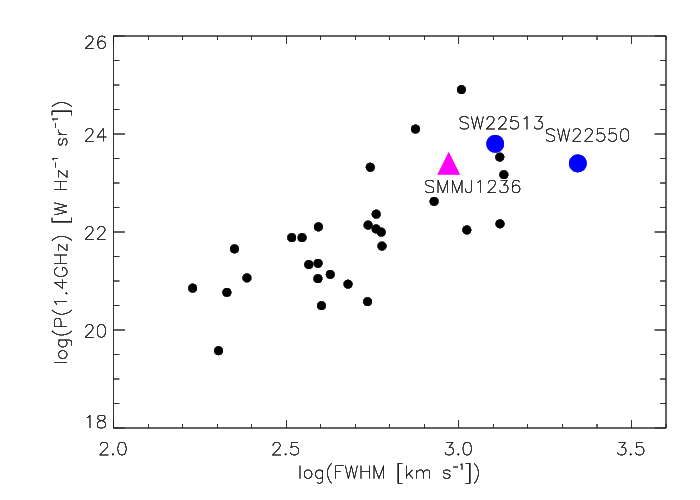
Even relatively low-power radio sources can accelerate gas to high velocities of 1000 km s-1 (e.g. Capetti et al., 1999) and produce equally large line widths (e.g., Capetti et al., 1999; Reynolds et al., 2009). Heckman et al. (1981) found that radio power correlates with the FWHM of the [OIII]5007 line. Measuring the [OIII]5007 FWHM in SW022513 from the integrated spectrum, we find that it falls well within the scatter of the Heckman et al. relationship (Figure 8). The same is true for SW022550 and SMMJ1237+6203 (with the FWHM of Alexander et al., 2010)
Weak radio sources where the internal pressure does not greatly exceed the ambient pressure, may deposit most of their energy in the ambient medium (Gallimore et al., 2006) and may thus be more efficient in inflating bubbles than more powerful radio sources, where only a few percent of the kinetic jet energy is being deposited in the ambient medium (e.g., Nesvadba et al., 2008). Polletta et al. (2008) estimated the radio power of SW022513 (and SW022550) to be of order W Hz-1. This roughly corresponds to the FRI/FRII divide at low redshift, and appears as moderately strong only if compared to the very powerful radio-loud quasars and radio galaxies at high redshift. At more moderate redshifts, radio sources with fairly similar power can trigger significant outflows (e.g. Morganti et al., 2005; Spoon & Holt, 2009) and have a profound impact on the molecular gas in their hosts (e.g., Papadopoulos et al., 2010; Nesvadba et al., 2010; Ogle et al., 2010; Alatalo et al., 2010).
The interaction efficiency of a radio source with the ambient gas depends critically on the gas density (e.g., Capetti et al., 1999), which in high-redshift galaxies is likely higher than at low redshift. For example, De Young (1993) suggest that trapping a radio source with about W Hz-1 in the ambient gas requires a volume-averaged gas density of order 100 cm-3. Assuming a volume-averaged density may appear somewhat artificial, but has previously shown to provide reasonable constraints (De Young, 1993; Capetti et al., 1999), and is certaintly well matched to the crudeness of our observational constraints. For low-redshift galaxies, plausible estimates of the volume-averaged ambient gas density are of order 1-10 cm-3 (De Young, 1993), however, a value of 100 cm-3 is very similar to the average density 50-380 cm-3 in SW025513 and SW022550 implied by the molecular mass of M⊙ (Polletta et al., 2011), and assuming a spherical gas distribution with radius 1-2 kpc and a filling factor of unity. As a consequence, the higher gas densities in high redshift galaxies could boost the effect of moderately strong radio sources on their surrounding gas compared to nearby galaxies, where such jets escape more easily.
In many similarly strong, low-redshift radio sources the total gas mass involved in the outflow is much smaller than in SW022513 (e.g., Morganti et al., 2005). The H luminosity in the component with FWHM1000 km s-1 implies an ionized gas mass of M⊙, estimated with the method, assumptions, and uncertainties presented in §4.1. We therefore test explicitly if the radio source in SW022513 may provide enough mechanical energy to produce the observed emission-line kinematics of H and CO. Willott et al. (1999) estimate the jet kinetic energy from the observed radio power at 151 MHz, setting W. is the observed radio power at 151 MHz in units of W Hz-1 sr-1, and is a fudge factor taking into account the most salient astrophysical uncertainties. Typically (see also Cattaneo et al., 2009). Estimating the 151 MHz radio luminosity from the measured radio fluxes at 1.4 GHz and 610 MHz (Polletta et al., 2008), we find a mechanical energy injection rate of erg s-1.
To estimate the total kinetic energy released by the radio source, we need to estimate the AGN lifetime. Blundell & Rawlings (1999) argue that the most powerful radio sources at high redshift must be very young, about yrs. We will use this estimate as a lower limit on the age of the radio source. However, Sajina et al. (2007) find that 1/31/4 of intense infrared-selected starbursts at z2 have moderately radio-loud AGN, with radio power and star-formation properties broadly similar to our sources. This suggests that moderately powerful radio sources are not uncommon amongst intensely star forming galaxies at high redshift. Assuming that all such galaxies are moderately bright radio sources at some time of their evolution yields a lower limit on the lifetime of radio sources in individual galaxies relative to the lifetime of the starburst. For typical star-formation timescales of few yrs, this would suggest that moderately radio-loud AGN at z2 have longer radio lifetimes than the most extreme radio sources, up to of-order yrs, more resembling the long activity periods of weak radio sources in nearby Seyfert galaxies (Gallimore et al., 2006) than the very short lifetimes (of-order yrs) of very powerful radio galaxies at high-z (e.g., Blundell & Rawlings, 1999).
Even if the current energy injection rate of erg s-1 in SW022513 were only maintained for yrs, the radio source would provide sufficient mechanical energy, erg, to accelerate large amounts of of molecular and ionized gas as is observed, if all of the jet’s mechanical energy is transferred to the gas at a conversion efficiency of 100%. For longer timescales, the same could be achieved with lower conversion efficiencies, of-order few 10%, closer to those found in very powerful radio galaxies at z2 (Nesvadba et al., 2008).
5.3 Will the gas escape?
AGN-driven outflows were postulated by galaxy evolution models to sweep up and unbind the remaining gas at the end of merger-triggered major episodes of star formation at high redshift. Major gas-rich mergers are the most plausible processes that may trigger intense star formation and AGN activity in high-redshift galaxies, however, our data do not reveal multiple continuum components for either source (§3.1). This could imply that both components are at distances less than the spatial resolution of our data (45 kpc) or that their stellar components have low surface brightnesses, perhaps because they are being tidally disrupted. Either interpretation would be consistent with an advanced merger stage. The same is suggested by the short gas consumption timescales of few yrs, about 10% of the age of the starburst (Polletta et al., 2011).
Finding outflows of molecular and ionized gas associated with an obscured AGN is therefore certainly consistent with this broad evolutionary picture. However, a critical question is whether the gas will escape. In §5.2.1 we estimated that the velocity dispersion corresponding to the stellar mass of SW022513 derived by Polletta et al. (2008) is likely about 300-350 km s-1, which would imply an escape velocity km s-1.
Finding gas with velocities of up to 1000 km s-1 certainly suggests that at least a fraction of the outflow in gas may ultimately become unbound, depending on how much energy is being dissipated by the outflow before the gas has reached large radii. Recent observations of molecular gas in nearby radio galaxies finding roughly similar amounts of thermal and kinetic energy suggest that dissipational processes in the molecular gas could be important for the dynamics of molecular winds (Nesvadba et al., 2010). The most direct evidence for gas escaping from the galaxy would therefore be the detection of outflowing gas that extends well beyond the radius of the host galaxies, with large velocity offsets, and aligned with the radio axis, as has been found in powerful radio galaxies at z2 (Nesvadba et al., 2006, 2007, 2008, 2011). At any rate, our observations suggest that “radio-quiet”, powerful AGN at high redshift may accelerate significant fractions of their interstellar medium to velocities near or above the escape velocity even if their radio sources are rather unconspicuous.
6 Summary
We present an analysis of deep rest-frame optical integral-field spectroscopy of two powerful obscured quasars at z3.5, SW022513 and SW022550. These are the most luminous 24m emitters in the SWIRE survey at 2 and have previously been discussed by Polletta et al. (2008); Polletta et al. (2011). Our main results are as follows:
(1) The optical line emission in both galaxies is dominated by the luminous narrow-line region ionized by the hard quasar spectrum. Emission lines are very broad in SW022550, FWHM2200 km s-1 for [OIII]4959. Emission-line profiles in SW022513 are complex. For example, [OIII]5007 is dominated by a ’narrow’ component with FWHM1275 km s-1 and has a broad, blueshifted component of up to FWHM5000 km s-1. These line widths reflect the kinematics of the narrow-line region, the broad-line region is obscured.
(2) In SW022513 the line emission is spatially extended. We identify the nucleus with the continuum peak and site of broadest [OIII]4959,5007 line emission (FWHM5000 km s-1). The peak in narrow [OIII]4959,5007 line emission is offset by 0.75″ to the South (5 kpc). This suggests that the ionized gas reaches the largest velocities near the nucleus, and is surrounded by an extended narrow-line region. For bright AGN like in SW022513 narrow-line region sizes of 10s of kpc are possible.
(3) For SW022513, and comparing with the CO(4–3) observations of Polletta et al. (2011), we find that the ionized gas mass amounts to 10%-100% of the molecular mass. CO(4–3) and H line profiles are well matched suggesting both may originate from the same gas clouds. Using the narrow H component near the nucleus to define the systemic redshift (as commonly done in AGN host galaxies) we find that about 40% of the CO line emission is from gas that does not participate in systemic motion, but is blueshifted to velocities of up to 1000 km s-1. Such large velocity offsets are not suggested by merger models including starburst-driven winds and direct empirical evidence, but could be a signature of AGN-driven winds as postulated, e.g. by Narayanan et al. (2008). In SW022550 the CO(4–3) line profile is double-peaked and very different from that of [OIII], which may suggest that the bulk of molecular gas is not affected by the AGN in a similar way, although the FWHM of the [OIII] line of 2000 km s-1 suggests that the AGN interacts with the ISM nonetheless.
(4) SW022513 and SW022550 host AGN with bolometric luminosities of erg s-1 and moderately strong radio sources. Comparing with the expected characteristics of radiation-pressure driven winds (following Murray et al., 2005) and mechanical energy injection from the radio source (following Willott et al., 1999) we find that it is difficult to produce the observed velocities with radiation pressure, whereas observations and basic energy considerations suggest the radio source as a possible driver. In this case, moderately radio-loud ULIRGs like SW022513 and SW022550 could be ’scaled-up’ versions of nearby Seyfert galaxies and ’radio-quiet’ (but not radio-silent) quasars with weak radio sources.
Acknowledgments
We are very grateful to the staff at Paranal and at IRAM for having carried out the observations on which our analysis is based. We also thank the referee, Montserrat Villar-Martin, for comments that were very helpful in improving the paper.
References
- Alatalo et al. (2010) Alatalo K. A., Blitz L., Young L. M., Davis T., Bureau M., Atlas3d Team 2010, in Bulletin of the American Astronomical Society Vol. 41 of Bulletin of the American Astronomical Society, The Unusual Case of S0 Galaxy NGC 1266. pp 382–+
- Alexander et al. (2010) Alexander D. M., Swinbank A. M., Smail I., McDermid R., Nesvadba N. P. H., 2010, \mnras, 402, 2211
- Appleton et al. (2002) Appleton P. N., Charmandaris V., Gao Y., Combes F., Ghigo F., Horellou C., Mirabel I. F., 2002, ApJ, 566, 682
- Barbosa et al. (2009) Barbosa F. K. B., Storchi-Bergmann T., Cid Fernandes R., Winge C., Schmitt H., 2009, MNRAS, 396, 2
- Baum & McCarthy (2000) Baum S. A., McCarthy P. J., 2000, AJ, 119, 2634
- Bender et al. (1992) Bender R., Burstein D., Faber S. M., 1992, \apj, 399, 462
- Bennert et al. (2002) Bennert N., Falcke H., Schulz H., Wilson A. S., Wills B. J., 2002, ApJl, 574, L105
- Blundell & Rawlings (1999) Blundell K. M., Rawlings S., 1999, Nature, 399, 330
- Capetti et al. (1999) Capetti A., Axon D. J., Macchetto F. D., Marconi A., Winge C., 1999, ApJ, 516, 187
- Cattaneo et al. (2009) Cattaneo A., Faber S. M., Binney J., Dekel A., Kormendy J., Mushotzky R., Babul A., Best P. N., Brüggen M., Fabian A. C., Frenk C. S., Khalatyan A., Netzer H., Mahdavi A., Silk J., Steinmetz M., Wisotzki L., 2009, Nature, 460, 213
- Chakrabarti et al. (2008) Chakrabarti S., Fenner Y., Cox T. J., Hernquist L., Whitney B. A., 2008, ApJ, 688, 972
- Ciotti et al. (2009) Ciotti L., Ostriker J. P., Proga D., 2009, ApJ, 699, 89
- Ciotti et al. (2010) Ciotti L., Ostriker J. P., Proga D., 2010, ArXiv e-prints
- Colina et al. (2005) Colina L., Arribas S., Monreal-Ibero A., 2005, ApJ, 621, 725
- De Young (1993) De Young D. S., 1993, \apj, 402, 95
- Downes & Solomon (1998) Downes D., Solomon P. M., 1998, ApJ, 507, 615
- Emonts et al. (2005) Emonts B. H. C., Morganti R., Tadhunter C. N., Oosterloo T. A., Holt J., van der Hulst J. M., 2005, MNRAS, 362, 931
- Feruglio et al. (2010) Feruglio C., Maiolino R., Piconcelli E., Menci N., Aussel H., Lamastra A., Fiore F., 2010, ArXiv e-prints
- Fosbury et al. (2003) Fosbury R. A. E., Villar-Martín M., Humphrey A., Lombardi M., Rosati P., Stern D., Hook R. N., Holden B. P., Stanford S. A., Squires G. K., Rauch M., Sargent W. L. W., 2003, \apj, 596, 797
- Gallimore et al. (2006) Gallimore J. F., Axon D. J., O’Dea C. P., Baum S. A., Pedlar A., 2006, AJ, 132, 546
- Granato et al. (2006) Granato G. L., Silva L., Lapi A., Shankar F., De Zotti G., Danese L., 2006, MNRAS, 368, L72
- Greene & Ho (2005a) Greene J. E., Ho L. C., 2005a, ApJ, 627, 721
- Greene & Ho (2005b) Greene J. E., Ho L. C., 2005b, ApJ, 630, 122
- Greene et al. (2011) Greene J. E., Zakamska N. L., Ho L. C., Barth A. J., 2011, ApJ, submitted
- Greene et al. (2009) Greene J. E., Zakamska N. L., Liu X., Barth A. J., Ho L. C., 2009, ApJ, 702, 441
- Guillard et al. (2009) Guillard P., Boulanger F., Pineau Des Forêts G., Appleton P. N., 2009, A&A, 502, 515
- Heckman et al. (1981) Heckman T. M., Miley G. K., van Breugel W. J. M., Butcher H. R., 1981, ApJ, 247, 403
- Holt et al. (2008) Holt J., Tadhunter C. N., Morganti R., 2008, MNRAS, 387, 639
- Hopkins et al. (2005) Hopkins P. F., Hernquist L., Cox T. J., Di Matteo T., Robertson B., Springel V., 2005, ApJ, 630, 716
- Hopkins et al. (2006) Hopkins P. F., Hernquist L., Cox T. J., Di Matteo T., Robertson B., Springel V., 2006, ApJs, 163, 1
- Humphrey et al. (2008) Humphrey A., Villar-Martín M., Vernet J., Fosbury R., di Serego Alighieri S., Binette L., 2008, MNRAS, 383, 11
- Iono et al. (2007) Iono D., Wilson C. D., Takakuwa S., Yun M. S., Petitpas G. R., Peck A. B., Ho P. T. P., Matsushita S., Pihlstrom Y. M., Wang Z., 2007, ApJ, 659, 283
- Irwin et al. (2010) Irwin J. A., Wilson C. D., Wiegert T., Bendo G. J., Warren B. E., Wang Q. D., Israel F. P., Serjeant S., Knapen J. H., Brinks E., Tilanus R. P. J., van der Werf P., Muehle S., 2010, ArXiv e-prints
- King (2003) King A., 2003, ApJl, 596, L27
- Komossa et al. (2008) Komossa S., Xu D., Zhou H., Storchi-Bergmann T., Binette L., 2008, ApJ, 680, 926
- Lehnert et al. (2009) Lehnert M. D., Nesvadba N. P. H., Tiran L. L., Matteo P. D., van Driel W., Douglas L. S., Chemin L., Bournaud F., 2009, ApJ, 699, 1660
- Leipski & Bennert (2006) Leipski C., Bennert N., 2006, A&A, 448, 165
- Leipski et al. (2006) Leipski C., Falcke H., Bennert N., Hüttemeister S., 2006, A&A, 455, 161
- Lonsdale et al. (2003) Lonsdale C. J., Smith H. E., Rowan-Robinson M., others 2003, PASP, 115, 897
- McCarthy et al. (1996) McCarthy P. J., Baum S. A., Spinrad H., 1996, ApJs, 106, 281
- Morganti et al. (2005) Morganti R., Tadhunter C. N., Oosterloo T. A., 2005, A&A, 444, L9
- Murray et al. (2005) Murray N., Quataert E., Thompson T. A., 2005, ApJ, 618, 569
- Narayanan et al. (2008) Narayanan D., Cox T. J., Kelly B., Davé R., Hernquist L., Di Matteo T., Hopkins P. F., Kulesa C., Robertson B., Walker C. K., 2008, ApJs, 176, 331
- Nelson & Whittle (1996) Nelson C. H., Whittle M., 1996, ApJ, 465, 96
- Nesvadba et al. (2010) Nesvadba N. P. H., Boulanger F., Salomé P., Guillard P., Lehnert M. D., Ogle P., Appleton P., Falgarone E., Pineau Des Forets G., 2010, \aap, 521, A65+
- Nesvadba et al. (2011) Nesvadba N. P. H., De Breuck C., Lehnert M. D., Best P. N., Binette L., Proga D., 2011, \aap, 525, A43+
- Nesvadba et al. (2008) Nesvadba N. P. H., Lehnert M. D., Davies R. I., Verma A., Eisenhauer F., 2008, A&A, 479, 67
- Nesvadba et al. (2007) Nesvadba N. P. H., Lehnert M. D., De Breuck C., Gilbert A., van Breugel W., 2007, A&A, 475, 145
- Nesvadba et al. (2008) Nesvadba N. P. H., Lehnert M. D., De Breuck C., Gilbert A. M., van Breugel W., 2008, \aap, 491, 407
- Nesvadba et al. (2006) Nesvadba N. P. H., Lehnert M. D., Eisenhauer F., Genzel R., Seitz S., Davies R. I., Saglia R. P., Lutz D., Tacconi L., Bender R., Abuter R., 2006, ApJ, 650, 661
- Nesvadba et al. (2006) Nesvadba N. P. H., Lehnert M. D., Eisenhauer F., Gilbert A., Tecza M., Abuter R., 2006, ApJ, 650, 693
- Nesvadba et al. (2007) Nesvadba N. P. H., Lehnert M. D., Genzel R., Eisenhauer F., Baker A. J., Seitz S., Davies R., Lutz D., Tacconi L., Tecza M., Bender R., Abuter R., 2007, ApJ, 657, 725
- Netzer et al. (2004) Netzer H., Shemmer O., Maiolino R., Oliva E., Croom S., Corbett E., di Fabrizio L., 2004, ApJ, 614, 558
- Norman et al. (2002) Norman C., Hasinger G., Giacconi R., Gilli R., Kewley L., Nonino M., Rosati P., Szokoly G., Tozzi P., Wang J., Zheng W., Zirm A., Bergeron J., Gilmozzi R., Grogin N., Koekemoer A., Schreier E., 2002, \apj, 571, 218
- Ogle et al. (2010) Ogle P., Boulanger F., Guillard P., Evans D. A., Antonucci R., Appleton P. N., Nesvadba N., Leipski C., 2010, \apj, 724, 1193
- Osterbrock (1989) Osterbrock D. E., 1989, Astrophysics of gaseous nebulae and active galactic nuclei
- Papadopoulos et al. (2008) Papadopoulos P. P., Kovacs A., Evans A. S., Barthel P., 2008, \aap, 491, 483
- Papadopoulos et al. (2010) Papadopoulos P. P., van der Werf P., Isaak K., Xilouris E. M., 2010, ApJ, 715, 775
- Pettini et al. (2001) Pettini M., Shapley A. E., Steidel C. C., Cuby J.-G., Dickinson M., Moorwood A. F. M., Adelberger K. L., Giavalisco M., 2001, ApJ, 554, 981
- Pierre et al. (2007) Pierre M., Chiappetti L., Pacaud F., et al., 2007, \mnras, 382, 279
- Polletta et al. (2011) Polletta M., et al., 2011, ApJ, to be submitted
- Polletta et al. (2008) Polletta M., Omont A., Berta S., Bergeron J., Stalin C. S., Petitjean P., Giorgetti M., Trinchieri G., Srianand R., McCracken H. J., Pei Y., Dannerbauer H., 2008, A&A, 492, 81
- Reynolds et al. (2009) Reynolds C., Punsly B., Kharb P., O’Dea C. P., Wrobel J., 2009, ApJ, 706, 851
- Sajina et al. (2007) Sajina A., Yan L., Lacy M., Huynh M., 2007, ApJl, 667, L17
- Sakamoto et al. (2006) Sakamoto K., Ho P. T. P., Peck A. B., 2006, ApJ, 644, 862
- Smail et al. (2004) Smail I., Chapman S. C., Blain A. W., Ivison R. J., 2004, ApJ, 616, 71
- Spoon et al. (2009) Spoon H. W. W., Armus L., Marshall J. A., Bernard-Salas J., Farrah D., Charmandaris V., Kent B. R., 2009, ApJ, 693, 1223
- Spoon & Holt (2009) Spoon H. W. W., Holt J., 2009, ApJl, 702, L42
- Springel et al. (2005) Springel V., Di Matteo T., Hernquist L., 2005, MNRAS, 361, 776
- Swinbank et al. (2006) Swinbank A. M., Chapman S. C., Smail I., Lindner C., Borys C., Blain A. W., Ivison R. J., Lewis G. F., 2006, MNRAS, 371, 465
- Swinbank et al. (2005) Swinbank A. M., Smail I., Bower R. G., Borys C., Chapman S. C., Blain A. W., Ivison R. J., Howat S. R., Keel W. C., Bunker A. J., 2005, MNRAS, 359, 401
- Swinbank et al. (2004) Swinbank A. M., Smail I., Chapman S. C., Blain A. W., Ivison R. J., Keel W. C., 2004, \apj, 617, 64
- Takata et al. (2006) Takata T., Sekiguchi K., Smail I., Chapman S. C., Geach J. E., Swinbank A. M., Blain A., Ivison R. J., 2006, ApJ, 651, 713
- Tecza et al. (2004) Tecza M., Baker A. J., Davies R. I., Genzel R., Lehnert M. D., Eisenhauer F., Lutz D., Nesvadba N., Seitz S., Tacconi L. J., Thatte N. A., Abuter R., Bender R., 2004, ApJl, 605, L109
- Tody (1993) Tody D., 1993, in Hanisch R. J., Brissenden R. J. V., Barnes J., eds, Astronomical Data Analysis Software and Systems II Vol. 52 of Astronomical Society of the Pacific Conference Series, IRAF in the Nineties. pp 173–+
- Tremonti et al. (2004) Tremonti C. A., Heckman T. M., Kauffmann G., Brinchmann J., Charlot S., White S. D. M., Seibert M., Peng E. W., Schlegel D. J., Uomoto A., Fukugita M., Brinkmann J., 2004, ApJ, 613, 898
- Ulvestad et al. (1999) Ulvestad J. S., Wrobel J. M., Carilli C. L., 1999, ApJ, 516, 127
- Veilleux et al. (2003) Veilleux S., Shopbell P. L., Rupke D. S., Bland-Hawthorn J., Cecil G., 2003, AJ, 126, 2185
- Vernet et al. (2001) Vernet J., Fosbury R. A. E., Villar-Martín M., Cohen M. H., Cimatti A., di Serego Alighieri S., Goodrich R. W., 2001, \aap, 366, 7
- Villar-Martín et al. (1999) Villar-Martín M., Binette L., Fosbury R. A. E., 1999, \aap, 346, 7
- Villar-Martín et al. (2008) Villar-Martín M., Humphrey A., Martínez-Sansigre A., Pérez-Torres M., Binette L., Zhang X. G., 2008, \mnras, 390, 218
- Villar-Martin et al. (1997) Villar-Martin M., Tadhunter C., Clark N., 1997, A&A, 323, 21
- Villar-Martín et al. (2003) Villar-Martín M., Vernet J., di Serego Alighieri S., Fosbury R., Humphrey A., Pentericci L., 2003, MNRAS, 346, 273
- Willott et al. (1999) Willott C. J., Rawlings S., Blundell K. M., Lacy M., 1999, MNRAS, 309, 1017
- Wong et al. (2006) Wong O. I., Ryan-Weber E. V., A. G. D., et al., 2006, MNRAS, 371, 1855
| Line ID | z | FWHM | FWHM | flux | ||
|---|---|---|---|---|---|---|
| (1) | (2) | (3) | (4) | (5) | (6) | (7) |
| OIII | 4959 | 3.8760.001 | 241827 | 179.5 | 2212178 | 8.20.76 |
| NeV | 3456 | 3.8610.002 | 166536 | 166.3 | 2985267 | 4.2845 |
| Line ID | z | FWHM | FWHM | flux | ||
|---|---|---|---|---|---|---|
| (1) | (2) | (3) | (4) | (5) | (6) | (7) |
| OIII | 5007 | 3.423120.0009 | 2214664 | 95.96 | 127577 | 40.92.5 |
| OIII | 4959 | 3.442390.0005 | 2193805 | 93.96 | 125982 | 14.61.0 |
| H | 4861 | 3.424380.0009 | 2150695 | 69.15 | 929.670 | 6.80.6 |
| OII | 3727 | 3.424800.0009 | 1649123 | 105.17 | 1895.1120 | 19.40.1 |
| Line ID | z | FWHM | FWHM | flux | ||
|---|---|---|---|---|---|---|
| (1) | (2) | (3) | (4) | (5) | (6) | (7) |
| OIII | 5007 | 3.42270.0009 | 221444 | 463 | 57940 | 1.220.09 |
| OIII | 4959 | 3.42270.0010 | 219325 | 455 | 57970 | 0.400.06 |
| OIII | 5007 | 3.40320.0018 | 220479 | 37432 | 5087447 | 2.580.25 |
| OIII | 4959 | 3.40310.0058 | 2183528 | 37095 | 50871309 | 0.850.25 |
| H | 4861 | 3.42470.0010 | 215045 | 265 | 36940 | 0.320.05 |
| H | 4861 | 3.422 0.0010 | 214915 | 7215 | 100073 | 0.300.07 |
| OII | 3727 | 3.42400.0010 | 164883 | 584 | 103773 | 1.190.09 |
| NeIII | 3869 | 3.42480.0010 | 171174 | 414 | 68282 | 0.370.06 |
| Line ID | z | FWHM | FWHM | flux | ||
|---|---|---|---|---|---|---|
| (1) | (2) | (3) | (4) | (5) | (6) | (7) |
| OIII | 5007 | 3.42310.0009 | 221464 | 372 | 45529 | 3.340.22 |
| OIII | 4959 | 3.42310.0009 | 219345 | 373 | 45538 | 1.100.1 |
| OIII | 5007 | 3.41430.0016 | 221028 | 15919 | 2152257 | 1.340.2 |
| OIII | 4959 | 3.41430.0059 | 2189029 | 15866 | 2152907 | 0.440.23. |
| H | 4861 | 3.42380.0010 | 215055 | 435 | 55370 | 0.640.1 |
| OII | 3727 | 3.42450.0009 | 164904 | 423 | 73465 | 0.930.1 |
| NeIII | 3869 | 3.42540.0012 | 171215 | 348 | 559136 | 0.270.08 |
| Line ID | z | FWHM | FWHM | flux | ||
|---|---|---|---|---|---|---|
| (1) | (2) | (3) | (4) | (5) | (6) | (7) |
| OIII | 5007 | 3.42530.0009 | 221575 | 473 | 60442 | 1.430.11 |
| H | 4861 | 3.42540.0009 | 215134 | 202 | 16523 | 0.290.05 |
| OII | 3727 | 3.42620.0010 | 164964 | 353 | 60665 | 1.120.15 |
| NeIII | 3869 | 3.42730.0010 | 171284 | 275 | 40976 | 0.530.13 |