The Microlensing Properties of a Sample of 87 Lensed Quasars
Abstract
Gravitational microlensing is a powerful tool for probing the physical properties of quasar accretion disks and properties of the lens galaxy such as its dark matter fraction and mean stellar mass. Unfortunately the number of lensed quasars () exceeds our monitoring capabilities. Thus, estimating their microlensing properties is important for identifying good microlensing candidates as well as for the expectations of future surveys. In this work we estimate the microlensing properties of a sample of 87 lensed quasars. While the median Einstein radius crossing time scale is years, the median source crossing time scale is months. Broadly speaking, this means that on year timescales roughly half the lenses will be quiescent, with the source in a broad demagnified valley, and roughly half will be active with the source lying in the caustic ridges. We also found that the location of the lens system relative to the CMB dipole has a modest effect on microlensing timescales, and in theory microlensing could be used to confirm the kinematic origin of the dipole. As a corollary of our study we analyzed the accretion rate parameters in a sub-sample of 32 lensed quasars. At fixed black hole mass, it is possible to sample a broad range of luminosities (i.e., Eddington factors) if it becomes feasible to monitor fainter lenses.
1 Introduction
The presence of compact objects, primarily stars and white dwarfs, close to the line of sight towards lensed quasar images can induce uncorrelated flux variations through gravitational microlensing. The relative motions of the quasar, the lens, its stars and the observer change the geometrical configuration of these microlenses, leading to changes in the total magnification. These fluctuations, suggested initially by Chang Refsdal (1979) and Gott (1981), were first detected by Irwin et al. (1989) in the quadruple lensed quasar Q2237+0305 (Huchra et al., 1985). Since then gravitational microlensing has been detected in many other systems (see review by Wambsganss, 2006), and in the last 5 years the field has grown rapidly.
Microlensing depends on the size and structure of the source, the relative velocities of the components, the mass of the microlenses and the surface density and shear of the lens galaxy near the images. In particular, a range of approaches have been used to examine the geometry and properties of quasar accretion disks, which are very likely to be microlensed because their sizes are similar or smaller than microlensing length scales. For example the amplitude of microlensing fluctuations are governed by the size of the source, so microlensing light curves can be analyzed to infer the spatial structure of the disk (e.g., Wyithe et al., 2000, 2002; Kochanek, 2004). This can be done by directly modeling the lightcurves, and the most advanced models include the motion of individual stars which allows explorations of the shape and orientation of the disk (Poindexter Kochanek, 2010a, b). In addition, if intrinsic quasar variations are due to changes in the area of the accretion disk, there is the possibility of measuring its effects on the microlensing signal (Blackburne Kochanek, 2010; Dexter Agol, 2011). The continuum sizes estimated with microlensing techniques were used by Morgan et al. (2010) to determine the relationship between the accretion disk size and the black hole (BH) mass, and the scaling they found is consistent with the predictions of the thin disk theory (). The microlensing sizes, however, seem to be larger than estimates based on either the observed fluxes or black hole mass measurements (Pooley et al., 2007; Morgan et al., 2010).
Measuring the amplitude of microlensing as a function of wavelength constrains the temperature profile of the optical emitting region of the disk. Since quasar accretion disk models (e.g., Blaes et al., 2004) predict cooler temperatures for more distant, larger parts of the disk, different microlensing magnifications are expected for different temperatures (i.e. at different wavelengths). This wavelength dependence, also known as chromatic microlensing, has been observed and analyzed in many systems (Wisotzki et al., 1993, 1995; Wucknitz et al., 2003; Anguita et al., 2008; Bate et al., 2008; Eigenbrod et al., 2008; Poindexter et al., 2008; Floyd et al., 2009; Mosquera et al., 2009, 2011; Blackburne et al., 2010; Mediavilla et al., 2011) and, except for the results found by Floyd et al. (2009), the temperature profiles are generally consistent with simple thin disk models (Shakura and Sunyaev, 1973) or with shallower temperature profiles that would help to explain the size discrepancies (see Morgan et al., 2010).
Microlensing has also been used to study the geometry of the non-thermal emission regions. For example, the production of the observed X-ray radiation from the disk is currently described by two general scenarios (e.g., Rozanska Czerny, 2000; Sobolewska et al., 2004a, b) but it is still not well understood. Several microlensing studies combining optical and X-ray flux ratios (Pooley et al., 2007; Morgan et al., 2008; Chartas et al., 2009; Dai Kochanek, 2009; Blackburne et al., 2010) suggest that the X-ray emission originates in a compact region close to the central BH. However, further studies are needed to verify these results and to determine the scaling of the X-ray emission region with energy and BH mass. The spatial structure of the broad line region (BLR) of quasars has also been explored using microlensing (e.g., Lewis Belle, 1998; Abajas et al., 2002; Sluse et al., 2007, 2011; O’Dowd et al., 2010).
Finally, microlensing has also been used to study the distribution of matter in the lensing galaxies. Morgan et al. (2008), Dai et al. (2010), and Bate et al. (2011) considered individual systems, while Mediavilla et al. (2009) and Pooley et al. (2009) surveyed multiple lens galaxies. These studies consistently favor models where the surface mass density is dominated by dark matter and stars represent only of the local matter. The exception is the lens Q 2237+030, where the images are seen through the bulge of a nearby spiral galaxy and the models correctly find that the surface density is dominated by stars.
The number of known lensed quasars111Lens quasars have been discovered in many cases serendipitously, and in other cases they were found in a broad different range of lens/quasar surveys. A compact summary of these surveys and the different methodologies applied to find the lenses can be found in Kochanek (2006). () is presently much larger than our capacity to regularly monitor for microlensing variability. While some estimates can be made from “static” measurements as a function of wavelength (e.g., Floyd et al., 2009; Mosquera et al., 2011; Mediavilla et al., 2011), these require strong priors that are subject to systematic problems and cannot probe all the physics involved. Given this problem, it seems useful to survey the microlensing properties of the known lenses to identify those that may have shorter timescales, larger amplitudes, or other properties that make them better (or worse) targets. With that aim, we have joined together the lensed quasars from the CfA-Arizona Space Telescope LEns Survey (CASTLES; Falco et al., 2001) of gravitational lenses222http://www.cfa.harvard.edu/castles/ and the Sloan Digital Sky Survey Quasar Lens Search (SQLS; Oguri et al., 2006)333http://www-utap.phys.s.u-tokyo.ac.jp/sdss/sqls/, and we have estimated the microlensing properties of 87 systems. In Section 2 we review the theoretical background on microlensing properties, and the selection criteria for the lensed quasars used in our analysis. In Section 3 we interpret the results and discuss their the main implications. Throughout this work we assume , , and km sec-1 Mpc-1.
2 Procedure
The magnification pattern caused by the stars and compact objects in the lens galaxy has a characteristic scale set by the Einstein radius of the microlenses, . Microlensing fluctuations will be significant if the characteristic source size, , satisfies , and their amplitude will be controlled by , with smaller ratios leading to larger amplitudes. The timescales for microlensing variations to occur will be given by the characteristic times and , where is the effective transverse velocity of the source.
2.1 Microlensing length scales
The microlensing regime is governed by the Einstein radius of the microlenses, which is defined on the source plane by
| (1) |
where is the gravitational constant, is the speed of light, is the mean mass of the compact objects, and , , are the angular diameter distances between the observer, the lens, and the source.
The other length scale on which microlensing depends is the size of the source, , since fluctuations are expected to be important when . In the case of lensed quasars, the accretion disk should generally be sufficiently compact to satisfy this criterion for typical microlens masses and standard source and lens redshifts. The accretion disk size can be estimated assuming a simple thin-disk model (Shakura and Sunyaev, 1973), from either the measured flux (Equation 2), or the central BH mass, (Equation 3). For a thin disk emitting as a black body with temperature profile , and (safely) ignoring relativity and inner edge effects, the radius where the disk temperature matches the rest wavelength of the observations () is given by
| (2) |
where is the angular diameter distance to the quasar in units of the Hubble radius, is the disk inclination angle, and is magnification-corrected magnitude. We have normalized Equation 2 to the zero point (zpt) of AB magnitude system (Oke Gunn, 1983), but have primarily applied it to the observed I band magnitudes (m and zpt Jy). We refer to this as the “flux size” of the quasar. For the same disk model, the disk size can be estimated from the mass of the black hole and the luminosity as
| (3) |
where is the luminosity in units of the Eddington luminosity, and is the accretion efficiency. As discussed by Morgan et al. (2010), these two estimates should in principle yield the same disk size. However, for typical accretion rate values, and (e.g., Kollmeier et al., 2006; Hopkins Hernquist, 2009; Schulze Wisotzki, 2010), the flux sizes are significantly smaller than the theoretical sizes (e.g., Collin et al., 2002). This can be rectified by assuming higher efficiencies, or very low luminosities, but this leads to problems for models of black hole growth (Steed Weinberg, 2003; Shankar et al., 2004, 2009). Dexter Agol (2011) argue that temperature fluctuations in the disk can increase the effective disk size compared to Equation 2 and rectify these differences. While uncertainties in the BH mass and magnification measurements also affect these estimates, they are generally less important and too small to solve the problem.
Since black hole masses have been measured for only 32 of the known lensed quasars (see below), in most of this work we will refer to the source disk size, , as the one derived from the I-band flux in Equation 2 (unless otherwise stated). We adopted a mean inclination of in all cases, and the magnification-corrected magnitudes were calculated from the observed magnitudes of the CASTLES and the SQLS surveys using either already existing lens models (see references in Table 1) or corrected by magnifications estimated from simple singular isothermal sphere (SIS) plus shear models. In the case of the systems B0850054 and Q1208+101, where the position of the lens galaxy is unknown, we adopted a mean magnification (Turner et al., 1984). For those systems lacking I-band measurements, but observed at other wavelengths, the size in Equation 2 was calculated for that band and then converted to assuming the size-wavelength scaling of the thin disk model . We focused on a fixed observed rather than rest wavelength because it is more closely related to observations. Pooley et al. (2007) and Morgan et al. (2010) found that these flux sizes generally underestimate the size inferred from microlensing by a factor of 2 - 3.
We have also estimated the sizes of the BLR, , although they are less likely to be microlensed due to their bigger extent (e.g., Bentz et al., 2006). We used the H BLR size-luminosity relationship,
| (4) |
with and (Bentz et al., 2009). The mean luminosity at rest-frame 5100 Å, , was calculated using a quasar spectral energy distribution template (Assef et al., 2010b) to scale the I-band flux to an estimate of the rest-frame flux at 5100 Å.
2.2 Microlensing timescales
The characteristic timescales for microlensing variability combine the length scales with the expected effective velocity of the source. If , microlensing fluctuations will certainly occur on the timescale , at which the source moves an Einstein radius. If the source is compact and moving through active regions of the caustic networks, magnification changes are expected on a shorter timescale, , corresponding to the time it takes the source to cross its own size, . The effective velocity has three components (Kayser et al., 1986), corresponding to the motions of the observer, the lens and the source. We estimated an effective source plane velocity following Kochanek (2004) as
| (5) |
where is the one dimensional rms galaxy peculiar velocity at redshift , is the projection of the CMB dipole velocity (Hinshaw et al., 2009) onto the lens plane, and is the velocity dispersion of the stars in the lens galaxy. We evaluated based on the peculiar velocity models of Tinker et al. (2011)444Their results were obtained using a subhalo abundance matching technique, see Conroy et al. (2006) and Wetzel White (2010) for details on this method., interpolating between their fiducial redshifts as log10(1+z), with
| (6) |
where the coefficients and are given in Table 2. We estimated the stellar velocity dispersion from the image separation as
| (7) |
since the velocities inferred from the SIS model agree well with the measured dispersions of lens galaxies (e.g., Treu et al., 2009).
2.3 Redshifts
In order to calculate the microlensing timescales we need both the source and lens redshifts. Unfortunately in many cases they are not known. We restricted our study to 87 lensed quasars with known source redshifts. Of these, 33 lack spectroscopic lens redshifts. Table 1 lists the systems and their properties. Where lens redshifts are missing, we used estimates based on the fundamental plane (e.g., Kochanek et al., 2000; Rusin et al., 2003), the Faber Jackson (1976) relationship (e.g., Keeton et al., 1998; Rusin et al., 2003), galaxy colors (e.g., Kayo et al., 2010), and clear detections of strong, lower redshift absorption lines in the quasar spectra (e.g., Lacy et al., 2002). As a final resort, we use the maximum likelihood lens redshift for producing a lens of separation from a source at redshift following Ofek et al. (2003). In Table 1 we note which method was applied to estimate the unknown lens redshifts.
3 Results and Discussion
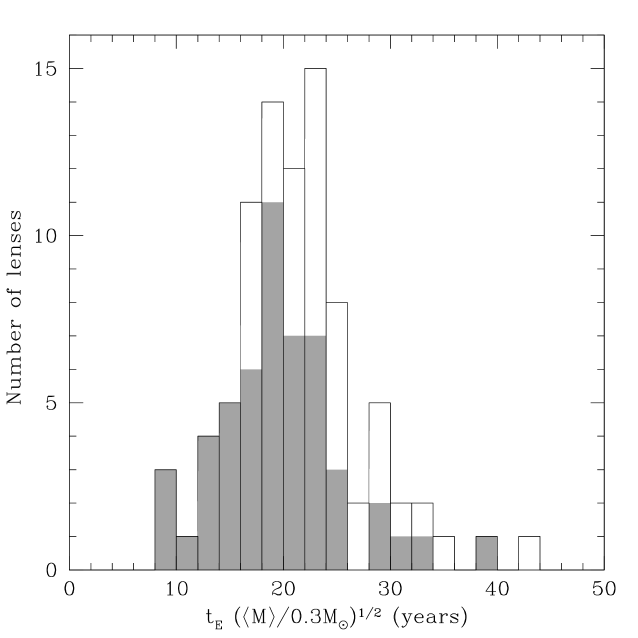
We summarize the microlensing scale estimates assuming a mean stellar mass of in Table 1. Figures 1 and 2 show the histograms for and , respectively, where the gray histogram includes only the systems with a spectroscopic redshift for the lens galaxy. The Einstein crossing time has a peak at years, and ranges from years (Q 2237+0305) to years (Q 1208+101). The shape of the histogram can be explained by combining Equations 1 and 7 to find that
| (8) |
Short timescales are rare because there is little volume at low redshifts (the term), and long time scales are rare because large separation lenses are rare (the term). The bulk velocity matters little unless it is very large compared to the lens dispersion. The 5 shortest Einstein crossing timescales ( years) are for Q0957561, SDSSJ10044112, SDSS10292623, RXJ11311231, and Q2237030, where the first three systems are lensed by galaxy groups or clusters having higher velocity dispersions. In the case of Q2237030 and to a lesser extent, RXJ11311231, the small lens distance “magnifies” all the velocity terms in Equation 5 to give a short time scale.
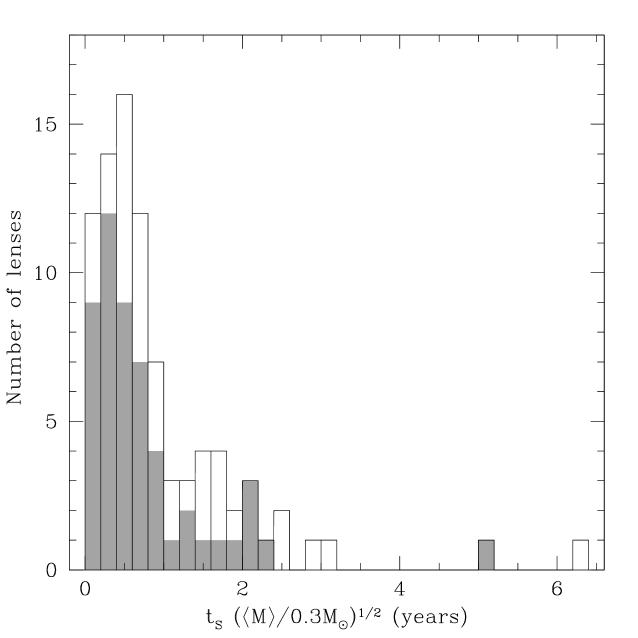
Although the characteristic times to cross the Einstein radius are sometimes discouragingly large, the source crossing time scales on which we can see microlensing variations are considerably shorter (Figure 2), ranging from week (B2045265) to years (Q1208101), although in this latter case we assumed the mean magnification correction of a SIS model. The 5 shortest timescale systems are PMNJ01340931, B0712472, SDSS10110143, B1359154, and B2045265 ( weeks). Unfortunately, small sources also correspond to low luminosity sources, so these tend to be some of the hardest systems to monitor. If a lens is in an active region of caustics it should be microlensed on very short time scales and we found that of the lens systems have months, have months, and have year. Even though our estimates are based on rough approximations, microlensing fluctuations observed in regularly monitored systems like HE 04351223 (e.g., Blackburne Kochanek, 2010; Courbin et al., 2010), RXJ 11311231 (e.g., Kozlowski et al., 2011) and Q 22370305 (e.g., Udalski et al., 2006) agree well with our predictions. For those systems we estimated months for the first and months for the other two.
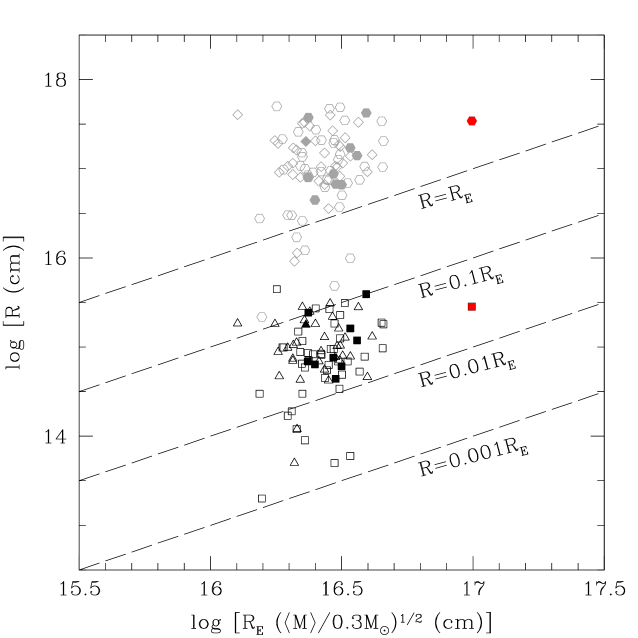
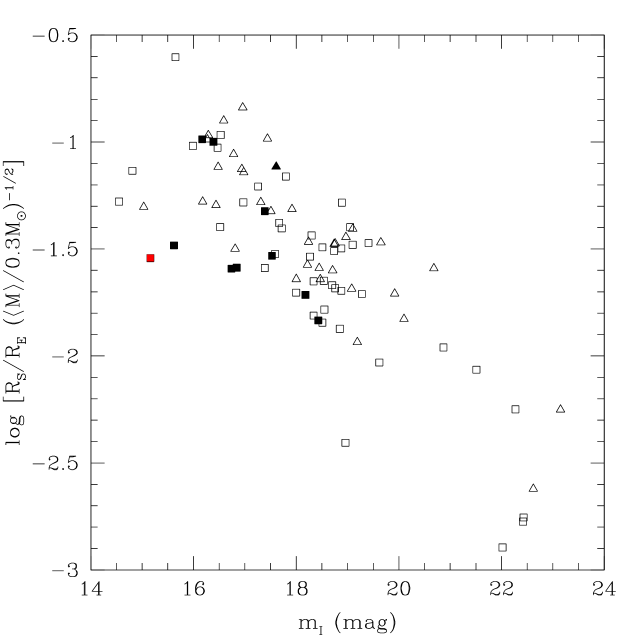
The amplitudes of the microlensing fluctuations are controlled by , with smaller ratios leading to higher amplitudes. For all the systems have (Figure 3, black points), and the ratio ranges from (B2045265) to (SBS0909523). While the exact ratio depends on the assumed mean mass , it is unlikely that changes greatly between lenses, so the relative ordering of the systems is principally uncertain due to the uncertainties in , where the largest problem is the evidence from microlensing of an offset between from Equation 2 and microlensing measurements (Pooley et al., 2007; Morgan et al., 2010). In Figure 3 we have marked the systems with microlensing size measurements (filled squares; Morgan et al., 2010), and we see that they tend to be systems with ratios . The 5 systems with the largest potential amplitudes are PMNJ01340931, B0712472, SDSS10110143, B1359154, and B2045265. These are due to small sources rather than large . Figure 4 illustrates the strong correlation of with the total flux of the lens that is expected given a strong correlation of the disk size with luminosity (Equation 2). If we are restricted to systems brighter than 19 mag in the -band, then the best five systems to search for higher amplitude, shorter timescale microlensing variability are PMNJ01340931, SDSSJ08195356, SDSSJ10292623, SDSSJ12512935, and Q22370305. While relatively large amplitudes have been observed in Q22370305 microlensing fluctuations have not been observed in PMNJ01340931 (which may be problematic for other reasons, see Keeton Winn (2003)), and SDSSJ10292623 is a cluster lens where there may be few stars near the lensed images. In the case of SDSSJ08195356 and SDSSJ12512935 modest flux ratio anomalies have been observed and better observations are required to understand their origin. In Figure 3 we have also plotted the BLR sizes for comparison (gray points), and although most of the systems have some of them would be likely to show microlensing fluctuations in the BLR. These small BLR-size systems have an obvious correspondence with those having smaller accretion disks.
Since Morgan et al. (2010) found correlations of disk size with BH masses, the next frontier is to search for correlations with accretion states, particularly the Eddington factor. For those lens systems where the mass of the BH has been estimated from line width measurements (Peng et al., 2006; Greene et al., 2010; Assef et al., 2010), we have calculated for and based on Equation 3. In Figure 5 we compare these to the disk size estimates from the I-band flux, , using Equation 2. As noted by Pooley et al. (2007) and Morgan et al. (2010), we see that most of the systems lie below the one-to-one relationship. The mean offset corresponds in Equation 2 to an Eddington efficiency factor of log. If we can use the flux size from Equation 2 as an estimate of the disk size in Equation 3, we can estimate the Eddington term as , as shown in Figure 6 (top panel). The strong trend with BH mass and the presence of extreme values suggests that this may not be a reliable indicator of differences in accretion state at fixed BH mass. Alternatively we could simply examine the distribution of magnification corrected luminosity555The observed luminosity of the source in I-band is given by ergs s-1, where is the unmagnified observed magnitude, and is the angular diameter distance. with black hole mass, as also shown in Figure 6 (bottom panel). It certainly seems possible to sample a relatively broad range of source sizes at a fixed given the distribution of either the Eddington term estimate or the intrinsic luminosities. The problem again is that most of the low luminosity quasars with low Eddington factors and small are also faint. Quantitatively exploring these systems will likely require deeper surveys such as the Large Synoptic Survey Telescope666http://www.lsst.org/lsst/ (Gilmore, 2006).
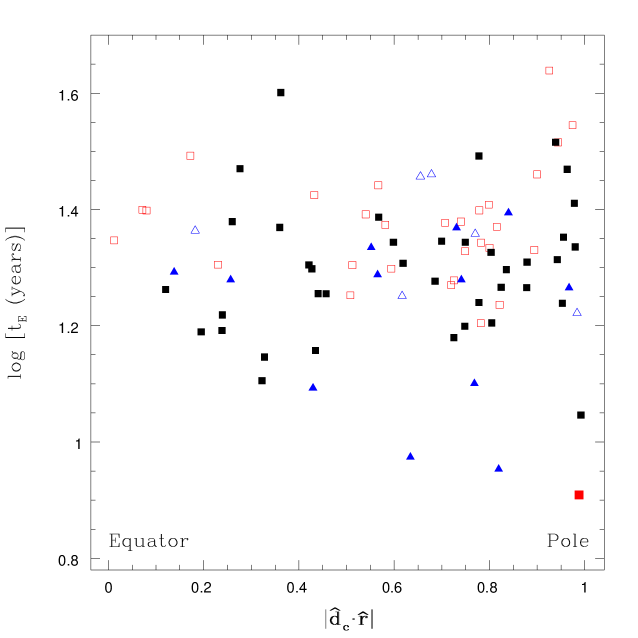
Finally, we note that the dependence on the projection of the CMB dipole velocity (Hinshaw et al., 2009) means that microlensing variability should be enhanced along the equator of the dipole and suppressed along the poles. Figure 7 shows the distribution of the Einstein crossing timescales as a function of the cosine between the dipole and the lens positions . While there is significant scatter due to the differences in redshift and sizes, a modest trend is present for the systems with spectroscopic redshifts (filled squares), and excluding systems lensed by galaxy groups or cluster (triangles) since their higher velocity dispersions overwhelm the dipole contribution. Since the CMB dipole contribution is only one of three similar velocity scales in Equation 5 it is never a dominant effect. At present, the CMB dipole is useful as a prior on microlensing models and to help select lenses with shorter variability timescales, but, in theory, microlensing could be used to confirm the kinematic origin for the dipole.
Acknowledgments: We would like to thank M. Dietrich and J. Blackburne for helpful comments on the manuscript, and we thank J. Tinker for kindly providing the galaxy velocity dispersions. A.M.M. acknowledges the support of Generalitat Valenciana, grant APOSTD/2010/030. C.S.K. is supported by NSF grant AST-0708082 and AST-1004756.
References
- Abajas et al. (2002) Abajas, C., Mediavilla, E., Muñoz, J. A., Popović, L. C., Oscoz, A. 2002, ApJ, 576, 640
- Auger et al. (2008) Auger, M. W., Fassnacht, C. D., Wong, K. C., Thompson, D., Matthews, K., Soifer, B. T. 2008, ApJ, 673, 778
- Anguita et al. (2008) Anguita, T., Schmidt, R. W., Turner, E. L., Wambsganss, J., Webster, R. L., Loomis, K. A., Long, D., McMillan, R. 2008, A&A, 480, 327
- Assef et al. (2010) Assef, R. J., et al. 2010, ApJ submitted, arXiv:1009.1145
- Assef et al. (2010b) Assef, R. J., et al. 2010b, ApJ, 713, 970
- Bahcall et al. (1992) Bahcall, J. N., Maoz, D., Schneider, D. P., Yanny, B., Doxsey, R. 1992, ApJ, 392, L1
- Bate et al. (2011) Bate, N. F., Floyd, D. J. E., Webster, R. L., Wyithe, J. S. B. 2011, ApJ, in press (arXiv:1103.0353)
- Bate et al. (2008) Bate, N. F., Floyd, D. J. E., Webster, R. L., Wyithe, J. S. B. 2008, MNRAS, 391, 1955
- Bentz et al. (2006) Bentz, M. C., Peterson, B. M., Pogge, R. W., Vestergaard, M., Onken, C. A., 2006, ApJ, 644, 133
- Bentz et al. (2009) Bentz, M. C., Peterson, B. M., Netzer, H., Pogge, R. W., Vestergaard, M. 2009, ApJ, 697, 160
- Biggs et al. (2003) Biggs, A. D., et al. 2003, MNRAS, 338, 1084
- Blackburne Kochanek (2010) Blackburne, J. A., Kochanek, C. S. 2010, ApJ, 718, 1079
- Blackburne et al. (2010) Blackburne, J. A., Pooley, D., Rappaport, S., Schechter, P. L. 2011, ApJ, 729, 34
- Blaes et al. (2004) Blaes, O. M. 2004, in Accretion Discs, Jets and High Energy Phenomena in Astrophysics, Vol 78, ed. Vassily Beskin et al. (Berlin:Springer), 137
- Bolton et al. (2006) Bolton, A. S., Moustakas, L. A., Stern, D., Burles, S., Dey, A., Spinrad, H. 2006, ApJ, 646, 45
- Burud et al. (1998) Burud, I., et al. 1998, ApJ, 501, L5
- Carilli et al. (1993) Carilli C. L., Rupen M. P., Yanny B. 1993, ApJ, 412, 59
- Chang Refsdal (1979) Chang, K., Refsdal, S. 1979, Nature, 282, 561
- Chartas et al. (2009) Chartas, G., Kochanek, C. S., Dai, X., Poindexter, S., Garmire, G. 2009, ApJ, 693, 174
- Chavushyan et al. (1997) Chavushyan, V. H., Vlasyuk, V. V., Stepanian, J. A., Erastova, L. K. 1997, A&A, 318, 67
- Christian et al. (1987) Christian C.A., Crabtree D., Waddell P. 1987, ApJ, 312, 45
- Claeskens et al. (1996) Claeskens, J. F., Surdej, J., Remy, M. 1996, A&A, 305, 9
- Collin et al. (2002) Collin, S., Boisson, C., Mouchet, M., Dumont, A.-M., Coupé, S., Porquet, D., Rokaki, E. 2002, A&A, 388, 771
- Conroy et al. (2006) Conroy, C., Wechsler, R. H., Kravtsov, A. V. 2006, ApJ, 647, 201
- Courbin et al. (2010) Courbin, F., et al. 2010, A&A submitted (arXiv:1009.1473)
- Cox et al. (2002) Cox, P., et al. 2002, A&A, 387, 406
- Dai Kochanek (2009) Dai, X., Kochanek, C. S. 2009, ApJ, 692, 677
- Dai et al. (2010) Dai, X., Kochanek, C. S., Chartas, G., Kozlowski, S., Morgan, C. W., Garmire, G., Agol, E. 2010, ApJ, 709, 278
- Dexter Agol (2011) Dexter, J., Agol, E. 2011, ApJ, 727, 24
- Eigenbrod et al. (2006a) Eigenbrod, A., Courbin, F., Dye, S., Meylan, G., Sluse, D., Vuissoz, C., Magain, P. 2006a, A&A, 451, 747
- Eigenbrod et al. (2006b) Eigenbrod, A., Courbin, F., Meylan, G., Vuissoz, C., Magain, P. 2006b, A&A, 451, 759
- Eigenbrod et al. (2007) Eigenbrod, A., Courbin, F., Meylan, G. 2007, A&A, 465, 51
- Eigenbrod et al. (2008) Eigenbrod, A., Courbin, F., Meylan, G., Agol, E., Anguita, T., Schmidt, R. W., Wambsganss, J. 2008, A&A, 490, 933
- Falco et al. (2001) Falco, E., et al. 2001, Gravitational Lensing: Recent Progress and Future Goals, APSC, 237, 25
- Fassnacht et al. (1999) Fassnacht, C. D., et al. 1999, AJ, 117, 658
- Fassnacht Cohen (1998) Fassnacht, C. D., Cohen, J. G. 1998, AJ, 115, 377
- Faure et al. (2009) Faure, C., Anguita, T., Eigenbrod, A., Kneib, J. P., Chantry, V., Alloin, D., Morgan, N., Covone, G. 2009, A&A, 496, 361
- Floyd et al. (2009) Floyd, D. J. E., Bate, N. F., Webster, R. L. 2009, MNRAS, 398, 233
- Faber Jackson (1976) Faber, S. M., Jackson, R. E. 1976, ApJ, 204, 668
- Gilmore (2006) Gilmore, D. 2006, The Large Synoptic Survey Telescope Project, APS, APR, E7007
- Gott (1981) Gott, J. R. 1981, ApJ, 243, 140
- Greene et al. (2010) Greene, J. E., Peng, C. Y., Ludwig, R. R. 2010, ApJ, 709, 937
- Gregg et al. (2000) Gregg, M. D.,Wisotzki, L., Becker, R.H., Maza, J., Schechter, P. L., White,R. L., Brotherton, M. S., Winn, J. N. 2000, AJ, 119, 2535
- Hagen Reimers (2000) Hagen, H. J. Reimers, D. 2000, A&A, 357, 29
- Hall et al. (2002) Hall, P. B., Richards, G. T., York, D. G., Keeton, C. R., Bowen, D. V., Schneider, D. P., Schlegel, D. J., Brinkmann, J. 2002, ApJL, 575, 51
- Henry Heasley (1986) Henry J. R. Heasley J. N. 1986, Nature, 321, 139
- Hewett et al. (1994) Hewett, P. C., Irwin, M. J., Foltz, C. B., Harding, M. E., Corrigan, R. T., Webster, R. L., Dinshaw, N. 1994, AJ, 108, 1534
- Hinshaw et al. (2009) Hinshaw, G. et al. 2009, ApJS, 180, 225
- Hopkins Hernquist (2009) Hopkins, P. F., Hernquist, L. 2009, ApJ, 698, 1550
- Huchra et al. (1985) Huchra, J., Gorenstein, M., Kent, S., Shapiro, I., Smith, G., Horine, E., Perley, R. 1985, AJ, 90, 691
- Inada et al. (2003a) Inada, N., et al. 2003a, AJ, 126, 666
- Inada et al. (2003b) Inada, N., et al. 2003b, Nature, 426, 810
- Inada et al. (2005) Inada, N., et al. 2005, AJ, 130, 1967
- Inada et al. (2006a) Inada, N., et al. 2006a, AJ, 131, 1934
- Inada et al. (2006b) Inada, N., et al. 2006b, ApJ, 653, 97
- Inada et al. (2007) Inada, N., et al. 2007, AJ, 133, 206
- Inada et al. (2009) Inada, N., et al. 2009, AJ, 137, 4118
- Irwin et al. (1989) Irwin, M. J., Webster, R. L., Hewett, P. C., Corrigan, R. T., Jedrzejewski, R. I. 1989, AJ, 98, 1989
- Irwin et al. (1998) Irwin, M. J., Ibata, R. A., Lewis, G. F., Totten, E. J. 1998, ApJ, 505, 529
- Jackson et al. (2008) Jackson, N., Ofek, E. O., Oguri, M. 2008, MNRAS, 387, 741
- Jackson et al. (2009) Jackson, N., Ofek, E. O., Oguri, M. 2009, MNRAS, 398, 1423
- Johnston et al. (2003) Johnston, D. E., et al. 2003, AJ, 126, 2281
- Kanekar Briggs (2003) Kanekar, N., Briggs, F. H. 2003, A&A, 412, L29
- Kayser et al. (1986) Kayser, R., Refsdal, S., Stabell, R. 1986, A&A, 166, 36
- Kayo et al. (2007) Kayo, I., et al. 2007, AJ, 134, 1515
- Kayo et al. (2010) Kayo, I., Inada, N., Oguri, M., Morokuma, T., Hall, P. B., Kochanek, C. S., Schneider, D. P. 2010, AJ, 139, 1614
- Keeton et al. (1998) Keeton, C. R., Kochanek, C. S., Falco, E. E. 1998, ApJ, 509, 561
- Keeton Winn (2003) Keeton, C. R., Winn, J. N. 2003, ApJ, 590, 39
- Kneib et al. (2000) Kneib, J. P., Cohen, J. G., Hjorth, J. 2000, ApJ, 544, 35
- Kochanek et al. (2000) Kochanek, C. S., et al. 2000, ApJ, 543, 131
- Kochanek (2004) Kochanek, C. S. 2004, ApJ, 605, 58
- Kochanek (2006) Kochanek, C. S. 2006, in Saas-Fee Advanced Course 33, Gravitational Lensing: Strong, Weak and Micro, ed. G. Meylan, P. Jetzer, P. North (Berlin: Springer), 453
- Kollmeier et al. (2006) Kollmeier, J. A., et al. 2006, ApJ, 648, 128
- Kondo et al. (2006) Kondo, S. 2006, ApJ, 643, 667
- Koopmans Treu (2002) Koopmans, L. V. E. Treu, T. 2002, ApJ, 568, 5
- Kozlowski et al. (2011) Kozlowski, S., et al. 2011, in preparation
- Lacy et al. (2002) Lacy, M., Gregg, M., Becker, R. H., White, R. L., Glikman, E., Helfand, D., Winn, J.N. 2002, AJ, 123, 2925
- Lawrence et al. (1984) Lawrence C. R., Schneider D. P., Schmidet M., Bennett C. L., Hewitt J. N., Burke B. F., Turner E. L., Gunn J. E. 1984, Sci, 223, 46
- Lewis Belle (1998) Lewis, G. F., Belle, K. E. 1998, MNRAS, 297, 69
- Lidman et al. (1999) Lidman, C., Courbin, F., Meylan, G., Broadhurst, T., Frye, B., Welch, W. J.W. 1999, ApJ, 514, L57
- Lidman et al. (2000) Lidman, C., Courbin, F., Kneib, J. P., Golse, G., Castander, F., Soucail, G. 2000, A&A, 364, 62
- Lubin et al. (2000) Lubin, L. M., Fassnacht, C. D., Readhead, A. C. S., Blandford, R. D., Kundić, T. 2000, AJ, 119, 451
- Magain et al. (1988) Magain, P., Surdej, J., Swings, J. P., Borgeest, U., Kayser, R., Kauhr, H., Refsdal, S., Remy, M. 1988, Nature 334, 32
- McKean et al. (2004) McKean, J. P., Koopmans, L. V. E., Browne, I. W. A., Fassnacht, C. D., Blandford, R. D., Lubin, L. M., Readhead, A. C. S. 2004, MNRAS, 350, 167
- McGreer et al. (2010) McGreer, I. D., et al. 2010, AJ, 140, 370
- McMahon Irwin (1992) McMahon, R., Irwin, M. 1992, GEMINI Newsletter Royal Greenwich Observatory, 36, 1
- Mediavilla et al. (2009) Mediavilla, E., et al. 2009, ApJ, 706, 1451
- Mediavilla et al. (2011) Mediavilla, E., et al. 2011, ApJ, 730, 16
- Morgan et al. (2008) Morgan, C. W., Kochanek, C. S., Dai, X., Morgan, N. D., Falco, E. E. 2008, ApJ, 689, 755
- Morgan et al. (2010) Morgan, C. W., Kochanek, C. S., Morgan, N. D., Falco, E. E. 2010, ApJ, 712, 1129
- Morgan et al. (2001) Morgan, N. D., Becker, R. H., Gregg, M. D., Schechter, P. L., White, R. L. 2001, AJ, 121, 611
- Morgan et al. (2003a) Morgan, N. D., Gregg, M. D., Wisotzki, L., Becker, R., Maza, J., Schechter, P. L., White, R. L. 2003a, AJ, 126, 696
- Morgan et al. (2003b) Morgan, N. D., Snyder, J. A., Reens, L. H. 2003b, AJ, 126, 2145
- Morgan et al. (2004) Morgan, N. D., Caldwell, J. A. R., Schechter, P. L., Dressler, A., Egami, E., Rix, H. 2004, AJ, 127, 2617
- Morgan et al. (2005) Morgan, N. D., Kochanek, C. S., Pevunova, O., Schechter, P. L. 2005, AJ, 129, 2531
- Mortonson et al. (2005) Mortonson, M. J., Schechter, Paul L., Wambsganss, J. 2005, ApJ, 628, 594
- Morokuma et al. (2007) Morokuma, T., et al. 2007, AJ, 133, 214
- Mosquera et al. (2009) Mosquera, A. M., Muñoz, J. A., Mediavilla, E. 2009, ApJ, 691, 1292
- Mosquera et al. (2011) Mosquera, A. M., Muñoz, J. A., Mediavilla, E., Kochanek C. S. 2011, ApJ, 728, 145
- Muñoz et al. (2001) Muñoz, J. A., et al. 2001, ApJ, 546, 769
- Myers et al. (1999) Myers, S. T., et al. 1999, AJ, 117, 2565
- Myers et al. (2003) Myers, S. T., et al. 2003, MNRAS, 341, 1
- O’Dea et al. (1992) O’Dea, C. P., Baum, S. A., Stanghelli, C., Van Breugel, W., Deustua, S., Smith E. P. 1992, AJ, 104, 1320
- O’Dowd et al. (2010) O’Dowd, M., Bate, N. F., Webster, R. L., Wayth, R., Labrie, K. 2010 (arXiv:1012.3480)
- Ofek et al. (2003) Ofek, E., O., Rix, H., W., Maoz, D. 2003, MNRAS, 343, 639
- Ofek et al. (2006) Ofek, E. O., Maoz, D., Rix, H. W., Kochanek, C. S., Falco, E. E. 2006, ApJ, 641, 70
- Ofek et al. (2007) Ofek, E. O., Oguri, M., Jackson, N., Inada, N., Kayo, I. 2007, MNRAS, 382, 412
- Oke Gunn (1983) Oke, J. B., Gunn, J. E. 1983, ApJ, 266, 713
- Oguri et al. (2004a) Oguri, M., et al. 2004a, ApJ, 605, 78
- Oguri et al. (2004b) Oguri, M., et al. 2004b, PASJ, 56, 399
- Oguri et al. (2005) Oguri, M., et al. 2005, ApJ, 622, 106
- Oguri et al. (2006) Oguri, M., et al. 2006, AJ, 132, 999
- Oguri et al. (2008a) Oguri, M., et al. 2008a, AJ, 135, 520
- Oguri et al. (2008b) Oguri, M., et al. 2008b, MNRAS, 391, 1973
- Patnaik et al. (1992) Patnaik, A. R., Browne, I. W. A., Walsh, D., Chaaee, F. H., Foltz, C. B. 1992, MNRAS, 259, 1
- Peng et al. (2006) Peng, C. Y., Impey, C. D., Rix, H. W., Kochanek, C. S., Keeton, C. R., Falco, E. E., Lehár, J., McLeod, B. A . 2006, ApJ, 649, 616
- Pindor et al. (2004) Pindor, B., et al. 2004, AJ, 127, 1318
- Pindor et al. (2006) Pindor, B., et al. 2006, AJ, 131, 41
- Poindexter et al. (2008) Poindexter, S., Morgan, N., Kochanek, C. S. 2008, ApJ, 673, 34
- Poindexter Kochanek (2010a) Poindexter, S., Kochanek, C. S. 2010a, ApJ, 712, 658
- Poindexter Kochanek (2010b) Poindexter, S., Kochanek, C. S. 2010b, ApJ, 712, 668
- Pooley et al. (2009) Pooley, D., Rappaport, S., Blackburne, J., Schechter, P. L., Schwab, J., Wambsganss, J. 2009, ApJ, 697, 1892
- Pooley et al. (2007) Pooley, D., Blackburne, J. A., Rappaport, S., Schechter, P. L. 2007, ApJ, 661, 19
- Reimers et al. (2002) Reimers, D., Hagen, H. J., Baade, R., Lopez, S. M., Tytler, D. 2002, A&A, 382, 26
- Rozanska Czerny (2000) Rozanska, A., Czerny, B. 2000, A&A, 360, 1170
- Rusin et al. (2000) Rusin, D., et al. 2000, ApJ, 533, 89
- Rusin et al. (2003) Rusin, D. et al. 2003, ApJ, 587, 143
- Schechter (1980) Schechter, P. L. 1980, AJ, 85, 801
- Schechter et al. (1998) Schechter, P. L., Gregg, M. D., Becker, R. H., Helfand, D. J., White, R. L. 1998, AJ, 115, 1371
- Schechter Wambsganss (2002) Schechter, P. L., Wambsganss, J. 2002, ApJ, 580, 685
- Schulze Wisotzki (2010) Schulze, A., Wisotzki, L. 2010, A&A, 516, 87
- Shakura and Sunyaev (1973) Shakura, N. I., Sunyaev, R. A. 1973, A&A, 24, 337
- Shankar et al. (2004) Shankar, F., Salucci, P., Granato, G. L., DeZotti, G., Danese, L. 2004, MNRAS, 354, 1020
- Shankar et al. (2009) Shankar, F., Weinberg, D. H., Miralda-Escudé, J. 2009, ApJ, 690, 20
- Siemiginowska et al. (1998) Siemiginowska, A., Bechtold, J., Aldcroft, T. L., McLeod, K. K., Keeton, C. R. 1998, ApJ, 503, 118
- Sluse et al. (2003) Sluse, D., Surdej, J., Claeskens, J. F., Hutsemékers, D., Jean, C., Courbin, F., Nakos, T., Billeres, M., Khmil, S. V. 2003, A&A, 406, 43
- Sluse et al. (2007) Sluse, D., Claeskens, J.-F., Hutsemékers, D., Surdej, J. 2007, A&A, 468, 885
- Sluse et al. (2011) Sluse, D., Schmidt, R., Courbin, F., Hutsemékers, D., Meylan, G., Eigenbrod, A., Anguita, T., Agol, E., Wambsganss, J. 2011, A&A, 528, 100
- Smette et al. (1992) Smette, A., Surdej, J., Shaver, P. A., Foltz, C. B., Chaffee, F. H., Weymann, R. J., Williams, R. E., Magain P., 1992, ApJ, 389, 39
- Sobolewska et al. (2004a) Sobolewska, M. A., Siemiginowska, A., Zycki, P. T. 2004a, ApJ, 617, 102
- Sobolewska et al. (2004b) Sobolewska, M. A., Siemiginowska, A., Zycki, P. T. 2004b, ApJ, 608, 802
- Steed Weinberg (2003) Steed, A., Weinberg, D. H. 2003 preprint, (astro-ph /0311312)
- Storrie-Lombardi et al. (1996) Storrie-Lombardi, L. J., McMahon, R. G., Irwin, M. J., Hazard, C. 1996, ApJ, 468, 121
- Surdej et al. (1987) Surdej J., Swings J. P., Magain P., Courvoisier T. J. L., Borgeest U. 1987, Nature, 329, 695
- Surdej et al. (1988) Surdej J., et al. 1988, A&A, 198, 49
- Tinker et al. (2011) Tinker, J. L., Wetzel, A. R., Zehavi, I. 2011, in preparation
- Tonry (1998) Tonry, J. 1998, AJ, 115, 1
- Tonry Kochanek (1999) Tonry, J. L., Kochanek, C. S. 1999, AJ, 117, 2034
- Treu et al. (2009) Treu, T., Gavazzi, R., Gorecki, A., Marshall, P. J., Koopmans, L. V. E., Bolton, A. S., Moustakas, L. A., Burles, S. 2009, ApJ, 690, 670
- Turner et al. (1984) Turner, E. L., Ostriker, J. P., Gott, J. R., 1984, ApJ, 284, 1
- Udalski et al. (2006) Udalski, A., et al. 2006, A&A, 56, 293
- Walsh et al. (1979) Walsh, D., Carswell, R. F., Weymann, R. J. 1979, Nature, 279, 381
- Wambsganss (2006) Wambsganss, J. 2006, in Saas-Fee Advanced Course 33, Gravitational Lensing: Strong, Weak and Micro, ed. G. Meylan, P. Jetzer, P. North (Berlin: Springer), 453
- Wetzel White (2010) Wetzel, A. R., White, M. 2010, MNRAS, 403, 1072
- Wiklind Combes (1995) Wiklind, T., Combes, F. 1995, A&A, 299, 382
- Wiklind Combes (1996) Wiklind, T., Combes, F. 1996, Nature, 379, 139
- Winn et al. (2000) Winn, J. N., et al. 2000, AJ, 120, 2868
- Winn et al. (2002a) Winn, J. N., et al. 2002a, AJ, 123, 10
- Winn et al. (2002b) Winn, J. N., Lovell, J. E. J., Chen, H., Fletcher, A. B., Hewitt, J. N., Patnaik, A. R., Schechter, P. L. 2002b, ApJ, 564, 143
- Wisotzki et al. (1993) Wisotzki, L., Koehler, T., Kayser, R., Reimers, D. 1993, A&A, 278, 15
- Wisotzki et al. (1995) Wisotzki, L., Koehler, T., Ikonomou, M., Reimers, D. 1995, A&A, 297, 59
- Wisotzki et al. (1998) Wisotzki, L., Wucknitz, O., Lopez, S., Norup Sorensen, A. 1998, A&A, 339, 73
- Wisotzki et al. (1999) Wisotzki, L., Christlieb, N., Liu, M. C., Maza, J., Morgan, N. D., Schechter, P. L. 1999, A&A, 348, L41
- Wisotzki et al. (2002) Wisotzki, L., Schechter, P. L., Bradt, H. V., Heinmüller, J., Reimers, D. 2002, A&A, 395, 17
- Wisotzki et al. (2004) Wisotzki, L., Schechter, P. L., Chen, H.-W., Richstone, D., Jahnke, K., Sánchez, S. F., Reimers, D. 2004, A&A, 419, 31
- Wucknitz et al. (2003) Wucknitz, O., Wisotzki, L., Lopez, S., Gregg, M. D. 2003, A&A, 405, 445
- Wyithe et al. (2000) Wyithe, J. S. B., Webster, R. L., Turner, E. L. 2000, MNRAS, 318, 762
- Wyithe et al. (2002) Wyithe, J. S. B., Agol, E., Fluke, C. J. 2002, MNRAS, 331, 1041
- Young et al. (1980) Young, P., Gunn, J. E., Kristian, J., Oke, J. B., Westphal, J. A. 1980, ApJ, 241, 507


| Lens |
(1) Auger et al. (2008); (2) Bahcall et al. (1992); (3) Biggs et al. (2003); (4) Bolton et al. (2006); (5) Burud et al. (1998); (6) Carilli et al. (1993); (7) Chavushyan et al. (1997); (8) Christian et al. (1987); (9) Claeskens et al. (1996); (10) Cox et al. (2002); (11) Eigenbrod et al. (2006a); (12) Eigenbrod et al. (2006b); (13) Eigenbrod et al. (2007); (14) Fassnacht et al. (1999); (15) Fassnacht Cohen (1998); (16) Faure et al. (2009); (17) Gregg et al. (2000); (18) Hagen Reimers (2000); (19) Hall et al. (2002); (20) Henry Heasley (1986); (21) Hewett et al. (1994); (22) Huchra et al. (1985); (23) Inada et al. (2003a); (24) Inada et al. (2003b); (25) Inada et al. (2005); (26) Inada et al. (2006a); (27) Inada et al. (2006b); (28) Inada et al. (2007); (29) Inada et al. (2009); (30) Irwin et al. (1998); (31) Jackson et al. (2008); (32) Jackson et al. (2009); (33) Johnston et al. (2003); (34) Kanekar Briggs (2003); (35) Kayo et al. (2007); (36) Kayo et al. (2010); (37) Kneib et al. (2000); (38) Kochanek et al. (2000); (39) Kondo et al. (2006); (40) Koopmans Treu (2002); (41) Lacy et al. (2002); (42) Lawrence et al. (1984); (43) Lidman et al. (1999); (44) Lidman et al. (2000); (45) Lubin et al. (2000); (46) Magain et al. (1988); (47) McKean et al. (2004); (48) McGreer et al. (2010); (49) McMahon Irwin (1992); (50) Morgan et al. (2001); (51) Morgan et al. (2003a); (52) Morgan et al. (2003b); (53) Morgan et al. (2004); (54) Morgan et al. (2005); (55) Morokuma et al. (2007); (56) Muñoz et al. (2001); (57) Myers et al. (1999); (58) O’Dea et al. (1992); (59) Ofek et al. (2006); (60) Ofek et al. (2007); (61) Oguri et al. (2004a); (62) Oguri et al. (2004b); (63) Oguri et al. (2005); (64) Oguri et al. (2008a); (65) Oguri et al. (2008b); (66) Patnaik et al. (1992); (67) Pindor et al. (2004); (68) Pindor et al. (2006); (69) Reimers et al. (2002); (70) Rusin et al. (2000); (71) Schechter et al. (1998); (72) Siemiginowska et al. (1998); (73) Sluse et al. (2003); (74) Smette et al. (1992); (75) Storrie-Lombardi et al. (1996); (76) Surdej et al. (1987); (77) Surdej et al. (1988); (78) Tonry (1998); (79) Tonry Kochanek (1999); (80) Walsh et al. (1979); (81) Wiklind Combes (1995); (82) Wiklind Combes (1996); (83) Winn et al. (2000); (84) Winn et al. (2002a); (85) Winn et al. (2002b); (86) Wisotzki et al. (1993); (87) Wisotzki et al. (1998); (88) Wisotzki et al. (1999); (89) Wisotzki et al. (2002); (90) Wisotzki et al. (2004); (91) Young et al. (1980); Notes: † Lensing by a group or cluster of galaxies a-Peng et al. (2006) b-Assef et al. (2010) ( ) based on the FP method based on the FJ relation { } based on color measurments ∗ ∗ based on spectrum features ∗ based on the absorption line spectrum, but not completely identified “ ” estimated from the image separation and probability distriburion Ofek et al. (2003) |
Line | Ref | |||||||||
|---|---|---|---|---|---|---|---|---|---|---|---|---|
| ( cm) | ( cm) | ( cm) | (years) | (years) | () | |||||||
| HE00471756 | 1.66 | 0.41 | 16.52 | 3.12 | 1.25 | 1.46 | 18.45 | 0.74 | 0.040 | 1.38 | (CIV,a) | 59, 90 |
| PMNJ01340931 | 2.22 | 0.77 | 18.96 | 2.29 | 0.09 | 0.12 | 31.05 | 0.13 | 0.004 | - | - | 19, 34, 59, 84 |
| Q0142100 | 2.72 | 0.49 | 16.47 | 2.84 | 2.67 | 4.72 | 22.06 | 2.07 | 0.094 | 3.89 | (CIV, b) | 13, 74, 76, 77 |
| QJ01584325 | 1.29 | 0.32 | 17.39 | 3.41 | 1.62 | 1.71 | 17.99 | 0.86 | 0.048 | - | - | 16 |
| B0218357 | 0.96 | 0.68 | 19.28 | 1.54 | 0.30 | 0.28 | 20.30 | 0.40 | 0.019 | - | - | 6, 81, 58 |
| HE02302130† | 2.16 | 0.53 | 18.00 | 2.78 | 0.55 | 0.76 | 21.60 | 0.43 | 0.020 | - | - | 59, 88 |
| SDSS02460825 | 1.69 | 0.72 | 16.97 | 2.24 | 1.17 | 1.36 | 24.36 | 1.27 | 0.052 | 0.17 | (CIV, b) | 13, 25 |
| MG0414+0534 | 2.64 | 0.96 | 19.62 | 2.04 | 0.19 | 0.30 | 23.94 | 0.22 | 0.009 | 1.82 | (H, a) | 79 |
| HE04351223 | 1.69 | 0.46 | 16.84 | 2.94 | 0.76 | 0.88 | 18.30 | 0.47 | 0.026 | 0.50 | (CIV, a) | 59, 54, 89 |
| HE05123329 | 1.57 | (0.93) | 16.27 | 1.76 | 1.81 | 2.07 | 25.10 | 2.58 | 0.103 | - | - | 17 |
| B0712472† | 1.34 | 0.41 | 22.42 | 2.97 | 0.05 | 0.05 | 19.02 | 0.03 | 0.002 | 0.07 | (MgII, a) | 15 |
| SDSSJ07464403 | 2.00 | 0.51 | 18.34 | 2.82 | 0.63 | 0.74 | 23.39 | 0.52 | 0.022 | - | - | 28, 36 |
| SDSSJ08062006 | 1.54 | 0.54 | 18.88 | 2.64 | 0.84 | 0.93 | 22.06 | 0.70 | 0.032 | 0. | - | 13, 26 |
| HS08102554 | 1.50 | “0.89” | 15.03 | 1.97 | 0.98 | 1.07 | 23.64 | 1.17 | 0.050 | 0.11 | (CIV, a) | 69 |
| HS08181227 | 3.11 | 0.39 | 18.54 | 3.07 | 0.69 | 1.27 | 18.91 | 0.42 | 0.023 | - | - | 18 |
| SDSSJ08195356 | 2.24 | 0.29 | 18.51 | 3.70 | 0.53 | 0.75 | 14.00 | 0.20 | 0.014 | - | - | 29 |
| SDSSJ08200812 | 2.02 | 0.80 | 19.05 | 2.20 | 0.88 | 1.08 | 22.16 | 0.89 | 0.040 | - | - | 32 |
| APM082795255 | 3.87 | 1.06 | 14.55 | 1.88 | 0.99 | 2.15 | 39.91 | 2.11 | 0.053 | - | - | 30, 39 |
| SDSSJ08320404 | 1.12 | 0.66 | 18.89 | 1.90 | 0.99 | 0.98 | 15.82 | 0.83 | 0.052 | - | - | 64 |
| B0850054 | 1.14/3.93 | 0.59 | 23.15 | 2.14 | 0.12 | 0.11 | 25.61 | 0.15 | 0.006 | - | - | 3, 47 |
| SDSSJ09035028 | 3.61 | 0.39 | 18.51 | 2.95 | 0.95 | 1.95 | 18.00 | 0.58 | 0.032 | - | - | 33 |
| SDSSJ09041512 | 1.83 | [0.19]{0.54} | 17.51 | 2.72 | 1.29 | 1.50 | 25.03 | 1.19 | 0.047 | - | - | 36 |
| RXJ09110551† | 2.80 | 0.77 | 17.39 | 2.29 | 0.59 | 1.00 | 24.78 | 0.64 | 0.026 | 0.80 | (CIV, a) | 5, 37 |
| SBS0909523 | 1.38 | 0.83 | 15.65 | 1.79 | 4.46 | 5.01 | 20.17 | 5.02 | 0.249 | 1.95 | (H,b) | 45 |
| SDSSJ09240219 | 1.52 | 0.39 | 18.18 | 3.16 | 0.61 | 0.66 | 20.39 | 0.39 | 0.019 | 0.11 | (MgII, a) | 11, 23, 59 |
| SDSSJ09461835 | 4.80 | 0.38 | 18.74 | 2.65 | 0.82 | 2.09 | 19.80 | 0.61 | 0.031 | - | - | 48 |
| FBQ09512635 | 1.24 | 0.26 | 16.39 | 3.92 | 3.93 | 4.23 | 17.37 | 1.74 | 0.100 | 0.89 | (MgII, a) | 13, 71 |
| BRI09520115 | 4.50 | 0.63 | 18.27 | 2.23 | 0.65 | 1.52 | 32.77 | 0.95 | 0.029 | 1.39 | (CIV, a) | 13, 49, 75 |
| Q0957561† | 1.41 | 0.36 | 15.99 | 3.25 | 3.12 | 3.48 | 12.39 | 1.19 | 0.096 | 2.01 | (CIV, a) | 80, 91 |
| SDSSJ10015027† | 1.84 | “0.87” | 17.31 | 3.08 | 1.61 | 1.86 | 17.88 | 0.93 | 0.052 | - | - | 63 |
| J10041229 | 2.65 | 0.95* | 19.65 | 2.06 | 0.70 | 1.15 | 28.86 | 0.98 | 0.034 | - | - | 41 |
| SDSSJ10044112† | 1.73 | 0.68 | 17.53 | 2.35 | 0.69 | 0.80 | 9.42 | 0.28 | 0.029 | 2.02 | (CIV, a) | 24, 61 |
| SDSSJ10110143 | 2.70 | 0.33 | 22.43 | 3.41 | 0.06 | 0.10 | 17.32 | 0.03 | 0.002 | - | - | 4 |
| SDSSJ10214913 | 1.72 | “0.94” | 18.97 | 2.06 | 0.74 | 0.86 | 24.63 | 0.89 | 0.036 | - | - | 68 |
| LBQS10090252 | 2.74 | 0.87 | 17.80 | 2.16 | 1.49 | 2.59 | 29.45 | 2.04 | 0.069 | 1.64 | (CIV, a) | 21, 59 |
| Q1017207 | 2.55 | (0.78) | 16.78 | 2.28 | 2.00 | 3.33 | 32.76 | 2.87 | 0.088 | 1.68 | (CIV, a) | 9, 38 |
| SDSSJ10292623† | 2.20 | 0.55 | 18.55 | 2.73 | 0.45 | 0.62 | 8.98 | 0.15 | 0.016 | - | - | 27 |
| B1030074 | 1.54 | 0.60 | 19.41 | 2.46 | 0.83 | 0.91 | 22.51 | 0.76 | 0.034 | 0.35 | (MgII, a) | 15 |
| SDSSJ10542733 | 1.45 | [0.23] | 16.81 | 4.13 | 1.31 | 1.44 | 17.22 | 0.55 | 0.032 | - | - | 36 |
| SDSSJ10554628 | 1.25 | [0.39]{0.38} | 18.76 | 3.04 | 1.02 | 1.05 | 19.87 | 0.67 | 0.033 | - | - | 36 |
| HE11041805 | 2.32 | 0.73 | 16.17 | 2.36 | 2.43 | 3.75 | 21.66 | 2.23 | 0.103 | 2.37 | (CIV, a) | 44, 86 |
| PG1115080† | 1.72 | 0.31 | 15.62 | 3.62 | 1.19 | 1.41 | 18.43 | 0.61 | 0.033 | 0.92 | (CIV, a) | 20, 8, 78 |
| RXJ11311231 | 0.66 | 0.29 | 16.74 | 2.50 | 0.64 | 0.45 | 11.13 | 0.28 | 0.026 | 0.06 | (H, a) | 73 |
| SDSSJ11311915 | 2.92 | [0.32] | 18.00 | 3.41 | 0.78 | 1.38 | 21.40 | 0.49 | 0.023 | - | - | 36 |
| SDSSJ11380314 | 2.44 | 0.45 | 18.43 | 3.00 | 0.44 | 0.67 | 25.74 | 0.38 | 0.015 | 0.05 | (CIV, b) | 12 |
| SDSSJ11556346 | 2.89 | 0.18 | 17.67 | 4.49 | 1.88 | 3.42 | 12.75 | 0.53 | 0.042 | - | - | 67 |
| B1152200 | 1.02 | 0.44 | 16.53 | 2.52 | 2.72 | 2.74 | 18.43 | 1.99 | 0.108 | - | - | 57 |
| SDSSJ12064332† | 1.79 | “0.85” | 18.47 | 3.11 | 0.71 | 0.82 | 17.83 | 0.40 | 0.023 | - | - | 63 |
| Q1208101 | 3.80 | “1.33”, 1.14* | 16.96 | 1.27 | 1.84 | 4.04 | 43.54 | 6.33 | 0.145 | - | - | 2, 72 |
| SDSSJ12163529 | 2.01 | [0.55] | 19.08 | 2.72 | 0.56 | 0.67 | 23.83 | 0.49 | 0.021 | - | - | 64 |
| SDSSJ12260006 | 1.12 | 0.52 | 18.30 | 2.35 | 0.86 | 0.85 | 20.60 | 0.76 | 0.037 | 0.68 | (MgII, a) | 12 |
| SDSSJ12512935 | 0.80 | 0.41 | 18.85 | 2.24 | 0.30 | 0.26 | 15.12 | 0.20 | 0.013 | - | - | 35 |
| SDSSJ12542235 | 3.63 | {0.2} | 19.19 | 3.96 | 0.46 | 0.93 | 16.01 | 0.19 | 0.012 | - | - | 29 |
| SDSSJ12581657 | 2.70 | [0.4] | 18.74 | 3.12 | 1.04 | 1.78 | 23.45 | 0.78 | 0.033 | - | - | 29 |
| SDSSJ13042001 | 2.18 | [0.32]{0.46} | 18.45 | 2.99 | 0.77 | 1.07 | 22.03 | 0.57 | 0.026 | - | - | 36 |
| SDSSJ13135151 | 1.88 | 0.19 | 17.72 | 4.56 | 1.80 | 2.05 | 14.37 | 0.57 | 0.039 | - | - | 60 |
| SDSSJ13221052 | 1.72 | “0.88”[0.55] | 18.24 | 2.64 | 0.90 | 1.05 | 21.58 | 0.74 | 0.034 | - | - | 64 |
| SDSSJ13301810† | 1.40 | 0.37 | 18.34 | 3.17 | 0.49 | 0.50 | 19.02 | 0.29 | 0.015 | - | - | 65 |
| SDSSJ13320347 | 1.45 | 0.19 | 18.70 | 4.53 | 0.97 | 1.05 | 16.03 | 0.34 | 0.021 | - | - | 55 |
| LBQS13330113 | 1.57 | 0.44 | 17.26 | 2.97 | 1.84 | 2.10 | 21.19 | 1.31 | 0.062 | 1.55 | (MgII, a) | 12, 62 |
| SDSSJ13391310 | 2.24 | [0.4] | 18.71 | 3.19 | 0.80 | 1.16 | 21.29 | 0.54 | 0.025 | - | - | 29 |
| SDSSJ13491227 | 1.72 | [0.63]{0.66} | 17.44 | 2.39 | 2.48 | 3.02 | 18.97 | 1.97 | 0.104 | - | - | 36 |
| SDSSJ13531138 | 1.63 | 0.3* | 16.48 | 3.66 | 2.80 | 3.33 | 18.62 | 1.43 | 0.077 | - | - | 26 |
| Q13552257 | 1.37 | 0.48* | 16.94 | 2.92 | 2.18 | 2.67 | 23.94 | 1.79 | 0.075 | - | - | 51, 59 |
| B1359+154† | 3.24 | “0.9” | 22.62 | 2.09 | 0.05 | 0.09 | 28.85 | 0.07 | 0.002 | - | - | 57, 70 |
| SDSSJ14003134 | 3.32 | {0.8} | 19.92 | 2.20 | 0.43 | 0.80 | 27.64 | 0.53 | 0.019 | - | - | 29 |
| SDSSJ14066126 | 2.13 | 0.27 | 18.88 | 3.87 | 0.78 | 1.06 | 15.55 | 0.31 | 0.020 | - | - | 28 |
| H1413117† | 2.55 | “0.94” | 16.44 | 2.07 | 1.05 | 1.71 | 28.62 | 1.46 | 0.051 | 0.26 | (CIV, a) | 46 |
| B1422231† | 3.62 | 0.34 | 14.81 | 3.12 | 2.29 | 4.88 | 19.39 | 1.42 | 0.073 | 4.79 | (CIV, a) | 66, 78 |
| SDSSJ14551447 | 1.42 | [0.27]{0.53} | 18.22 | 2.59 | 0.69 | 0.73 | 20.16 | 0.53 | 0.027 | - | - | 36 |
| SBS1520530† | 1.86 | 0.72* | 17.61 | 2.31 | 1.77 | 2.02 | 23.09 | 1.77 | 0.077 | 0.88 | (CIV, a) | 1, 7 |
| SDSSJ15244409 | 1.21 | 0.32 | 18.76 | 3.33 | 0.69 | 0.69 | 16.54 | 0.34 | 0.021 | - | - | 64 |
| B1600434† | 1.59 | 0.41 | 20.87 | 3.10 | 0.34 | 0.37 | 19.61 | 0.22 | 0.011 | 0.10 | (MgII, a) | 15 |
| SDSSJ16201203 | 1.16 | 0.40 | 19.10 | 2.87 | 0.95 | 0.95 | 15.47 | 0.51 | 0.033 | - | - | 36 |
| PMNJ16320033 | 3.42 | 1.16* | 20.68 | 1.83 | 0.47 | 0.91 | 31.08 | 0.80 | 0.026 | 0.39 | (CIV, a) | 59, 85 |
| FBQ16333134 | 1.52 | 0.68* | 16.59 | 2.24 | 2.82 | 3.23 | 25.01 | 3.14 | 0.126 | 1.76 | (CIV, a) | 50 |
| SDSSJ16504251 | 1.54 | 0.58* | 16.98 | 2.51 | 1.81 | 2.06 | 22.23 | 1.60 | 0.072 | - | - | 52 |
| PKS1830211 | 2.51 | 0.89 | 22.27 | 2.13 | 0.12 | 0.17 | 29.52 | 0.16 | 0.006 | - | - | 43, 82 |
| PMNJ18383427 | 2.78 | [0.36] | 19.10 | 3.26 | 1.28 | 2.23 | 20.19 | 0.79 | 0.039 | - | - | 83 |
| MG2016112† | 3.27 | 1.01 | 21.51 | 1.97 | 0.17 | 0.30 | 23.37 | 0.20 | 0.009 | - | - | 40, 42 |
| WFI20264536 | 2.23 | “1.04” | 16.18 | 2.13 | 1.12 | 1.62 | 26.60 | 1.40 | 0.053 | - | - | 53 |
| WFI20334723 | 1.66 | 0.66 | 17.59 | 2.37 | 0.71 | 0.81 | 19.86 | 0.60 | 0.030 | - | - | 53, 59 |
| B2045265† | 1.28 | 0.87 | 22.02 | 1.57 | 0.02 | 0.02 | 12.61 | 0.02 | 0.001 | 0.01 | (MgII, a) | 14 |
| HE21492745† | 2.03 | 0.60 | 16.29 | 2.86 | 3.08 | 3.99 | 22.81 | 2.45 | 0.108 | 6.62 | (CIV, a) | 13, 87 |
| Q2237030 | 1.69 | 0.04 | 15.16 | 9.90 | 2.84 | 3.44 | 8.11 | 0.23 | 0.027 | 0.47 | (CIV, b) | 22 |
| PSS23221944 | 4.12 | “1.23” | 17.92 | 1.81 | 0.88 | 1.93 | 35.08 | 1.70 | 0.049 | 2.36 | lower limit, a | 10 |
| SDSSJ23430050† | 0.79 | 0.30** | 20.10 | 2.82 | 0.42 | 0.36 | 16.66 | 0.25 | 0.015 | - | - | 31 |
| -bin | ||
|---|---|---|
| 0.32 | 2.43 | |
| 2.48 | ||
| 2.45 | ||
| 2.47 | ||
| 2.60 |