11email: beckmann@apc.univ-paris7.fr 22institutetext: Université de Toulouse, UPS-OMP, IRAP, Toulouse, France 33institutetext: CNRS, IRAP, 9 Avenue du Colonel Roche, B.P. 44346, 31028 Toulouse Cedex 4, France 44institutetext: Centrum Astronomiczne im. M. Kopernika, Rabiańska 8, PL-87-100 Toruń, Poland 55institutetext: Laboratoire AIM - CNRS - CEA/DSM - Université Paris Diderot (UMR 7158), CEA Saclay, DSM/IRFU/SAp, 91191 Gif-sur-Yvette, France
The hard X-ray emission of Cen A††thanks: Based on observations with INTEGRAL, an ESA project with instruments and science data centre funded by ESA member states (especially the PI countries: Denmark, France, Germany, Italy, Switzerland and Spain), the Czech Republic, and Poland and with participation of Russia and the US.
Abstract
Context. The radio galaxy Cen A has been detected all the way up to the TeV energy range. This raises the question about the dominant emission mechanisms in the high-energy domain.
Aims. Spectral analysis allows us to put constraints on the possible emission processes. Here we study the hard X-ray emission, in order to distinguish between a thermal and a non-thermal inverse Compton process.
Methods. Using hard X-ray data provided by INTEGRAL, we determined the cut-off of the power-law spectrum in the hard X-ray domain (3 – 1000 keV). In addition, INTEGRAL data are used to study the spectral variability. The extended emission detected in the gamma-rays by Fermi/LAT is investigated using the data of the spectrometre SPI in the 40 – 1000 keV range.
Results. The hard X-ray spectrum of Cen A shows a significant cut-off at energies keV with an underlying power-law of photon index . A more physical model of thermal Comptonisation (compPS) gives a plasma temperature of 206 within the optically thin corona with Compton parameter . The reflection component is significant at the level with , and a reflection strength can be excluded on a level. Time resolved spectral studies show that the flux, absorption, and spectral slope varied in the range , , and . Extending the cut-off power-law or the Comptonisation model to the gamma-ray range shows that they cannot account for the high-energy emission. On the other hand, a broken or curved power-law model can also represent the data, therefore a non-thermal origin of the X-ray to GeV emission cannot be ruled out. The analysis of the SPI data provides no sign of significant emission from the radio lobes and gives a upper limit of .
Conclusions. While gamma-rays, as detected by CGRO and Fermi, are caused by non-thermal (jet) processes, the main process in the hard X-ray emission of Cen A is still not unambiguously determined, since it is either dominated by thermal inverse Compton emission or by non-thermal emission from the base of the jet.
Key Words.:
Galaxies: active – Galaxies: Seyfert – Galaxies: individual: Cen A – X-rays: galaxies1 Introduction
The radio galaxy Centaurus A (NGC 5128) is probably the best-studied active galactic nucleus (AGN). With a redshift of and with a distance of (Harris et al., 2010) the object is the brightest AGN at hard X-rays with (Beckmann et al., 2009). For a review on Cen A, see Israel (1998). Owing to its brightness, Cen A has been a target for all main X-ray missions throughout the years, starting from the first detection during a balloon flight in 1969 (Bowyer et al., 1970). Early hard X-ray observations by Ginga and balloon-borne detectors indicated a power-law slope of and a possible break at (Miyazaki et al., 1996), and a break was also detected in the spectrum taken by HEAO-1 at (Baity et al., 1981). The Compton Gamma-Ray Observatory’s (CGRO; Gehrels et al. 1993) OSSE and COMPTEL instruments derived a more complex structure with a two-fold broken power-law, with breaks at and at (Steinle et al., 1998). In contrast, CGRO/BATSE observations failed to find a break in the spectrum (Wheaton et al., 1996; Ling et al., 2000). Also more recent RXTE and INTEGRAL observations show an absorbed unbroken power-law with photon index and an intrinsic hydrogen column density of (Rothschild et al., 2006, 2011). Nevertheless, Cen A shows a steeper spectral slope in the MeV range (, Collmar et al. 1999) than in the hard X-rays (), thus a turnover has to occur somewhere between 100 keV and a few MeV (Steinle, 2010). The source was also the only non-blazar AGN detected by CGRO/EGRET (Hartman et al., 1999), again showing a steepening of the spectrum with (Sreekumar et al., 1999), consistent with the recent observations by Fermi/LAT (, Abdo et al. 2010a) and extending up to the TeV range as seen by the HESS experiment (, Aharonian et al. 2009). Fermi/LAT observations also discovered extented gamma-ray emission that coincides with the radio lobes of this FR-I galaxy (Abdo et al., 2010b).
The multi-year database of the INTEGRAL mission (Winkler et al., 2003) allows us now to search the hard X-ray spectrum of Cen A for the expected turnover. In addition, we can test whether the emission model applicable for the X-ray domain can also explain the emission at gamma-rays. We derived an upper limit on the hard X-ray emission from the radio lobes with INTEGRAL/SPI data and verified whether these values are consistent with the predictions based on the Fermi/LAT data.
2 Data analysis
In this study we use all INTEGRAL data on Cen A taken between March 3, 2003 and February 21, 2009, i.e. all observations dedicated to this radio galaxy. We used data of the imager IBIS/ISGRI (Lebrun et al., 2003) in the 20–1000 keV band, IBIS/PICsIT (Labanti et al., 2003) data at , and those of the spectrometre SPI (Vedrenne et al., 2003) between 40 keV and 1850 keV. The two JEM-X monitors (Lund et al., 2003) provide spectral information in the 3 – 30 keV band. We selected the data up to an off-axis angle of for IBIS/ISGRI and SPI, and within for JEM-X. Data reduction was performed using the Offline Scientific Analysis (OSA) package version 9.0 provided by the ISDC (Courvoisier et al., 2003). The PICsIT data analysis followed the procedure described in Lubiński (2009). The different instruments were not always switched on simultaneously. This is mainly because the two JEM-X monitors are operated one at a time in order to spare the instrument and for telemetry constraints. In addition, the SPI spectrometre undergoes periods of annealing to repair the crystal structure of the GeD detectors, so was not available during all observations. The effective exposure times are therefore different, with 145 ks for JEM-X1, 96 ks JEM-X2, 1,425 ks IBIS/ISGRI, IBIS/PICsIT, and 1,858 ks for SPI.
Errors quoted in this work are at the 90% confidence level, corresponding to .
3 The hard X-ray spectrum
The fitting and modelling of the X-ray spectra were performed using XSPEC version 12.5.1 (Arnaud, 1996). Only the data of JEM-X are significantly influenced by the intrinsic absorption, whereas for IBIS/ISGRI and SPI the absorption value was fixed to the average value of (e.g. Grandi et al. 2003, Benlloch et al. 2001). An estimate of the turnover in the spectrum of Cen A can already be achieved by analysing the IBIS/ISGRI data alone. A simple absorbed power-law model with gives a reduced chi-square of for 31 degrees of freedom. Adding a high-energy cutoff improves the fit to (30 d.o.f.). The best-fitting values are a photon index of and cut-off energy of . Another phenomenological model that includes a steepening of the spectrum is the broken power-law. The fit result is only slightly worse than the cut-off power-law with (28 d.o.f.). The low-energy photon index of this model is with a break energy of and a high-energy slope of .
Cen A is known to maintain its spectral shape under flux variations (e.g. Rothschild et al. 2006, and this work Section 4). We therefore added all INTEGRAL spectra together, i.e. JEM-X1, JEM-X2, SPI, IBIS/PICsIT, and IBIS/ISGRI. Also here, a simple absorbed power-law () does not provide a good representation of the data (, 104 d.o.f.). The absorbed cut-off power-law model gives (103 d.o.f.) with a photon index of and . The spectral shape and the cut-off energy are not independent variables. This can be seen in the contour plot of and as shown in Fig. 1. A flatter spectrum is compensated for in the fit by a lower cut-off energy. Nevertheless, a cut-off energy below 300 keV and above 700 keV can be ruled out at a 99.7% confidence level. The spectral slope is better constrained by the data spanning 3 – 1000 keV. Even when considering different cut-off energies, the range for the photon index is . The broken power-law fit gives an equally good representation of the data with (102 d.o.f.). The turnover appears at an energy of , with a spectral slope of and below and above the break, respectively.

The cut-off power-law and the broken power-law model are phenomenological descriptions of the spectrum. A physical model should include the processes of thermal Comptonisation. Here we apply the compPS model (Poutanen & Svensson, 1996). We assume that the plasma of temperature forms an infinite slab on top of the accretion disk, with the plasma having an optical depth . Since and are intrinsically strongly anticorrelated, we fit the Compton parameter (with the electron mass) instead of the optical depth. The temperature of the seed photons is not well constrained by the hard X-ray spectrum used here, thus we assume a multicolour disk with a fixed inner temperature . The fit to the INTEGRAL data results in a reduced chi-squared of for 101 d.o.f.
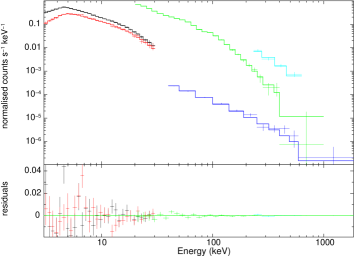
Figure 2 shows the count spectrum of Cen A along with the fit residuals. It is worth noting that the iron K fluorescence line at is only visible in the JEM-X2 spectrum. Analysing the JEM-X spectra individually confirms this observation. The JEM-X1 spectrum gives a upper limit of , corresponding to an equivalent width of . For the JEM-X2 data set, the same analysis gives , corresponding to an equivalent width of . This is consistent with measurements taken by RXTE over 12.5 years, which show equivalent widths in the range (Rothschild et al., 2011).
| model | or | y | R | (d.o.f.) | |
| [keV] | |||||
| power | – | – | – | 1.83 (104) | |
| cut-off | – | – | 1.06 (103) | ||
| bkn po | – | – | 1.06 (102) | ||
| pexrav | – | 1.07 (102) | |||
| compPS | – | 1.02 (101) |
The compPS model gives an electron plasma temperature of , and a Compton parameter corresponding to an optical depth of . In this fit, we had to let the plasma temperature of the PICsIT spectrum to be independent from the other instruments, as the PICsIT spectrum appears slightly harder. For the PICsIT spectrum this results in a temperature as high as , which cannot be constrained by the fit. Similar to the tight connection between the cut-off energy and the underlying spectral slope in the case of the cut-off power-law model, in the compPS model the plasma temperature and the Compton parameter are linked to each other. Figure 3 shows the contour plot for versus with 68%, 90%, and 99.7% confidence levels. Considering all combinations, the plasma temperature range is very wide () with a Compton parameter corresponding to a range of optical depth .

The reflection strength is , inconsistent with there being no reflection at the level. Also the reflection strength is linked to the Compton parameter . The contour plot in Fig. 4 shows the connection between and . While the possibility that no significant reflection is detectable in Cen A cannot be excluded, the upper limit of considering all combinations of and is a strong constraint. In the course of the studies of NGC 4151 (Lubiński et al., 2010) we investigated the influence of cross-calibration issues on the strength of the detected reflection component. Comparison between reflection values derived from combined XMM-Newton and RXTE data versus INTEGRAL spectra showed no significant difference. In the case of Cen A the spectrum is also not as strongly impacted by absorption as NGC 4151. Problems in earlier versions of the OSA software, where JEM-X spectra would drop to energies above 10 keV, are also not apparent in the spectrum as shown in Fig. 2. Thus, we do not expect cross-calibration to cause an artificially enhanced reflection component.

The average model flux in the X-rays as detectable by INTEGRAL is , and thus Cen A displays a luminosity of .
For comparison we applied the simpler pexrav model, which describes an exponentially cut-off power-law spectrum reflected from neutral material, with the output spectrum being the sum of the cut-off power-law and the reflection component (Magdziarz & Zdziarski, 1995). In this case the best-fit results ( for 102 d.o.f.) are a photon index of , cut-off energy , and relative reflection of , consistent with no reflection component. Thus, the pexrav model does not require a reflection component at all, with a upper limit of , close to the value derived from the compPS model fit. It should be taken into account that the results of these two models are expected to differ slightly. The model compPS takes into account Comptonisation of the reflected component, whereas pexrav assumes that there is no reprocessing in the plasma region.
All the fit results concerning the combined INTEGRAL spectrum are summarised in Table 1. The number of fitted parameters for each model is (absorbed power-law model, power), (absorbed cut-off power-law, cut-off), (absorbed broken power-law, bkn po), (absorbed Comptonisation model, pexrav), and (absorbed Comptonisation model, compPS).
4 Time resolved spectroscopy
As pointed out before, the INTEGRAL data analysed in the overall spectrum are not simultaneous. Therefore, uncertainty about the normalisation might influence the results. To test whether the spectrum indeed maintains its shape under flux variations, we analysed combined JEM-X and ISGRI data that were truly simultaneous. We grouped data together into 12 simultaneous JEM-X and ISGRI spectra with approximately 20 ks each. We applied a simple absorbed power-law model to the combined data, using the same normalisation for JEM-X and ISGRI. The photon indices were in the range with the average value of . Nine of the values are consistent with the average value on the level, the remaining three photon indices on the level. When fixing the photon index to the average value during the fit, all fits still give reasonable fit results (, with an average ). The intrinsic absorption shows significant variations in the range with an average value of . It has to be taken into account, though, that these variations do not influence the spectrum above a few keV and thus should not change the results on the reflection component and/or cut-off of the hard X-ray spectrum. No significant correlation is found between the X-ray flux and the hydrogen column density.
We then also tested the spectral and flux variability using the single science window JEM-X spectra, which last about half an hour each. The results were similar to those in the combined JEM-X and ISGRI spectral timing analysis but with a larger scatter. The photon indices were in the range with the average value of when fixing the intrinsic absorption to . For a fixed photon index of , the absorption was in the range with an average of . If both parameters were left free to vary, the result was and . Also here, no correlation can be detected between flux and intrinsic absorption.
5 Extended emission
As for a radio galaxy, Cen A (RA , DEC= ) is known to have radio lobes extending out from the core by about 300 kpc. These lobes are located in the north at RA, DEC and in the south at RA = , DEC = . Recently, Fermi/LAT detected emission from positions consistent with these lobes at significance levels of (1FGL J1333.4–4036) and (1FGL J1322.0–4545) for the northern and southern lobes, respectively (Abdo et al., 2010b). Here we used the data of the spectrometre SPI to test for emission of the lobes at hardest X-rays. Because of its wide field of view and a resolution of , SPI is able to map large-scale structures on the hard X-ray background. The spectra of the radio lobes and Cen A were extracted by model fitting, assuming that the sky intensity distribution consist of these three point sources, at the positions mentioned above. We performed the analysis in 10 keV wide energy bins, covering the 40–1850 keV range. Each energy bin is adjusted to the data for each germanium detector separately, assuming that the count rate is due to the sum of the sky contributions and the instrumental background. The latter is assumed to be proportional to the rate of saturating events in germanium detectors (Jean et al., 2003). The spectra were rebinned in logarithmic spaced energy bins for the spectral analysis presented in Section 3.
The analysis of the SPI data shows no sign of significant emission from the radio lobes in the south ( upper limit ) and in the north with for a non-significant signal on the level.
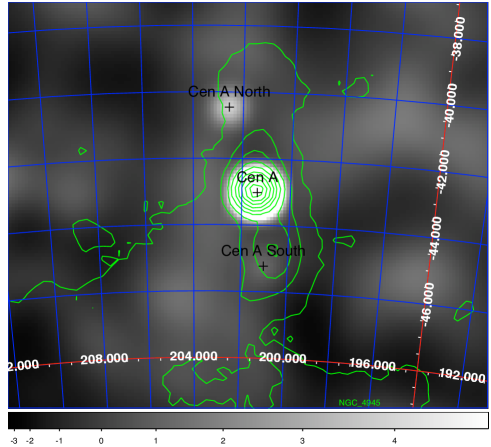
We investigated the excess in the north of Cen A further by fitting a source model in various energy bands to the northern lobe in which position, extension, and orientation angle of a two-dimensional assymmetric Gaussian were left free to vary. In this case we find a excess of ( error) at RA = , DEC = . The signal is too low to claim a significant detection at this point. Even if we consider this flux to be a reliable measurement, the hard X-ray lobe emission of Cen A can still be lower, as other sources in the field can also contribute, e.g. in the north 1FGL J1307.0–4030 detected by Fermi/LAT, or another so far undetected blazar in the background. Based on the SPI data, it is not yet possible to determine whether the excess we detect is extended or resulting from a point-like source.
If we consider the flux of an upper limit, this value agrees with the expected energy distribution presented by Abdo et al. (2010b). At an energy of 300 keV, they expect a contribution to the SED of in the case of the southern lobe, whereas the upper limit based on the SPI data corresponds to . For the northern lobe, the emission expected from the Fermi/LAT extrapolation is even lower. Therefore, unless about five times more SPI data will be accumulated on Cen A, the lobes will most likely escape detection at hardest X-rays.
6 Discussion
In the first approximation, the average Cen A spectrum in the 3 – 1000 keV band as measured by INTEGRAL can be represented by an absorbed simple power-law model with and intrinsic absorption in the range , although the fit has a bad quality. The spectral slope is consistent with earlier measurements by BeppoSAX and RXTE, giving absorption values of and above 3 keV (Grandi et al., 2003; Benlloch et al., 2001). The slope is slightly flatter than reported from early INTEGRAL measurements with (Soldi et al., 2005), (Beckmann et al., 2006), and (Rothschild et al., 2006). Rothschild et al. (2006) point out that the spectra get flatter with the on-going improvement of the calibration and software of the INTEGRAL mission, i.e. that the discrepancy might have been non-physical. The situation seemed to have been resolved with software versions 7 and higher of OSA: the spectral slope of Cen A in the second INTEGRAL AGN catalogue (Beckmann et al., 2009) using OSA 7 is the same as presented here.
A good fit to the data is achieved by an absorbed cut-off power-law model. Here, for the first time using INTEGRAL data, we have detected a significant cut-off at energies , with photon index . These values are consistent with previous attempts to determine the cut-off using RXTE data, which resulted in lower limits of in the range 400 keV to 1600 keV (Rothschild et al., 2006). A recent study of RXTE data again finds no sign of a cut-off, but puts the lower limit at (Rothschild et al., 2011). Not detecting a cut-off led to the conclusion that the X-ray range in Cen A might be jet-dominated, rather than originating from thermal inverse Compton processes. Support for this scenario was given by the fact that no significant reflection component could be found. In the work presented here we indeed see such a reflection component when applying a Compton reflection model (compPS), although the reflection strength is comparably low (), and inconsistent with no reflection only on the level. The upper limit of indicates that the reflection component, if present in Cen A, has to be weak. The plasma temperature is with a Compton parameter . It has to be pointed out, though, that these two parameters are closely linked and that the resulting values also depend on the choice of the seed photon temperature. If we assume here an inner disk temperature of instead of , the plasma temperature rises to and the Compton parameter reduces to . On the other hand, measurements of other sources derived values between 10 eV and 30 eV (Petrucci et al., 2001; Lubiński et al., 2010).
The perfect match of the Comptonisation model to the INTEGRAL data seems to rule out the dominant emission in the X-rays being non-thermal, i.e. also arising from the jet as the gamma-ray emission. We have shown, though, that also a simple broken power-law and a cut-off power-law model represent the data. After extrapolation of the cut-off power-law model, the compPS or the pexrav model into the Fermi/LAT energy range shows that an inverse Compton component dominating the X-rays cannot be responsible for the gamma-ray emission. All these models predict no detectable flux at energies above 100 MeV. On the other hand, the broken power-law model connects to the GeV emission rather smoothly. In Fig. 6 we show the INTEGRAL spectrum, together with the spectrum derived from Fermi/LAT data.
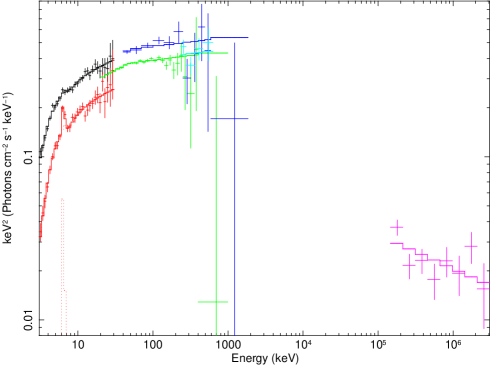
The LAT spectrum was extracted from Fermi data from the early mission in August 2008 until January 2011, applying standard extraction methods and considering the flux contribution by the extended lobes. We derive a photon index of for the energy range 150 MeV to 3 GeV and flux , consistent with earlier results from the Fermi collaboration (, Abdo et al. 2010a. The high-energy spectrum of Cen A seems to have another break in the range 500 keV to 100 MeV. In fact, the combined fit of INTEGRAL and LAT data with an absorbed broken power-law gives a break energy at and photon indices of and , below and above the break, respectively, with a reduced value of (109 d.o.f.). A double broken power-law fit gives a significantly better result. Here, the breaks occur at and , with the three power-law slopes of , , and , for a (107 d.o.f.). An F-test shows that the improvement is highly significant compared to the broken power-law model. As the energy range between 500 keV and 100 MeV is not covered, the second break is not strongly constrained. Under the assumption of non-thermal inverse Compton emission, one would expect a continuous curvature, which the broken power-law model only represents roughly.
In the following we discuss the two options. First we consider the hard X-ray emission to be thermal Comptonisation and thus typical of a Seyfert type galaxy. Then, we investigate the implications when the hard X-rays are dominated by non-thermal emission.
6.1 Cen A as a Seyfert galaxy
If we assume that thermal Comptonisation is the dominant mechanism in the hard X-rays, an additional component, e.g. non-thermal (jet) emission would have to be present in order to explain the gamma-rays. This is well-established (e.g. Johnson et al. 1997, Abdo et al. 2010a). The presence of thermal Comptonisation is also supported by the iron line and the Compton reflection hump, if we consider the detection. Abdo et al. (2010a) have presented already a model considering the combined thermal inverse Compton along with a non-thermal gamma-ray component to explain the X-ray to VHE emission.
The results can be compared to those obtained for other bright Seyfert galaxies with high signal-to-noise, hard X-ray data. NGC~4151 is an object of comparable brightness, distance category (), and spectral type (Seyfert 1.5). Applying the same compPS model with , Lubiński et al. (2010) derive plasma temperatures in the range with Compton parameters and corresponding optical depth while the source is undergoing different flux states. In this context, the values of Cen A we derive here are similar to the dim state in NGC 4151 (, , ), although this state has a much stronger reflection component (). Taking the 3 – 1000 keV X-ray luminosity as a proxy for the bolometric luminosity, under the assumption that the synchrotron branch emits about as much as the inverse Compton branch, gives a bolometric luminosity of . By extracting the 2–10 keV luminosity () and applying the conversion factor for the bolometric luminosity presented by Marconi et al. (2004), we derive a value of . It has to be taken into account that this is assumes that the spectrum in the hard X-rays is based on thermal Compton emission. Considering that there is also a non-thermal component, the value of the bolometric luminosity we give here has to be understood as an upper limit for the thermal accretion luminosity. With a central black hole mass of (Neumayer et al., 2007), this translates into an Eddington ratio around , similar to NGC 4151 with (Lubiński et al., 2010). Based on long-term X-ray measurements by RXTE, Rothschild et al. (2011) derived a lower average luminosity of and thus an Eddington ratio of only . That Cen A is detectable in gamma-rays, while NGC 4151 is not, is the result of the strong jet-component apparent in the former. It also shows that the presence of a jet in Cen A has no strong influence on the central engine, which appears to have similar X-ray characteristics to those in NGC 4151.
Petrucci et al. (2001) used BeppoSAX data of 6 bright Seyfert galaxies to determine their hard X-ray properties, finding plasma temperatures in the range with optical depths and an average reflection strength of . Again, in comparison Cen A appears to represent a rather dim state of a Seyfert, which is accompanied by a higher plasma temperature.
The measured cut-off energy of is, however, consistent with the average cut-off observed in Seyfert 2 galaxies by BeppoSAX. Dadina (2008) find for this AGN type an average of with a photon index of . The reflection strength of is rather low compared to the average of as found by BeppoSAX (Dadina, 2008) and INTEGRAL (Beckmann et al., 2009) for large samples of Seyfert galaxies.
A different picture has been drawn from CGRO/OSSE results. Here, the average cut-off energy of Seyfert 2 appeared at keV with a spectral slope of (Zdziarski et al., 2000). The analysis with the Comptonisation model compPS gave an average temperature of only and a Compton parameter as high as resulting in an optical depth of . This effect of an increasing plasma temperature with decreasing Compton parameter can be seen in Fig. 3, but the OSSE results are significantly different from those obtained by BeppoSAX and INTEGRAL. One reason might be the higher energy band for OSSE, starting at 50 keV, whereas INTEGRAL (3 – 1000 keV) and BeppoSAX (1 – 150 keV) probe a softer energy range. Thus, OSSE data do not constrain the photon index of the spectrum before the high-energy cut-off as strongly as the instruments of BeppoSAX and INTEGRAL do.
When we combine all these results and assume a thermal inverse Compton component, the hard X-ray emission of Cen A could indicate that we observe here a typical Seyfert 2 AGN core, although slightly at the dim end of the distribution, which is connected to a higher plasma temperature, and thus a higher spectral cut-off than observed on average. This in turn would indicate that the non-thermal component apparent in the gamma-rays and detected by CGRO/EGRET and Fermi/LAT has no effect on or direct connection to the inverse Compton component: the hard X-ray spectrum of Cen A does not appear to be significantly different from Seyfert galaxies, which do not show strong jet emission.
6.2 The Cen A core as a FR I with inefficient accretion flow
Cen A shows properties of both a Seyfert 2 galaxy and an FR-I galaxy. In the central regions one observes a jet at a large angle to the line of sight. The jet appears to be relativistic up to a distance of from the core. In addition, the radio core indicates that all elements for a BL Lac type core are observed in Cen A. Thus, the X-ray band could also be dominated by non-thermal emission of a misaligned blazar. There are several observational facts that favour this interpretation. For an absorbed Seyfert core with , the lack of a significant reflection component () and the weak iron line with are certainly unusual. It has to be pointed out, though, that also other bright and well-studied Seyfert galaxies, such as NGC~4593 and NGC~4507, show spectra with no reflection component, and that for several others the reflection strength is detectable only at a level (Lubiński et al., in prep.). If we assume a BL Lac type central engine in Cen A, the X-rays up to the gamma rays would be produced by inverse Compton upscattering in the jet, possibly of synchrotron photons produced in the jet itself via synchrotron self Compton (SSC) processes. As the AGN core has moderate luminosity, accretion in Cen A appears to be radiatively inefficient with an Eddington ratio around . Hardcastle et al. (2007) argue that in these cases almost all the available energy from the accretion process could be channelled into the jets. The dominant accretion mechanism could be Bondi accretion (Bondi, 1952), which is direct infall from the hot, X-ray emitting medium without a disk forming around the core. This would naturally explain the lack of the reflection component in Cen A.
Marchesini et al. (2004) find a dichotomy in radio galaxies with respect to the accretion efficiency. Objects with inefficient accretion () like Cen A, would be dominated by non-thermal emission, while the more efficient accreting FR-II galaxies would have a higher ratio in accretion versus jet power. Balmaverde et al. (2006) have studied the X-ray properties of FR-I galaxies. They show that, when assuming a non-thermal origin for the X-ray cores in FR-I at the base of the jet, only about would be emission related directly to accretion and not be channelled into the jet. Thus, in an FR-I like Cen A the non-thermal component should clearly dominate the Seyfert-type emission at high energies. Allen et al. (2006) come to a similar conclusion by studying X-ray luminous elliptical galaxies, in which Bondi type accretion can account for the observed emission and where most of the accreted matter would enter the jets, giving a close correlation between and .
The hard X-ray to gamma-ray spectrum, such as shown in Steinle et al. (1998) and in this work, is indeed a curved continuum, with a photon index in the X-rays, in the MeV range, and at energies . As described in Abdo et al. (2010a), the entire SED can be modelled by a one-zone SSC model, although the authors show that the combination of a thermal inverse Compton component with a non-thermal jet emission fits the SED equally well.
A difficulty of the non-thermal model is to explain the very persistent and stable emission from the Cen A core. X-ray flux and spectrum vary only slightly, as shown in this work, and stronger variability, both in luminosity and in spectral slope, would be expected from a beamed source. It also has to be pointed out that an SSC model for Cen A can represent the X-ray to GeV spectrum, but fails to explain the TeV emission detected by HESS (Abdo et al., 2010a), so that in this case another model component would also be necessary.
Another possibility is that in Cen A both components, the thermal and the non-thermal inverse Compton component, are observable in the X-ray band. A similar case supposedly exists in 3C 273. According to studies of Beppo/SAX spectra of this blazar by Grandi & Palumbo (2004), the jet component is highly variable, while the underlying Seyfert core component is persistent. This leads to a variable ratio of non-thermal versus thermal emission from the core of 3C 273.
7 Conclusions
The extended emission detected by Fermi/LAT in gamma rays cannot be seen in INTEGRAL/SPI data, with a upper limit of the emission of for the northern and southern lobes. The upper limit is consistent with the expected energy distribution following the analysis of Abdo et al. (2010b).
Using the combined INTEGRAL data the presence of curvature in the hard X-ray to gamma domain is now evident, which can be described by an exponential cut-off or break in the spectrum. It is possible to determine the cut-off energy in Cen A, confirming earlier claims about a turnover based on CGRO data. A non-thermal origin to the hard X-ray emission cannot be ruled out though. A thermal Comptonisation model gives a good representation of the data (). Applying a Comptonisation model, we find an electron plasma with temperature and optical depth (). The Comptonisation model, and the simpler cut-off power-law, cannot explain the emission measured at gamma rays, which has to be due to an additional component, e.g. the jet. On the other hand, interpreting the hard X-ray spectrum as non-thermal (e.g. SSC) emission from the jet would explain the low reflection component we measure () and the relatively weak iron line. In addition, the smooth transition from the X-rays to the MeV and GeV region can indicate that the non-thermal component dominates the whole high-energy range, yet the very stable X-ray spectrum is a challenge for a model based on jet-emission.
From CGRO/COMPTEL observations we know that the transition to the gamma-ray emission is indeed smooth. This means that a thermal Compton component, which would decline rapidly towards higher energies, would have to be compensated for by an increasingly important non-thermal component already at energies of a few MeV, because it is the dominant emission process at . A similar situation could be present in other Fermi/LAT detected sources that are not bona-fide blazars; i.e., the hard X-rays are dominated by thermal Comptonisation, but the non-thermal component sets in the low MeV domain, peaking at some tens of MeV. A Compton telescope like CAPSiTT (Lebrun et al., 2011), covering this energy range (1 MeV ), would be crucial for verifying either of the two scenarios.
Acknowledgements.
We thank the anonymous referee for the comments that helped to improve the paper. This research has made use of the NASA/IPAC Extragalactic Database (NED), which is operated by the Jet Propulsion Laboratory, California Institute of Technology, under contract with the National Aeronautics and Space Administration. We thank Peter Kretschmar for providing the script for the contour plots. PL has been supported by the Polish MNiSW grants NN203065933 and 362/1/N-INTEGRAL (2009-2012).References
- Abdo et al. (2010a) Abdo, A. A., Ackermann, M., Ajello, M., et al. 2010a, ApJ, 719, 1433
- Abdo et al. (2010b) Abdo, A. A., Ackermann, M., Ajello, M., et al. 2010b, Science, 328, 725
- Aharonian et al. (2009) Aharonian, F., Akhperjanian, A. G., Anton, G., et al. 2009, ApJ, 695, L40
- Allen et al. (2006) Allen, S. W., Dunn, R. J. H., Fabian, A. C., Taylor, G. B., & Reynolds, C. S. 2006, MNRAS, 372, 21
- Arnaud (1996) Arnaud, K. A. 1996, in Astronomical Society of the Pacific Conference Series, Vol. 101, Astronomical Data Analysis Software and Systems V, ed. G. H. Jacoby & J. Barnes, 17
- Baity et al. (1981) Baity, W. A., Rothschild, R. E., Lingenfelter, R. E., et al. 1981, ApJ, 244, 429
- Balmaverde et al. (2006) Balmaverde, B., Capetti, A., & Grandi, P. 2006, A&A, 451, 35
- Beckmann et al. (2006) Beckmann, V., Gehrels, N., Shrader, C. R., & Soldi, S. 2006, ApJ, 638, 642
- Beckmann et al. (2009) Beckmann, V., Soldi, S., Ricci, C., et al. 2009, A&A, 505, 417
- Benlloch et al. (2001) Benlloch, S., Rothschild, R. E., Wilms, J., et al. 2001, A&A, 371, 858
- Bondi (1952) Bondi, H. 1952, MNRAS, 112, 195
- Bowyer et al. (1970) Bowyer, C. S., Lampton, M., Mack, J., & de Mendonca, F. 1970, ApJ, 161, L1
- Collmar et al. (1999) Collmar, W., Bennett, K., Bloemen, H., et al. 1999, Astrophysical Letters Communications, 39, 57
- Courvoisier et al. (2003) Courvoisier, T., Walter, R., Beckmann, V., et al. 2003, A&A, 411, L53
- Dadina (2008) Dadina, M. 2008, A&A, 485, 417
- Gehrels et al. (1993) Gehrels, N., Chipman, E., & Kniffen, D. A. 1993, A&AS, 97, 5
- Grandi et al. (2003) Grandi, P., Fiocchi, M., Perola, C. G., et al. 2003, ApJ, 593, 160
- Grandi & Palumbo (2004) Grandi, P. & Palumbo, G. G. C. 2004, Science, 306, 998
- Hardcastle et al. (2007) Hardcastle, M. J., Evans, D. A., & Croston, J. H. 2007, MNRAS, 376, 1849
- Harris et al. (2010) Harris, G. L. H., Rejkuba, M., & Harris, W. E. 2010, PASA, 27, 457
- Hartman et al. (1999) Hartman, R. C., Bertsch, D. L., Bloom, S. D., et al. 1999, ApJS, 123, 79
- Israel (1998) Israel, F. P. 1998, A&A Rev., 8, 237
- Jean et al. (2003) Jean, P., Vedrenne, G., Roques, J. P., et al. 2003, A&A, 411, L107
- Johnson et al. (1997) Johnson, W. N., Zdziarski, A. A., Madejski, G. M., et al. 1997, in American Institute of Physics Conference Series, Vol. 410, Proceedings of the Fourth Compton Symposium, ed. C. D. Dermer, M. S. Strickman, & J. D. Kurfess, 283–305
- Labanti et al. (2003) Labanti, C., Di Cocco, G., Ferro, G., et al. 2003, A&A, 411, L149
- Lebrun et al. (2003) Lebrun, F., Leray, J. P., Lavocat, P., et al. 2003, A&A, 411, L141
- Lebrun et al. (2011) Lebrun, F., Aharonian, F., Beckmann, V., et al. 2011, in proc. 8th INTEGRAL workshop ’The Restless Gamma-ray Universe’, Dublin, Septemer 2010
- Ling et al. (2000) Ling, J. C., Wheaton, W. A., Wallyn, P., et al. 2000, ApJS, 127, 79
- Lubiński (2009) Lubiński, P. 2009, A&A, 496, 557
- Lubiński et al. (2010) Lubiński, P., Zdziarski, A. A., Walter, R., et al. 2010, MNRAS, 408, 1851
- Lund et al. (2003) Lund, N., Budtz-Jørgensen, C., Westergaard, N. J., et al. 2003, A&A, 411, L231
- Magdziarz & Zdziarski (1995) Magdziarz, P. & Zdziarski, A. A. 1995, MNRAS, 273, 837
- Marchesini et al. (2004) Marchesini, D., Celotti, A., & Ferrarese, L. 2004, MNRAS, 351, 733
- Marconi et al. (2004) Marconi, A., Risaliti, G., Gilli, R., et al. 2004, MNRAS, 351, 169
- Miyazaki et al. (1996) Miyazaki, S., Takahashi, T., Gunji, S., et al. 1996, PASJ, 48, 801
- Neumayer et al. (2007) Neumayer, N., Cappellari, M., Reunanen, J., et al. 2007, ApJ, 671, 1329
- Petrucci et al. (2001) Petrucci, P. O., Haardt, F., Maraschi, L., et al. 2001, ApJ, 556, 716
- Poutanen & Svensson (1996) Poutanen, J. & Svensson, R. 1996, ApJ, 470, 249
- Rothschild et al. (2006) Rothschild, R. E., Wilms, J., Tomsick, J., et al. 2006, ApJ, 641, 801
- Rothschild et al. (2011) Rothschild, R. E., Markowitz, A., Rivers, E., et al. 2011, ApJ, 733, 23
- Soldi et al. (2005) Soldi, S., Beckmann, V., Bassani, L., et al. 2005, A&A, 444, 431
- Sreekumar et al. (1999) Sreekumar, P., Bertsch, D. L., Hartman, R. C., Nolan, P. L., & Thompson, D. J. 1999, Astroparticle Physics, 11, 221
- Steinle et al. (1998) Steinle, H., Bennett, K., Bloemen, H., et al. 1998, A&A, 330, 97
- Steinle (2010) Steinle, H. 2010, PASA, 27, 431
- Vedrenne et al. (2003) Vedrenne, G., Roques, J., Schönfelder, V., et al. 2003, A&A, 411, L63
- Wheaton et al. (1996) Wheaton, W. A., Ling, J. C., Mahoney, W. A., et al. 1996, A&AS, 120, 545
- Winkler et al. (2003) Winkler, C., Courvoisier, T., Di Cocco, G., et al. 2003, A&A, 411, L1
- Zdziarski et al. (2000) Zdziarski, A. A., Poutanen, J., & Johnson, W. N. 2000, ApJ, 542, 703