Particle tracking in kaon electroproduction with cathode-charge sampling in multi-wire proportional chambers
Abstract
Wire chambers are routinely operated as tracking detectors in magnetic spectrometers at high-intensity continuous electron beams. Especially in experiments studying reactions with small cross-sections the reaction yield is limited by the background rate in the chambers. One way to determine the track of a charged particle through a multi-wire proportional chamber (MWPC) is the measurement of the charge distribution induced on its cathodes. In practical applications of this read-out method, the algorithm to relate the measured charge distribution to the avalanche position is an important factor for the achievable position resolution and for the track reconstruction efficiency. An algorithm was developed for operating two large-sized MWPCs in a strong background environment with multiple-particle tracks. Resulting efficiencies were determined as a function of the electron beam current and on the signal amplitudes. Because of the different energy-losses of pions, kaons, and protons in the momentum range of the spectrometer the efficiencies depend also on the particle species.
keywords:
Tracking and position-sensitive detectors , multi-wire proportional chambers , magnetic spectrometers , electron-induced coincidence experimentsPACS:
29.30.-h , 29.40.Gx1 Introduction
Since long, high-resolution magnetic spectrometers for charged particles have been used in nuclear and particle physics. Combined with suitable coordinate detectors for tracking, such instruments can achieve the most accurate measurement of kinematic quantities [1]. For focusing spectrometers the measurements can be done in an detection area out of the line-of-sight to the target that is shielded to some extend from background particles. At the two currently operating high-energy, high-intensity continuous electron beam accelerators MAMI in Mainz, Germany, and CEBAF at Jefferson Lab (JLab), Virginia, wire chambers are routinely operated as tracking detectors in magnetic spectrometers [2, 3, 4].
During the last decade, a class of strangeness production experiments represented by the reaction were realized at the spectrometer facilities of both laboratories. The small cross-sections encountered in these reactions require high luminosities and in case of hypernuclear reactions the use of nuclear targets up to the medium-mass region ( 52). To maximise hypernuclear yields, the spectrometers are operated at minimum forward angles, where background rates increase by several orders of magnitude, severely interfering with the operation of the wire chambers.
In the pilot hypernuclear experiment at JLab, E89-009, a very high rate of electrons associated with bremsstrahlung dominated the background in the electron spectrometer and a very high rate of positrons from Dalitz pairs dominated the particle flux in the kaon spectrometer, so that beam currents were limited to below 1 A, giving an experimental luminosity, , of approximately 0.001 1036 cm2s-1 [5]. Even after a decade of optimizations the wire chambers of the third generation experiment at JLab, E05-115 (HKS-HES), experienced multiple tracks for a medium-mass target of 150 mgcm2 and beam currents of several A (= 0.09 1036 cm2s-1) that could not be resolved by the standard tracking analysis with a track reconstruction efficiency higher than 50 % [6].
The operation of multi-wire proportional chambers (MWPCs) in the Kaos spectrometer at MAMI is discussed in Section 2. It is described how the centre-of-charge analysis method, well-established in single-track events, had to be adapted to the multiple-track events. The strong variation in the charge distributions and the ambiguity introduced by a large number of charge clusters per event has lead to the development of a cluster and track-finding algorithm for the MWPCs, which is presented in Sections 3 and 4. This algorithm succeeded in resolving the multiple-track ambiguities with high efficiency. It was in-beam tested with a set of dedicated efficiency counters which allowed to check the validity of possible tracks. Results of the efficiency measurements are presented in Section 5 and the application of the method is discussed in Section 6.
2 Operation of the MWPCs
Crucial requirements for the wire chamber operation in kaon electroproduction measurements are (i) high efficiency for minimum ionizing particles and (ii) tracking capability for luminosities above 5 1036 cm2s-1. The limit for the second requirements depend strongly on the wire chamber geometry. It is known that slow-moving ions from the avalanches around the anodes form space charges that reduce the field. The effective voltage drop for a given particle rate increases with the anode pitch, with the distance between anode and cathode plane, and with the gas gain [7]. Modern developments aim for MWPC that resolve track coordinates with a spatial resolution of about 100 m in a very high-rate background up to a few MHzcm2. Such chambers have small chamber dimensions and are operated with low gas gain.
At the Institut für Kernphysik in Mainz, Germany, two large-sized MWPCs are operated by the A1 Collaboration as tracking detectors in the Kaos spectrometer’s hadron arm [8]. They were used before in several beam-times at GSI for trajectory reconstruction at relativistic heavy ion experiments, detecting successfully trajectories of pions and kaons as well as protons and heavy nuclear fragments [9, 10]. Contrary to conventional MWPCs the multiplication process in these chambers is divided into two steps, following a concept first described by Breskin and co-workers [11]. During the electron scattering experiments at MAMI the distribution of charge states of the ionizing particles as well as particle fluxes differ greatly from the situation at GSI. Typically the detector packages of spectrometers at electron machines are heavily shielded. At MAMI, the the shielding houses of the three-spectrometer facility consist of 40 cm thick boron carbide loaded concrete walls covered with a 5 cm thick lead layer on the inside. They weigh about 110 tons each [3]. For the shielding of the Kaos spectrometer polyethylene shields with 15% diboron trioxide by weight were used in combined system of shielding walls and ceiling covering 20 m2. The walls comprise a 10 cm thick neutron shield and a 5 cm thick lead layer. At the Kaos spectrometer the chambers, placed behind the analysing dipole magnet, are shielded by polyethylene walls and ceiling with 15% diboron trioxide by weight covering 20 m2. The walls comprise a 10 cm thick neutron shield and a 5 cm thick lead layer. However, when a continuous-wave electron beam of several A current is delivered to solid-state or cryogenic liquid targets situated in front of the dipole the chambers experience multiple tracks in almost every event due to high electromagnetic background radiation levels.
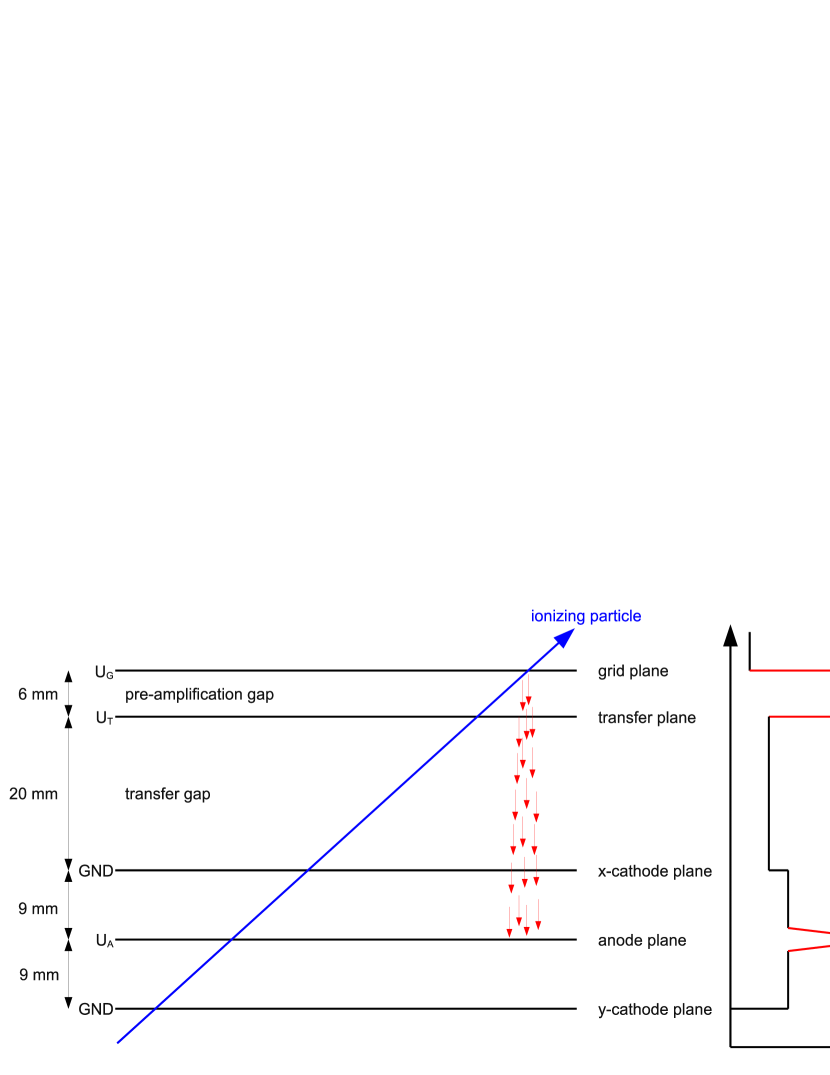
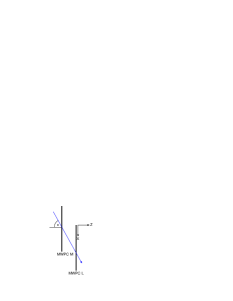
The two MWPCs, labelled M and L, have an active area of 1 190 340 mm2 each. The chambers are schematically depicted in Fig. 1. They consist of a plane of anodes (ø = 20 m gold-plated tungsten wires, 2 mm spacing), symmetrically sandwiched between two orthogonal planes of cathodes in - and - direction (ø = 50 m gold-plated tungsten wires, 1 mm spacing) along with two meshes of woven fabrics of plastic coated with a nickel layer, making up two planar electrode structures, the grid () and the transfer () plane and two gaps, the pre-amplification gap and the transfer-gap. The wires of the anode plane are running in diagonal direction, making an angle of 45∘ with either cathode direction. Typical potentials applied to these electrodes are: 9.1 kV, 2.0 kV, 4.0 kV, with the cathodes grounded.
Despite modern alternatives like micro-pattern gas detectors, the use of multi-wire proportional chambers (MWPCs) is still an economical way to cover a large area with tracking devices for charged particles. MWPCs are especially attractive when the particle track can be recorded from a single chamber in two orthogonal dimensions and when the required resolution is not significantly finer than FWHM 1 mm.
To determine the particle track the measured charge distributions induced on the cathode wire planes of the MWPCs are analysed. Of the several known methods for the bi-dimensional read-out of MWPCs, the induced-charge sampling is well established since the 1970s [12]. However, even in single-track operation, the choice of analysis method for the induced charge distributions on the cathode strips or wires has consequences on the position resolution and the track reconstruction efficiency [13]. The method can give good spatial resolution, but is compromised for multiple particles in one event as the signals can get partially integrated, the wide charge distributions can overlap, and peaks can get distorted.
Five cathode wires are connected together to one channel and are brought to one charge-sensitive preamplifier making a total of 240 analogue channels in - and 70 analogue channels in -direction. The preamplifiers provide a bipolar output with a negative amplitude of up to 2.5 V. The pulse width is 2 s. The signals are digitized by an ADC card addressed by a freely programmable transputer module, mounted directly on the chamber. The ADC converts the signal within 1.34 s into 8 bit. Sixteen of the ADC channels are read out and processed by one transputer. The transputer network system is connected to a multi-link card inside a front-end computer. As the FWHM of an induced cathode signal is known to be nearly equal to twice the anode-to-cathode gap, this is 2 9 mm, clusters of signals in 3–5 channels are observed.
Particles from the target cross the MWPC planes with an angle of about (50 20) ∘ to the normal. The peak position of charges transferred from the pre-amplification gap to the anodes is assumed to coincide with the impact point of the trajectory of the ionizing particle with the grid plane. This position does not depend on the angle of incidence of the particle’s trajectory, whereas the shape of the charge distribution is influenced.
The chambers are filled with a gas mixture of {84 % Ar, 9 % CO2, 7 % C4H10} in volume concentration. Calibrated flow controllers are used to control the amounts of the three gas components.
Details of the induced charge distributions depend on experimental parameters like track angles, particle species and velocities, and multiplicities, but also on working conditions like gas mixture, high voltages, and the integration gate width and timing. Therefore it is of practical importance to apply an algorithm which gives the best position resolution and highest track reconstruction efficiency. However, the choice of the analysis method depends heavily on the experimental requirements.
3 Cluster Analysis
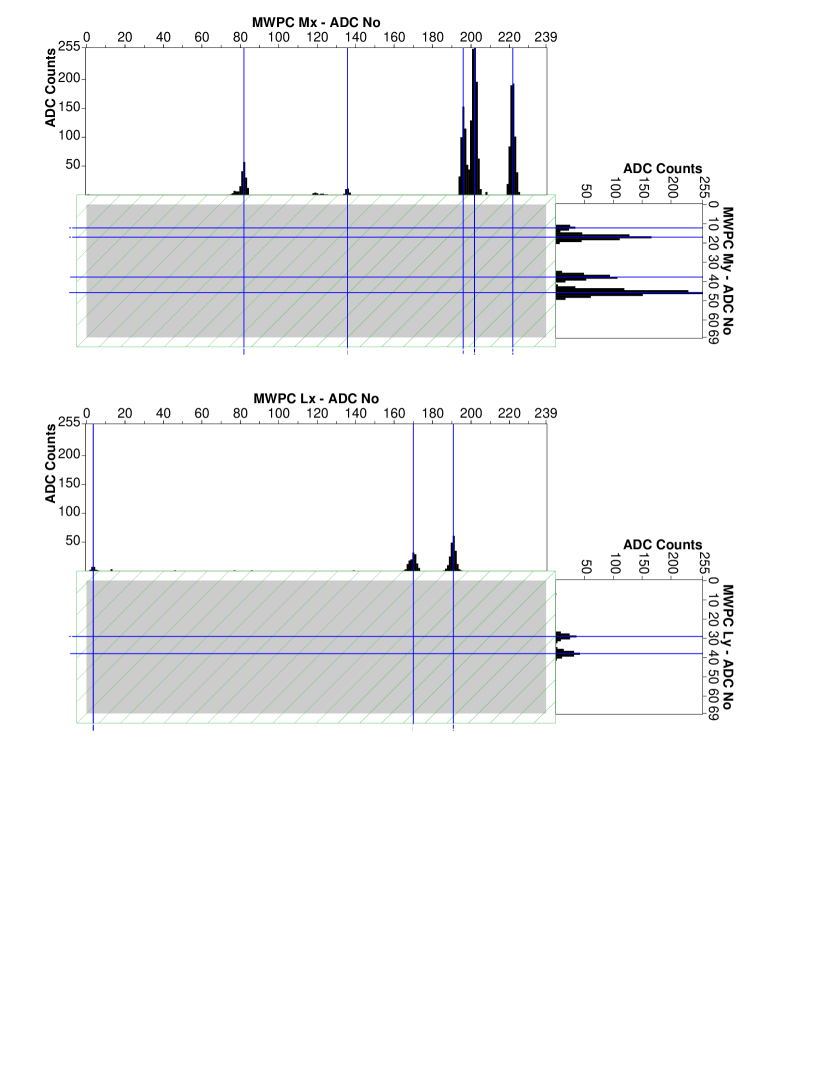
Fluctuations in the primary ionisation and electron diffusion along the drift path lead to non-Gaussian charge distributions induced on the cathodes. The distributions are further deteriorated by noisy channels, by multiple tracks in the chamber, and by induced signals in the electronic chain. To relate the induced charge distributions to the avalanche position, (i) the geometrical parameters of the chamber, (ii) the signal-to-noise ratio, and (iii) physical processes of the ionization and avalanche formation had to be taken into account. Charge distributions in both MWPCs taken with 2 A beam current on a 5 cm liquid hydrogen target, corresponding to luminosities of 2.500 1036 cm2s-1, are shown in Figs. 2 and 3. Peak positions as indicated by vertical and horizontal lines in the display were determined by the cluster algorithm discussed in this Section.
The raw data are 8-bit ADC values, , for each read-out channel, , in the - and -plane. As preamplifiers and ADCs vary along the planes, each combination is assigned a gain factor and a pedestal value . In few cases, where individual channels showed misbehaviour, caused e.g. by wire ageing, their amplitudes were interpolated from both neighbouring channels. Then “clusters” are defined by a group of neighbouring channels with detected charges. A cluster has to consist of at least 2 channels and could include a single channel below pedestal. At first each cluster is characterized by its detected charge, , its channel multiplicity, , its centre-of-charge, , its width, , and its largest amplitude, , at channel .
Because of the two amplification regions, as shown in Fig. 1 (right), and the large crossing angles of the particles, the liberated charges that are drifting from the pre-amplification plane will be displaced in the anode plane with respect to the weaker direct signal. The two separated charge localisations differ by a distance , being 35 mm. For a typical angle of this distance was mm corresponding to 10 channels. As the amplification of the direct signal was only partial, and the signal was induced on the cathodes at a much earlier time and thus got integrated only partially, a second peak in the charge distribution was not often observed, however, an asymmetry in the shape of the peak was regularly present in the signals. Because the drift time was regulated by the gas mixture and the high voltages, and the integration gate could get matched to this drift time, it was possible to minimize the appearance of double peaks and to reduce variation in cluster shapes. In Fig. 2 the peaks in the -plane of MWPC M show features related to the two-stage amplification.
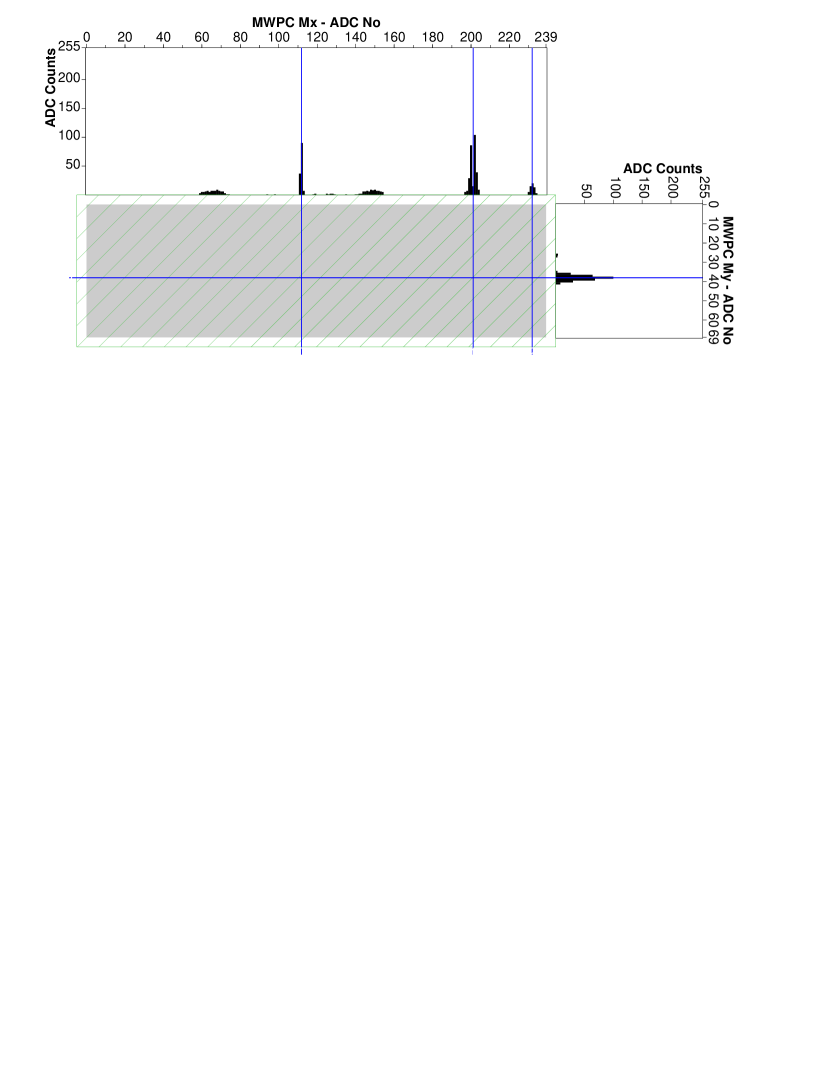
During the experiments sometimes charge distributions were observed, where satellite peaks were accompanying the physical peak, that was produced by a heavily-ionising light particle. Fig. 3 shows a charge distribution in the -plane of MWPC M with satellite charges on both sides of a needle-like peak. The source of these peaks can be understood by the anode plane construction mounted in between the cathode planes and was identified as a capacitive coupling between anode and cathode at the stesalite frame which have a dielectric constant 6, see discussion in [14]. A strong correlation exits between the vertical position of the physical peak and the relative position of the satellites in the -plane. Typical distances between the satellites are 82–86 cathode channels reflecting the height of the frame. The satellite signals were not be present in single-track events after a fine adjustment of the integration gate, but could not be avoided in multi-track events, when the integration gate was offset in respect to the timing of the second traversing particle, and the integration became sensitive to charges induced on the cathode strips by charges flowing out of the anode wires.
Each cluster is further analysis for its internal structure to identify possible peak positions as follows: A truncated cluster is created around the channel with the charge maximum, . It extends to the left and to the right for 2 channels, if the charge values for these channels are below a minimum of 90 % of the charge in . The truncated cluster extends at most up to the limits of the original cluster or up to a channel with only a minimum of charge. For clusters that reach the 8-bit maximum of the ADC the counting of channels starts at the left and right limits of the saturation plateau. If no such structure is found the cluster is discarded. This procedure ensured that a truncated cluster corresponds to a peak-like structure. Next, the summed charge in the truncated cluster is compared to the charge outside the peak region. If the latter is larger than 30 % in the -planes of the MWPC or larger than 1 % in the -planes of the MWPC and the outside region is wider than the required minimum for a cluster, a separate cluster is created. The difference between the - and -planes is attributed to the different appearances of pick-up charges on the cathode wires. The extensions of the new cluster is depending on the distribution of charges. For a large charge close to the original peak, i.e. within 2 channels, the new cluster extends to the peak region, otherwise to the border region. This construction avoids the creation of extra clusters when fluctuations appear in the tails of the original peak.
4 Track Reconstruction
In the analysis of the data all clusters are combined to form possible particle tracks. With clusters possible track points and possible tracks through both chambers are generated. This ensemble is classified according to a set of track quality factors, ranging from 0 (excluded) to 1 (highest quality).
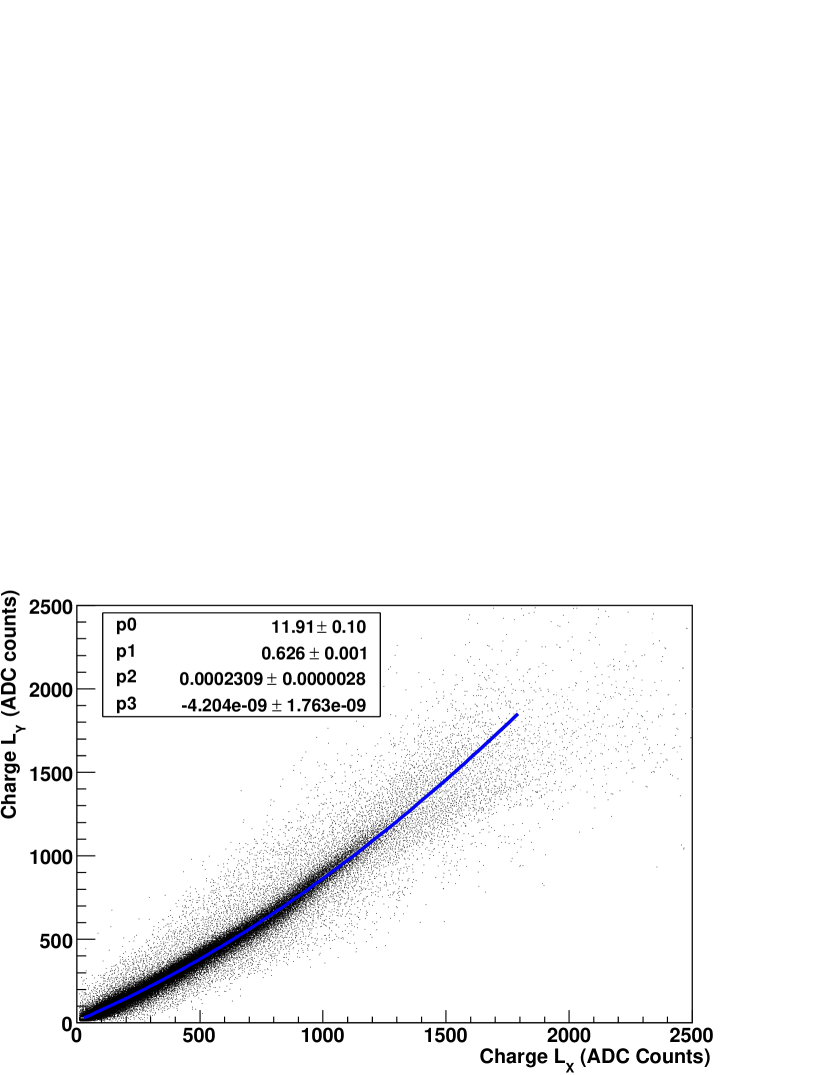
As the MWPCs were constructed with symmetric cathode planes, a correlation exists between the induced charge measured in one cathode plane to the induced charge of the perpendicular plane. Fig. 4 shows a large set of measured charges in MWPC L deposited by particles of different velocities. A third order polynomial function was used to parametrise phenomenologically the distribution. The non-linear response is attributed to many factors, the asymmetry in the liberated charges drifting through the two-step MWPC, the systematics in the cluster-finding, and saturation in the ADCs. In each MWPC the measured difference of a pair of clusters in - and -direction to the phenomenological curve is used to determine the quality factors and . In many cases with these factors alone a correct pairing of clusters is possible, as shown in Fig. 2.
Valid tracks are bound to angular limits, given by the acceptance of the spectrometer. Both MWPCs are situated in a field-free space, so that particle tracks can be extrapolated linearly to the field boundary at the end of the dipole.
Especially the relation between vertical hit positions of the two chambers provides a powerful criterion for the track finding. The target angle acceptance of the spectrometer is large in the horizontal direction and small in the vertical direction. The vertical track angles, , for particles originating at the target are strongly correlated to the vertical positions. This relation is caused by the magnet optics leading to diverging particles tracks.
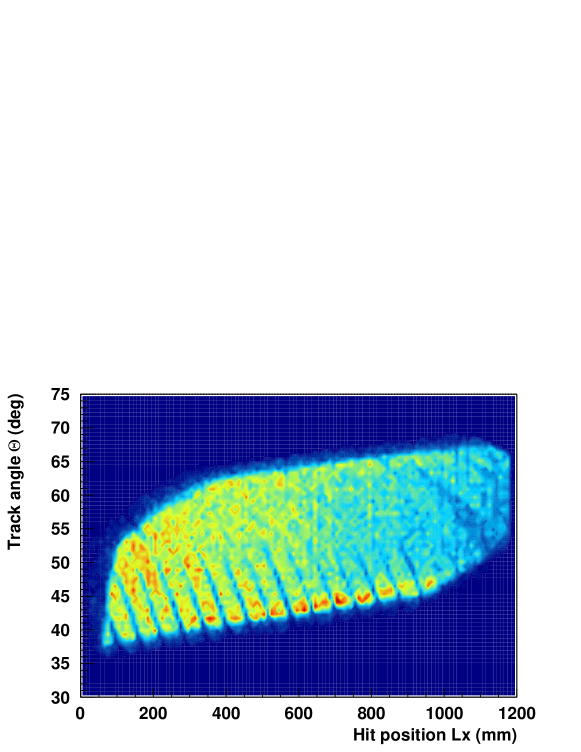
In the horizontal direction the tracks originating at the target form a large, but limited acceptance region with horizontal track angles, , ranging from 35 to , with a dependence on the horizontal position as shown in Fig. 5. The strip structures within the acceptance region are due to the geometry of the scintillator walls that leads to inefficiencies.
| event | track | total | ||||||||
|---|---|---|---|---|---|---|---|---|---|---|
| Fig. 6 | 0 | 0.96 | 1 | 1 | 1 | 1 | 1 | 0.96 | 0.58 | 1 |
| Fig. 7 | 0 | 1 | 1 | 1 | 1 | 1 | 1 | 1 | 0.81 | 1 |
| 1 | 0.73 | 0.86 | 0.86 | 1 | 1 | 1 | 1 | 0.81 | 1 | |
| 2 | 0.40 | 0.55 | 1 | 1 | 1 | 0.73 | 1 | 0.91 | 1 |
In the Kaos spectrometer the MWPCs are followed by two scintillator walls, labelled F and G, that are segmented in -direction. A last group of quality factors is determined by the extrapolation of the track to both scintillator walls. The spatial difference to the closest observed hit, and , are used as well as the the spacial difference to the vertical positions, and , as measured by the topbottom time differences by the individual scintillator paddles. The measured time difference in a scintillator bars becomes less accurate when the particle deposits only a small amount of energy, e.g. for grazing incidence. To improve the quality assessment the maximum value from both walls is used as quality factor.
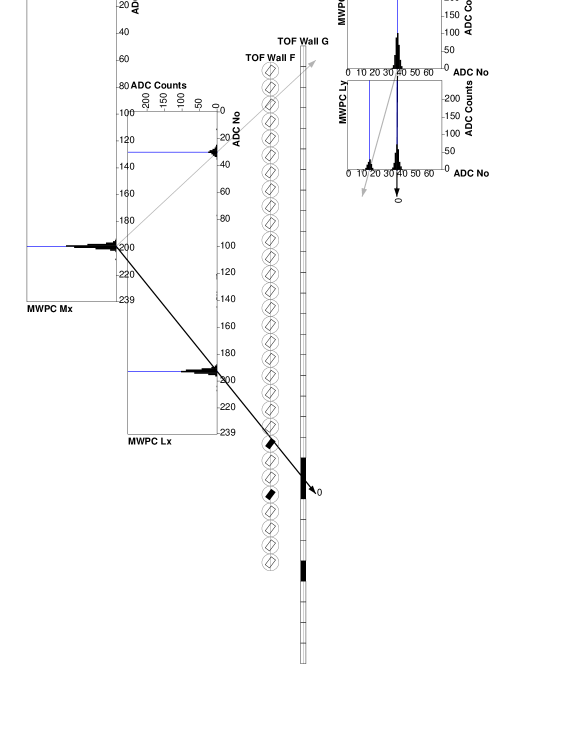
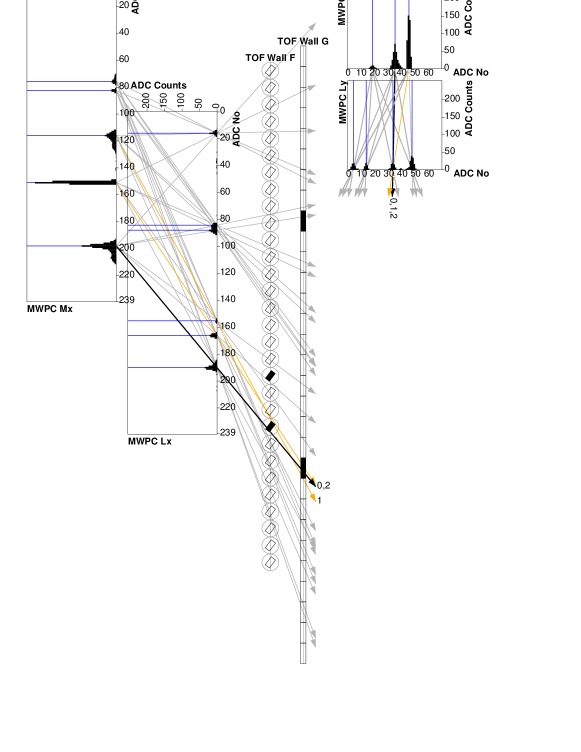
Figs. 6 and 7 show the event displays of two events, the first being exceptionally simple with a low occupancy of ADC charges and hits in the scintillator walls. It can be seen in this event that a strong charge correlation between the two peaks in - and the two peaks in -direction exits. One unique set of clusters in the MWPCs together with hits in the walls form the track, the two other track combinations were excluded by the quality criteria and assigned to background particles. The track quality was close to 1, see Table 1. A more common event topology with multiple clusters or hits in each detection plane is shown in Fig. 7. From the charge distribution in the -plane of MWPC M the coincident passing of one heavily ionizing and at least one minimum ionizing particle through this chamber can be deduced. The track-finding algorithm returns three possible tracks see Table 1), all other cluster and hit combinations were excluded by one of the quality criteria. As both events were triggered by the efficiency counters, explained in Section 5, it is known that with track no. 0 a proper track assignment was achieved.
5 Tracking Efficiencies
The implemented read-out principle allows for high track multiplicities, however, the track reconstruction can then become a major source of detection inefficiency, quantified by the tracking efficiencies as follows: (i) intrinsic efficiency: the percentage of events in which any charge was detected in the chamber following a charged particle, (ii) any track efficiency: the percentage of events in which a track was reconstructed from the charges, (iii) track reconstruction efficiency: the percentage of events in which the proper track was reconstructed. All efficiencies are to some extend depending on the cluster analysis and the reconstruction method. The track reconstruction efficiency is heavily depending on the particle’s momentum and the beam current, or more general on the luminosity. The latter dependency is a consequence of the fast increment of the flux of background particles with the current.
There is no way of determining the tracking efficiencies from the electro-production measurements. Instead, data was taken during dedicated efficiency runs. For these runs two small scintillating detectors of type Bicron BC-408 and dimensions mm2 with 5 mm thickness were installed in front of each MWPC to determine intrinsic and tracking efficiencies of the chambers. The active parts were connected to optical light guides and read out by PMTs of type Hamamatsu R1828. When attached to the MWPC frames the active areas of the counters were vertically centred and horizontally at the same position relative to the corresponding MWPC. The detectors could easily be moved out of the spectrometer’s acceptance when not in use.
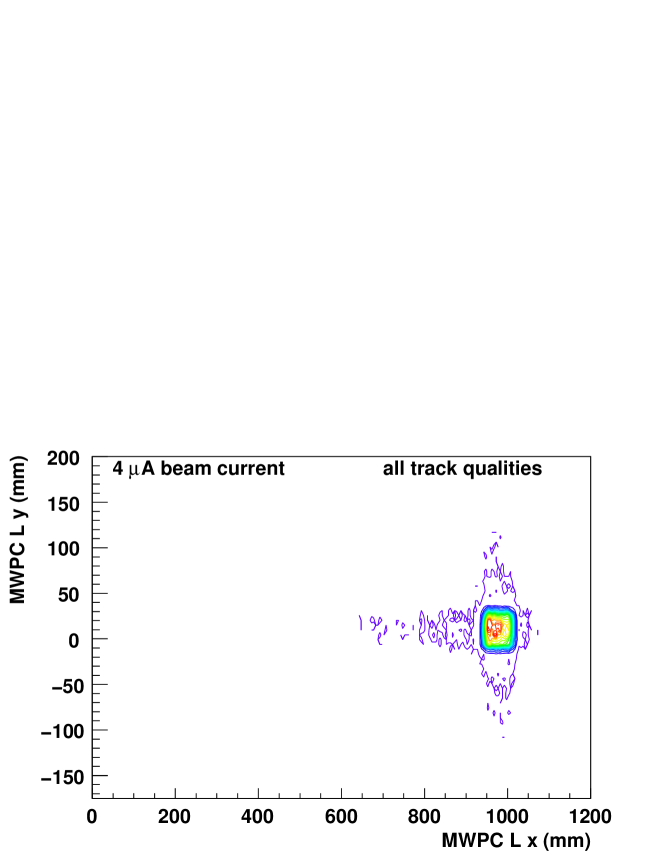
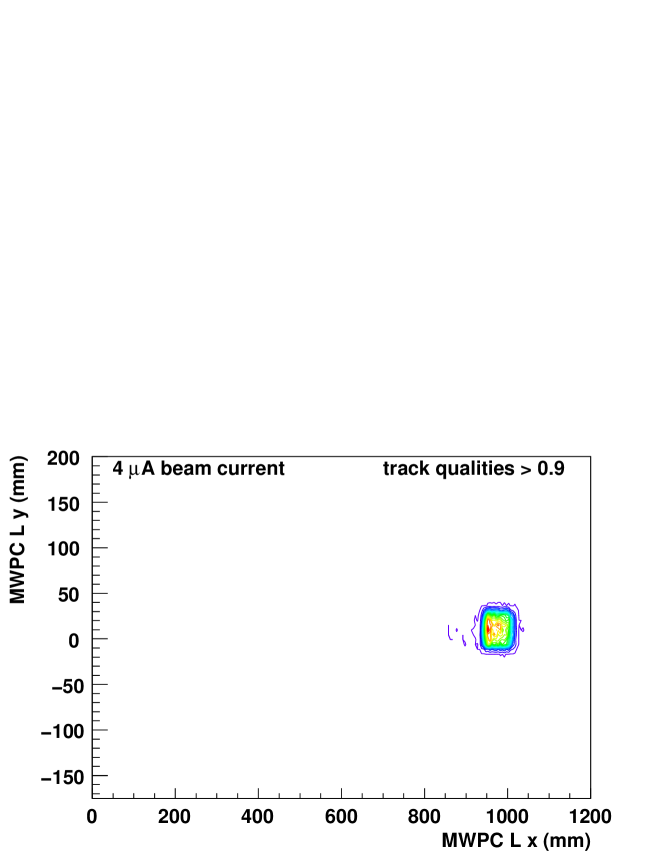
The external counters could be used to select trajectories passing through both chambers in a small acceptance region. The histogram in Fig. 8 shows a typical distribution of events in the wire chamber coordinate system obtained under those trigger conditions for a beam current of 4 A, corresponding to luminosities of 5 1036 cm2s-1. The bands in - and -direction correspond to wrongly reconstructed coordinates in one of the four MWPC planes, the strongly populated square corresponds to the projection of the position of the efficiency counters. When requiring a high track quality almost only properly reconstructed tracks remain in the event sample.
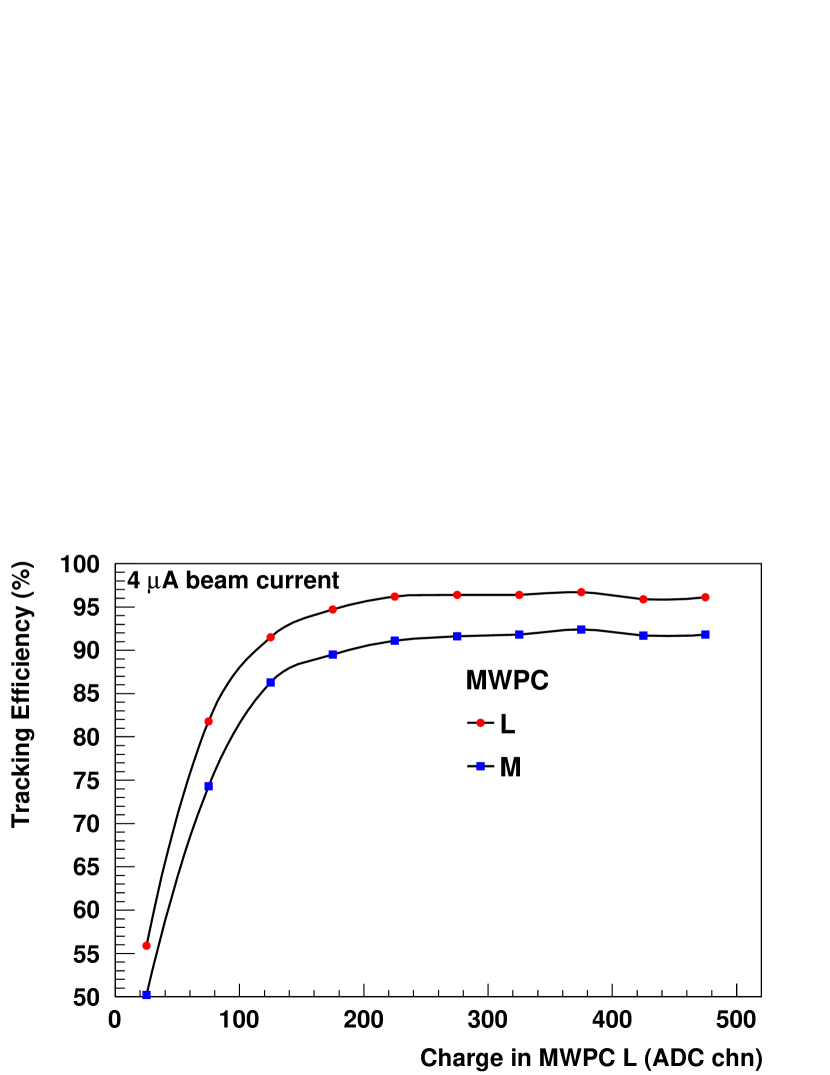
The spectrometer was situated under forward angles at 31∘ with a solid angle acceptance of 10 msr in an in-plane angular range of . The results are separated into samples taken with 1, 2, 3, and 4 A beam current and within the samples into events where the traversing particle was identified by its specific energy-loss as proton and pion by the scintillator walls. With the spectrometer set to a momentum bite around 600 MeV protons, kaons, and pions loose significantly different energies in the counter gas. The intrinsic efficiencies were well above 99 % independent on the beam current. The efficiency to form a track was somewhat above 98 %. For pions track reconstruction efficiencies ranged between 86 and 68 % corresponding to beam currents of 1–4 A, for protons the efficiencies were between 98 and 90 %, details are tabulated in Table 2. Several runs were taken during a period of 2 weeks showing small variations of no more than 2 %. Charge-separated tracking efficiencies for a beam current of 4 A are shown in Fig. 9. From the average charge collected for kaons track reconstruction efficiencies of 75–90 % were evaluated.
| /1036 | intrinsic (%) | tracking (%) | proton (%) | pion (%) | |||||||
| (cm2s-1) | (A) | L | M | any track | L | M | L | M | L | M | used quality factors |
| 1.2 | 1 | 99.3 | 99.6 | 97.8 | 97.1 | 95.9 | 98.3 | 97.1 | 86.4 | 83.9 | all |
| 2.5 | 2 | 99.5 | 99.7 | 97.6 | 96.0 | 93.4 | 97.4 | 95.1 | 83.5 | 78.4 | ” |
| 3.7 | 3 | 99.6 | 99.8 | 97.3 | 94.5 | 90.9 | 96.0 | 92.7 | 81.7 | 74.9 | ” |
| 5 | 4 | 99.6 | 99.8 | 97.3 | 93.1 | 88.2 | 95.0 | 90.6 | 76.9 | 67.9 | ” |
| 5 | 4 | ” | ” | 98.9 | 75.8 | 62.7 | 78.2 | 65.5 | 54.3 | 39.0 | no , no |
| 5 | 4 | ” | ” | 97.8 | 90.6 | 80.8 | 92.5 | 83.8 | 74.0 | 55.8 | no , no |
| 5 | 4 | ” | ” | 97.9 | 91.4 | 83.7 | 93.1 | 85.8 | 77.1 | 66.5 | no |
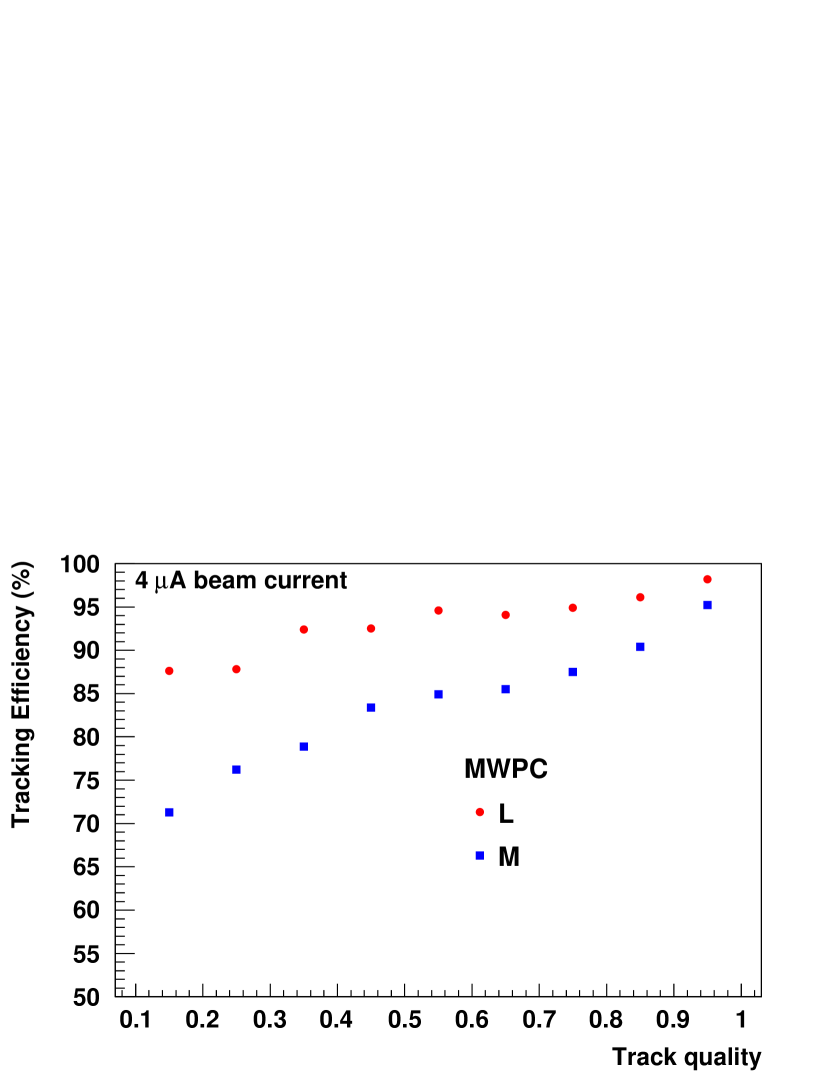
Tracks reconstructed to pass through the acceptance region on average have a higher quality factor, whereas tracks reconstructed to miss this region on average have a smaller quality factor. The continuous increase of the efficiency with the quality as shown in Fig. 10 for 4 A beam current, provides confidence that the quality factor is indeed a measure of the goodness-of-track.
6 Discussion
When using the cathode-charge sampling method for the bi-dimensional read-out of MPWCs a large variation of induced charge distributions can be observed, depending e.g. on track angles, charged particle velocities, integration gate width and timing, and charged particle occupancies. For MWPCs used as tracking detectors in a magnetic spectrometer these factors vary, as incident particle species and momenta as well as background particle fluxes depend on the spectrometer and accelerator settings for a particular experiment.
To resolve the ambiguities appearing with multiple, non-perpendicular incident particles with different energy-losses a cluster-finding and track reconstruction algorithm was developed that assigns each possible track a quality factor. This method was in-beam tested with two large-sized MWPCs in the Kaos spectrometer and proved to be effective not only in quantifying the tracking efficiencies, but more importantly it allowed to systematically determine track reconstruction efficiencies which can be applied to the operation of the MWPCs in electro-production experiments.
In general, tracks of heavily ionising particles in a low background environment have the largest probability of being properly reconstructed. Tracks of minimum ionizing particles are harder to reconstruct properly as background signals of dominantly small amplitudes are present in the chambers at any time. It is concluded that the track reconstruction in the MWPCs represents a primary source of inefficiency for high electron beam currents on typical targets of several hundred mgcm2 thickness. The use of information from the external detectors improves the efficiencies by 20–25 % in the case of the highest beam current that was probed. However, at these currents also the external counters register many multiply hits. The check on the spectrometer acceptance and the correlations of the coordinates improves the efficiencies by 10–15 %, and the induced cathode charge correlation has an impact of 5 % for the higher amplitudes.
By using the introduced method and the obtained results the track reconstruction efficiencies for particles not seen in the beam-tests, i.e. kaons, could have been determined. These findings were applied to data taken with the Kaos spectrometer in kaon electro-production, improving the systematic uncertainties in the cross-section extraction significantly.
Acknowledgements
Work supported in part by the Federal State of Rhineland-Palatinate and by the Deutsche Forschungsgemeinschaft with the Collaborative Research Center 443.
References
- [1] K. I. Blomqvist, High resolution magnetic spectrometers, Nucl. Phys. A 497 (1989) 457c–464c.
- [2] O. K. Baker, et al., The High Momentum Spectrometer drift chambers in Hall C at CEBAF, Nucl. Instr. and Meth. in Phys. Res. A 367 (1995) 92–95.
- [3] K. I. Blomqvist, et al., The three-spectrometer facility at the Mainz microtron MAMI, Nucl. Instr. and Meth. in Phys. Res. A 403 (3) (1998) 263–301.
- [4] K. G. Fissum, et al., Vertical drift chambers for the Hall A high-resolution spectrometers at Jefferson Lab, Nucl. Instr. and Meth. in Phys. Res. A 474 (2001) 108–131.
- [5] T. Miyoshi, et al., High resolution spectroscopy of the B hypernucleus produced by the reaction, Phys. Rev. Lett. 90 (23) (2000) 232502.
- [6] T. Gogami, Medium heavy hypernuclear spectroscopic experiment JLab E05-115, in: 22nd Indian-Summer School on Strangeness Nuclear Physics (SNP2010), Rez/Prague, Czech, 7–11 September 2010.
- [7] Induced charge distributions in proportional detectors, Brookhaven National Laboratory Instrumentation Publication, online available at http://www.inst.bnl.gov/publications/Mathieson.shtml (1991).
- [8] P. Achenbach, et al., First measurements of and hyperons in elementary electroproduction at MAMI, in: B. F. Gibson, K. Imai, T. Motoba, T. Nagae, A. Ohnishi (Eds.), Proceedings of the X International Conference on Hypernuclear and Strange Particle Physics (HypX), Tokai, Japan, 14–18 September 2009, Nucl. Phys. A 835 (2010) 313–316.
- [9] H. Stelzer, Multiwire chambers with a two-stage gas amplification, Nucl. Instr. and Meth. in Phys. Res. A 310 (1991) 103–106.
- [10] P. Senger, et al., The kaon spectrometer at SIS, Nucl. Instr. and Meth. in Phys. Res. A 327 (2–3) (1993) 393–411.
- [11] A. Breskin, G. Charpak, S. Majewski, G. Melchart, G. Petersen, F. Sauli, The multistep avalanche chamber: a new family of fast, high-rate particle detectors, Nucl. Instr. and Meth. 161 (1979) 19–34.
- [12] G. Charpak, F. Sauli, High-accuracy, two-dimensional read-out in multiwire proportional chambers, Nucl. Instr. and Meth. 113 (1973) 381–385.
- [13] N. Awaji, et al., Resolution study of cathode-charge sampling on a multiwire proportional chamber for accurate particle tracking, Nucl. Instr. and Meth. 198 (1982) 243–251.
- [14] P. Baltes, C. Müntz, H. Oeschler, S. Sartorius, A. Wagner, H. Stelzer, Properties of large MWPC’s at the Kaon Spectrometer, in: GSI Scientific Report 1991, GSI, Darmstadt, 1992, p. 364.