HerMES: Lyman Break Galaxies individually detected at in GOODS-N with Herschel/SPIRE
Abstract
As part of the Herschel Multi-tiered Extragalactic Survey we have investigated the rest-frame far-infrared (FIR) properties of a sample of more than 4800 Lyman Break Galaxies (LBGs) in the Great Observatories Origins Deep Survey North field. Most LBGs are not detected individually, but we do detect a sub-sample of 12 objects at and one object at . The ones detected by Herschel SPIRE have redder observed NUV-U and U-R colors than the others, while the undetected ones have colors consistent with average LBGs at . The UV-to-FIR spectral energy distributions of the objects detected in the rest-frame FIR are investigated using the code cigale to estimate physical parameters. We find that LBGs detected by SPIRE are high mass, luminous infrared galaxies. It appears that LBGs are located in a triangle-shaped region in the vs. diagram limited by at the bottom and by a diagonal following the temporal evolution of the most massive galaxies from the bottom-right to the top-left of the diagram. This upper envelop can be used as upper limits for the UV dust attenuation as a function of LFUV. The limits of this region are well explained using a closed-box model, where the chemical evolution of galaxies produces metals, which in turn lead to higher dust attenuation when the galaxies age.
Subject headings:
galaxies: evolution — galaxies: formation — galaxies: high-redshift — infrared: galaxies — ultraviolet: galaxies1. Introduction
The safest way to estimate the total star formation rates (SFR) of galaxies is to consider the energy budget involving far-ultraviolet (FUV) and far-infrared (FIR) measurements (e.g., Buat & Xu 1996). But, because only a small number of individual Lyman Break Galaxies (LBGs) have been detected in the FIR/submm range (e.g., Chapman et al., 2000; Chapman & Casey, 2009; Siana et al., 2009), we need to observe this type of galaxies at lower redshifts to understand their dust emission. Burgarella et al. (2007) detected dropout galaxies at at m with Spitzer. But, the dust luminosities estimated from the rest frame m flux density is far from the peak of the dust emission and could provide biased SFR estimates.
We observe in the FIR a sample of LBGs at (FUV dropouts) and at (near-UV or NUV dropouts). We use the SPIRE instrument (Griffin et al., 2010) on Herschel (Pilbratt et al., 2010) with observations from HerMES (Oliver et al., 2010; Oliver et al., 2010b)111http://hermes.sussex.ac.uk. This is the first opportunity to estimate directly the dust luminosity (or upper limits) of unlensed LBGs from FIR data. We assume , , and and use AB magnitudes throughout.
2. Data
2.1. LBG samples
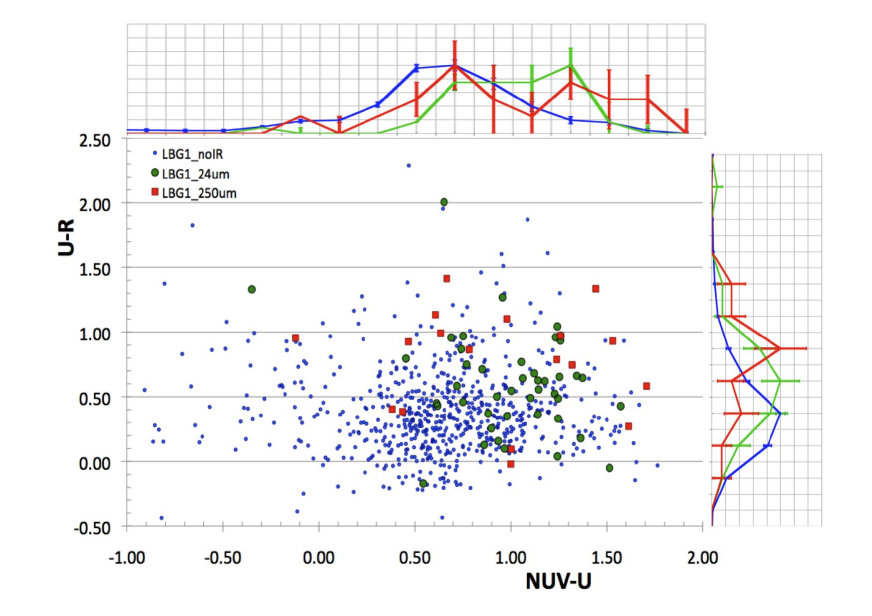
Observations of the Great Observatories Origins Deep Survey North (GOODS-N) were secured as part of the Herschel Multi-Tiered Extragalactic Survey (HerMES, Oliver et al., 2010) by GALEX in FUV and NUV. We define two samples of galaxies in two redshift ranges corresponding to FUV dropouts and NUV dropouts (Fig. 1).
The photometry is performed with IRAF daophot ii (Stetson, 1987) in the NUV, and in the FUV with the NUV coordinates. Using addstar, the completeness is estimated to 80% down to and . We use cigale (Noll et al., 2009) to build models in the range and delimit the regions corresponding to LBGs at and in the color-color diagrams.222Note that the code accounts for IGM attenuation. The sample is cross-correlated with the -selected Capak et al. (2004) multiwavelength catalog over , with a search radius of 1″, producing a catalog of 86,768 entries (46,076 with GALEX data, 47,450 with optical data and 6,979 objects with both). The -band data were collected using the Kitt Peak National Observatory 4-m telescope. The -, -, -, -, and -band data were collected using the Subaru 8.2-m telescope and Suprime-Cam instrument with 5 limiting magnitudes of , , , , and . Photometric redshifts are computed using Le Phare (Arnouts et al., 2002; Ilbert et al., 2009) and we use them in addition to spectroscopic redshifts from Barger, Cowie, & Wang (2008). In the redshift range , we compare photometric to spectroscopic redshifts (784 galaxies) and find / (1+z) = 0.036 while we have (24 galaxies) / (1+z) = 0.125 at .
From the lower redshift catalog, 27 objects (4%) have photometric redshifts at , 696 objects (94%) are in our redshift range of and 17 objects (2.3%) are at . For the higher redshift catalog, 223 objects (5%) have photometric redshifts at , 3859 objects (94%) are in our redshift range of , and 25 objects (0.6%) are at .
2.2. Matching with SPIRE
We cross-correlate the LBG samples with the HerMES multi-wavelength catalog from Roseboom et al. (2010). It uses 24 sources as a prior, so we restrict ourselves to the deep GOODS-N MIPS region of , i.e., . Within this region we have 260 low- LBGs and 1558 high-. This HerMES catalog contains 1951 24m sources as an input to the association process. A search radius of 1″ is chosen, since the 3.6 positions are good to that accuracy. Given the source density of the HerMES catalog this should return % spurious matches. We find 86 matches between this list and our LBG samples, with 63 matches to the low- sample and 23 matches to the high- sample, with (3.2%) and (47.8%), respectively, expected by chance.
The HerMES catalog gives SPIRE measurements for all MIPS sources. To define confident SPIRE detections, we require flux densities higher than 7.6, 9.2 or 10.4 mJy at 250, 350 and 500m respectively. This flux limit corresponds to , the clipped map confusion noise, where is estimated by Nguyen et al. (2010) from the map variance after removing pixels brighter than (the raw map confusion noise). Imposing these more reasonable flux density limits gives 14 low- candidates and one high- candidate.
We define SPIRE detections (listed in Table 1) whenever the SNR is larger than 3 and their “purity” index (see Roseboom et al., 2010; Brisbin et al., 2010) is larger than 0.2. Note that according to this definition there are no detections at m. The “purity” of the SPIRE flux density is estimated from the ratio of this source’s 24m flux density to the 24m one smoothed with the SPIRE beam at this position. For no “pollution”, the purity is 1 and decreases when there are possible contributions by other sources. We additionally inspected the images around each candidate to check for contamination by neighbors. Based on the purity index, we exclude 2 objects at . All but one of the sources on the final sample (actually the highest redshift LBG) have SNR 6 (see Table 1).
The final HerMES LBG sample contains 12 objects and the sample contains 1 object. Although it is difficult to determine what fraction of 2 LBGs should be detected in the FIR, we can use the Spitzer m data to estimate how many LBGs are expected to be detected at 250m. From the present sample, the mean ratio for the SPIRE-detected LBGs and so, the present 250m detection limit of 7.6 mJy correspond to 140Jy at 24m. At this level, and based on the 24m catalog, we would expect 20 LBGs to be detected with SPIRE at 250m. We find 12 objects, i.e., 60% of the expectation. This is consistent with the completeness at this flux level in Roseboom et al. (2010).
2.3. SED fitting
Dust luminosities () and other parameters are estimated using cigale (Noll et al. 2009)333http://www.oamp.fr/cigale. cigale performs a Bayesian analysis to estimate parameter by fitting models to the UV-to-submm SEDs. One can select among two single stellar population libraries and several IR models/templates. An AGN component can also be added to estimate the AGN fraction (contribution by a potential AGN to ). The parameters of the dust attenuation law can be modified and cigale allows for two separate stellar populations with a multiphase dust treatment.
We use the VLA 1.4 GHz radio data from Morrison et al. (2010) which provides data down to a RMS noise of 3.9 Jy per beam. The stellar emission is based on Maraston (2005), while the dust emission is based on Dale & Helou (2002) templates. cigale provides dust luminosities , while FUV luminosities are derived at nm and are defined through the quantity . An energy budget is performed during the fit, and the maximum value allowed for has to be consistent with the energy moved by dust grains from the UV-optical range to the FIR range.
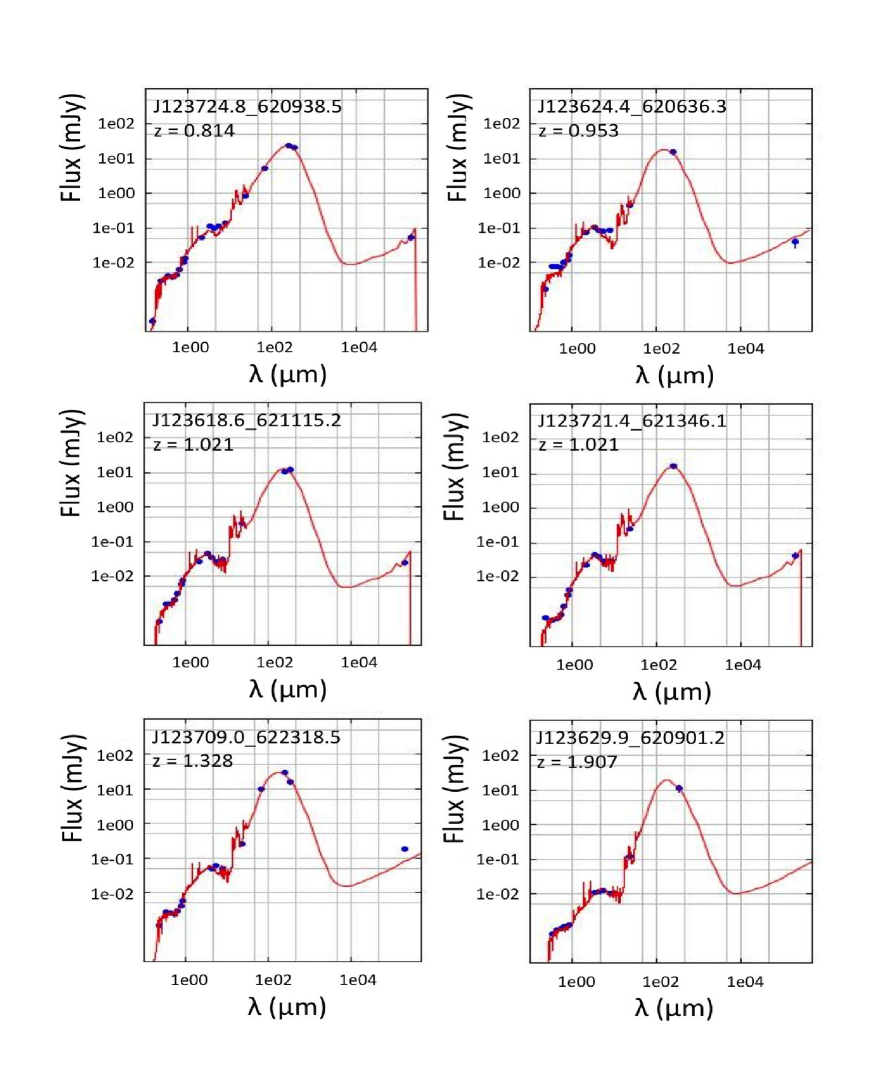
Individual SEDs with the best models selected by cigale are shown in Fig. 3 for the five LBGs with radio data and for the () LBG. Observational and physical parameters are given in Table 1. Fig. 3 shows that cigale is able to fit the SEDs from the FUV to the radio successfully. The average FUV luminosity of the SPIRE detected objects is , and most of them are therefore UV-Luminous Galaxies. Their average dust luminosity is and their stellar average mass is . A comparison with Magdis et al. (2010) shows that the average stellar mass is similar to the average stellar mass () of LBGs detected at m. The dust temperatures are estimated for a few objects by fitting modified black bodies with an emissivity index of 1.5. We find that two of the low- LBGs have K, while the high- ULIRG has K (see Table 1). The two low- LBGs have quite low temperatures compared with ULIRGS/SMGs, but may be typical of star-forming galaxies in general, while the high- one is similar to e.g. Arp220.
| ID | origin | SFR | ||||||||||||
|---|---|---|---|---|---|---|---|---|---|---|---|---|---|---|
| redshift | [AB] | [AB] | [Jy] | [mJy] | [mJy] | [mJy] | [M⊙] | [M] | [M | [mag] | [L⊙] | [K] | ||
| J123624.6620610.2 | 0.75 | 0.11 | 22.87 0.04 | 23.25 0.04 | 93.2 8.3 | 8.0 0.9 | — | — | 10.0 0.1 | 23.5 0.048 | 11.1 0.039 | 1.96 0.14 | 10.4 0.6 | — |
| J123547.4621005.9 | 0.81 | 0.24 | 24.07 0.07 | 25.33 0.24 | 86.3 7.6 | 11.3 0.9 | 12.1 1.5 | — | 10.2 0.1 | 34.8 0.030 | 11.3 0.007 | 3.68 0.28 | 9.9 1.4 | — |
| J123724.8620938.5 | 0.81 | 0.13 | 22.80 0.04 | 23.59 0.06 | 249.0 6.7 | 10.3 0.8 | — | — | 10.7 0.1 | 39.4 0.090 | 11.3 0.094 | 2.42 0.28 | 10.5 0.9 | — |
| J123633.2620834.9 | 0.93 | specz | 22.41 0.03 | 22.84 0.03 | 779.0 7.9 | 22.4 1.2 | 19.2 1.8 | 50.8 10.2 | 11.1 0.2 | 119.7 0.040 | 11.9 0.027 | 2.84 0.18 | 10.9 1.1 | 24.3 |
| J123714.4622112.3 | 0.94 | specz | 24.20 0.08 | 25.17 0.21 | 212.0 4.6 | 9.2 1.2 | 12.0 2.7 | — | 10.7 0.2 | 43.9 0.059 | 11.4 0.050 | 3.46 0.32 | 10.1 1.3 | — |
| J123624.4620836.3 | 0.95 | specz | 23.22 0.05 | 23.83 0.07 | 695.0 11.5 | 21.1 2.8 | 22.9 7.0 | — | 11.3 0.2 | 116.4 0.182 | 11.9 0.156 | 3.45 0.50 | 10.6 1.3 | 24.2 |
| J123614.4620718.5 | 0.97 | specz | 23.88 0.07 | 25.32 0.23 | 386.0 8.7 | 9.2 1.0 | 10.2 1.2 | — | 11.0 0.2 | 61.8 0.275 | 11.7 0.218 | 3.52 0.78 | 10.3 1.4 | — |
| J123721.4621346.1 | 1.02 | specz | 24.53 0.10 | 24.41 0.11 | 235.0 7.5 | 15.4 2.6 | — | 41.6 8.7 | 11.0 0.2 | 113.2 0.134 | 11.9 0.120 | 4.52 0.38 | 10.2 1.7 | — |
| J123618.6621115.2 | 1.02 | specz | 21.79 0.03 | 23.40 0.05 | 404.0 5.4 | 14.5 2.3 | — | 36.5 11.1 | 11.3 0.2 | 135.5 0.161 | 11.9 0.133 | 2.60 0.42 | 11.0 0.9 | — |
| J123722.5621356.6 | 1.02 | specz | 23.46 0.06 | 24.78 0.15 | 317.0 6.2 | 9.7 1.2 | 11.5 2.3 | 23.7 4.7 | 10.9 0.2 | 74.0 0.155 | 11.7 0.145 | 3.23 0.43 | 10.4 1.2 | — |
| J123808.9621847.5 | 1.04 | 0.29 | 22.89 0.06 | 23.66 0.06 | 218.0 8.8 | 9.8 1.1 | — | — | 10.8 0.3 | 78.2 0.168 | 11.6 0.156 | 2.46 0.40 | 10.8 0.8 | — |
| J123709.0622318.5 | 1.33 | 0.28 | 22.91 0.05 | 23.91 0.08 | 247.0 6.7 | 28.2 1.3 | 14.3 2.4 | 176.4 13.9 | 11.2 0.1 | 448.8 0.066 | 12.4 0.027 | 3.82 0.18 | 11.1 1.3 | 51.8 |
| J123629.6620901.2 | 1.97 | 0.67 | 24.33 0.09 | — | 110.0 6.0 | — | 10.5 2.4 | — | 10.5 0.1 | 893.3 0.036 | 12.5 0.035 | 4.30 0.20 | 11.1 1.5 | — |
3. Dust attenuation of Lyman Break Galaxies
Our LBG SEDs in the rest-frame UV are in very good agreement with the rest-frame UV spectra of the Shapley et al. (2003)’s composite spectrum at . Whatever the redshift range, LBGs seem to present the same starburst characteristics in the rest-frame UV, which is expected, given that similar rest-frame color selection criteria are used. However, the colors become redder when the objects are detected at 24m by Spitzer and even redder when they are detected at 250m by Herschel SPIRE. This can be interpreted as being due to higher dust attenuations (see Fig. 2), and is consistent with Burgarella et al. (2007), who found that bothSpitzer-detected and undetected LBGs have about the same stellar population ages, but the latter are more extinguished.
The AGN fraction determined by cigale is always consistent with zero, except for the galaxy J123633.2620834.3, for which a 20% AGN contribution to the FIR dust luminosity is suggested. Most of the IR excess due to a potential AGN should be in the MIR, while the SPIRE flux is expected to be dominated by the starburst component (Hatziminaoglou et al., 2010); cigale accounts for both.
The vast majority of the dropout galaxies are not detected by SPIRE with the present detection limits. If LBGs were to follow Meurer, Heckman, & Calzetti (1999) relation (relating UV-attenuation to dust emission), what fraction of them would be detectable? We can use the color as a proxy for the rest-frame . Simulations suggest that this color provides with an accuracy better than 0.01 for power-laws and , and 0. In detail, we can estimate:
| (1) | |||||
From the values, we estimate ) for the LBGs and, after evaluating from the filter closest to =0.15 nm (as a function of the redshift), we determine . These values of can be transformed into and using the following calibrations computed from the Dale & Helou (2002) models with , i.e., star-forming galaxies with similar properties to LBGs. We have also checked that Chary & Elbaz (2001) models are consistent with our calibration. By fitting polynomials as a function of redshift we find:
| (2) |
with (1.168, 1.166, 0.565, 0.091) for m, (1.689, 1.426, 0.582, 0.089) for m, and (2.336, 1.605, 0.556, 0.078) for m.
Assuming the Meurer, Heckman, & Calzetti (1999) relation allows to estimate rough order of magnitude for our LBGs (Burgarella et al., 2009). At m we should have detected 10 LBGs from the sample undetected in the mid-IR and far-IR, three LBGs from those detected at 24m, and 2 LBGs from those detected at 250m.
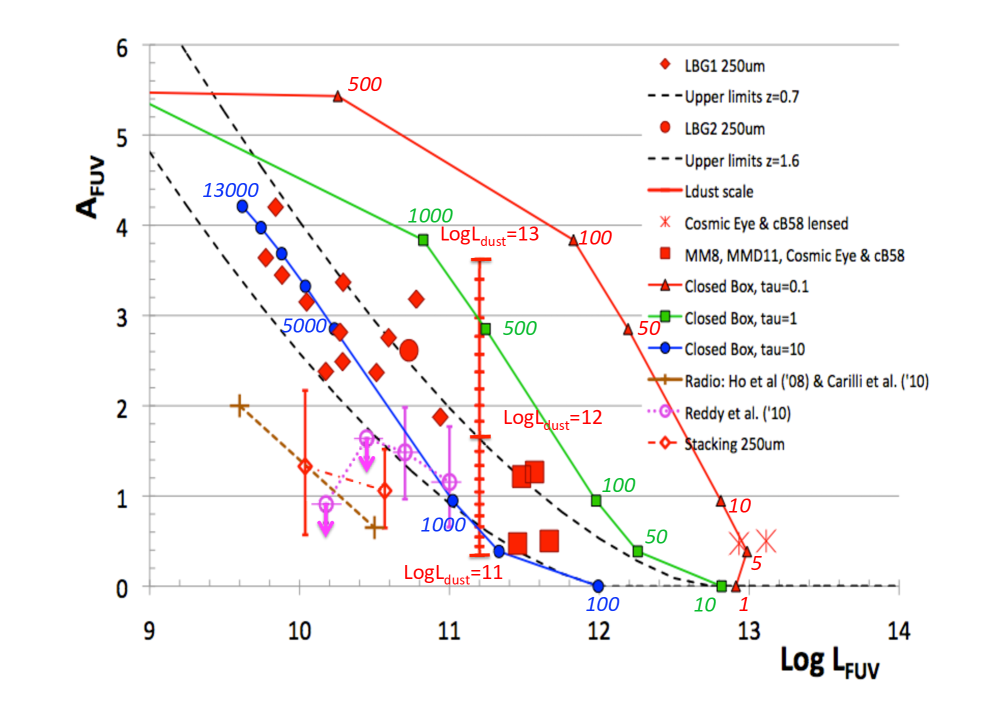
For the LBGs not detected by Herschel, we can estimate upper limits of ) for each SPIRE band and we use the lowest of the three values as the the final upper limit on . From ) we can estimate . Fig. 4 suggests that the maximum level of attenuation depends on – the most UV-luminous LBGs yield a lower maximum than less UV-luminous ones. This is true for upper limits as well as for detections. The two higher redshift lensed LBGs detected in FIR or in sub-mm (the “Cosmic Eye”, Siana et al. 2009 and cB58, Siana et al. 2008) also comply with this upper boundary, if we correct for the amplification. As do the two unlensed LBGs MM8 (Chapman et al., 2000) and MMD11 (Chapman & Casey, 2009). We stress that most of the upper limits should populate the area below the observational limits but none would prevent us from detecting LBGs that would have larger FUV dust attenuations than the one suggested by the present data for a given .
Reddy et al. (2010) suggest that objects with a lower UV luminosity at have lower bolometric luminosities than UV-bright galaxies which, in turn, may suggest lower dust attenuations if we account for the relation between bolometric luminosities and dust attenuations. This is in agreement with Bouwens et al. (2010) at much higher redshifts. But, when computing AFUV from the stacked points of Reddy et al. (2010), we find a trend similar to ours for most of the points. Carilli et al. (2008) and Ho et al. (2010) estimate the UV dust attenuation by comparing radio-based star formation rates to UV-based ones using a stacking analysis. We show Fig. 4, the two points corresponding to different and they agree with the above trend. Burgarella et al. (2006) reached a similar conclusion using Spitzer m observations of a sample of LBG at . Finally, we have divided our sample in two sub-samples as a function of LFUV and stacked them in the 250 image (Fig. 4). We find the same trend, again. Note, however, that accounting for the error bars, our stacking and Reddy et al. (2010),’s are both consistent with a constant . Also, whenever the selection is not fully complete, one may miss objects in the regions where the brightest sources (UV and IR) lie. This effect due to the inhomogeneous background produces holes in the stacking (see e.g. Bavouzet 2008). For this very reason, the z 1 stacked points are only considered as lower limits and we were not able to stack z 2 LBGs.
To understand the origin of this effect, we build a simple closed box model (see Pagel et al. 1997), assuming several exponentially decreasing star formation histories , with = 0.1, 1 and 10 Gyr. We assume a mass of cold gas that forms stars following a Salpeter initial mass function, and thus produce heavy elements. evolves as follows:
| (3) |
where is the mass ejected by stars at the end of their lifetime.
The oxygen abundance can be estimated as
| (4) |
where is the oxygen yield and is the fraction of mass kept in stellar remnants. We estimate an empirical relation from Reddy et al. (2010) that links to :
| (5) |
Reddy et al. (2010)’s objects are in the redshift range , so very close to ours and with metallicities in the range 8.2 12/log(O/H) 8.8 which corresponds to ages in the range of a few 100 Myrs to 5 Gyrs. So, strictly speaking, our models are extrapolations for low ’s but are in the good range for = 10 Gyrs. Finally, from we compute using the relationship from Burgarella, Buat, & Iglesias-Páramo (2005).
Fig. 4 shows that this simple closed box model follows the same trend as our LBGs in the diagram. The initial mass of gas is set to to explain the low redshift LBGs and (not plotted) for the high redshift LBGs. This is in agreement with the mass of cold gas predicted by models (e.g., Lacey et al., 2011). We find that star-formation timescales of Gyr seem to be ruled out by this model.
4. Conclusions
We have selected two samples of LBGs at and . For the first time, we can put constraints on the dust emission and therefore the dust attenuation of LBGs directly from rest-frame FIR measurements of individual LBGs observed with Herschel-SPIRE. Two main conclusions can be drawn from this analysis.
We detected 12/260 4.6% and 1/1558 0.06% of the LBGs at and , respectively. All the other LBGs are undetected by SPIRE, and their dust attenuation is lower than the detected LBGs.. However, we have to account for the fact that the limits depend on .
Secondly, the maximum dust attenuation in the FUV decreases as UV luminosities increase.
Other points of interests are:
-
•
The dropout selections presented in this paper are very efficient (95%) at detecting galaxies in the redshift range .
-
•
The rest frame UV SEDs of the two dropout samples are similar to higher redshift LBGs.
-
•
cigale is able to model the observed SEDs from the FUV to the radio and we provide the derived physical parameters.
-
•
The stellar masses of these IR-bright dropout galaxies are of the same order as the stellar masses of IR-bright LBGs observed in IRAC and MIPS bands.
-
•
We propose that all LBGs lie in a triangle-shaped region in the vs. diagram limited by dust-free (small and/or young) galaxies to the bottom and by the locus for evolving most massive galaxies to the top.
References
- Arnouts et al. (2002) Arnouts S., Moscardini L., Vanzella E., Colombi S., Fontana A., Giallongo E., Matarrese S., Saracco P., 2002, A& A 329, 355
- Barger, Cowie, & Wang (2008) Barger A.J., Cowie L.L., Wang W.-H., 2008, ApJ, 689, 687 Schaerer D., Pelló R., Combes F., Egami E., 2007, A&A, 475, 513 Boselli A., Gavazzi G., Sanvito G., 2003, A&A, 402, 37
- Bavouzet (2008) Bavouzet, N., 2008, http://tel.archives-ouvertes.fr/index.php?halsid=h876uaf6oo0uo8vm9ui00brvn6&view_this_doc=tel-00363975&version=1
- Brisbin et al. (2010) Brisbin D., , the HerMES consortium, 2010, MNRAS, submitted
- Buat & Xu (1996) Buat, V., Xu, C., 1996, A&A 306, 61
- Burgarella, Buat, & Iglesias-Páramo (2005) Burgarella D., Buat V., Iglesias-Páramo J., 2005, MNRAS, 360, 1413
- Burgarella et al. (2007) Burgarella, D., Le Floc’h, E., Takeuchi, T.T. 2007, MNRAS, 380, 986
- Burgarella et al. (2006) Burgarella, D., et al. 2006, A& A, 450, 69
- Burgarella et al. (2009) Burgarella D., Buat V., Takeuchi T.T., Wada T., Pearson C., 2009, PASJ, 61, 177
- Bouwens et al. (2010) Bouwens R.J., et al., 2010, ApJ 708, 69
- Capak et al. (2004) Capak P., et al., 2004, AJ, 127, 180
- Carilli et al. (2008) Carilli C.L., et al., 2008, AJ, 689, 883
- Chapman et al. (2000) Chapman S.C., Scott D., Steidel C.C., Borys C., Halpern M., Morris S.L., Adelberger K.L., Dickinson M., Giavalisco M., Pettini M., 2000, MNRAS, 319, 318
- Chapman & Casey (2009) Chapman S.C., Casey ., 2009, MNRAS398, 1615
- Chary & Elbaz (2001) Chary R., Elbaz D., 2001, ApJ 556, 562
- Calzetti et al. (2000) Calzetti D., Armus L., Bohlin R.C., Kinney A.L., Koornneef J., Storchi-Bergmann T., 2000, ApJ, 533, 682
- Dale & Helou (2002) Dale, D.A. , Helou, G. 2002, ApJ, 576, 159
- Griffin et al. (2010) Griffin, M. et al, A&A 518, L3
- Hatziminaoglou et al. (2010) Hatziminaoglou E., et al., 2010, A& A 518, L33
- Ho et al. (2010) Ho I.T., et al., 2010, ApJ 722, 1051
- Huang et al. (2009) Huang J.S., et al., 2009, ApJ 712, 1010
- Ilbert et al. (2009) Ilbert O., et al., 2009, ApJ, 690, 1236
- Lacey et al. (2011) Lacey C.G., Baugh C.M., Frenk C.S., Benson A.J. 2011, MNRAS (in press, arXiv1004.3545)
- Magdis et al. (2010) Magdis G.E., Elbaz D., Daddi E., Morrison G.E., Dickinson M., Rigopoulou D., Gobat R., Hwang H.S., 2010, ApJ, 714, 1740
- Maraston (2005) Maraston C., 2005, MNRAS, 362, 799
- Meurer, Heckman, & Calzetti (1999) Meurer G.R., Heckman T.M., Calzetti D., 1999, ApJ, 521, 64
- Morrison et al. (2010) Morrison et al. 2010 ApJ 188, 178
- Noll et al. (2009) Noll S., Burgarella D., Giovannoli E., Buat V., Marcillac D., Muñoz-Mateos J.C., 2009, A&A, 507, 1793
- Oliver et al. (2010) Oliver S.J., et al., 2010, A& A , 518, L21
- Oliver et al. (2010b) Oliver et al., 2010, in prep.
- Pagel et al. (1997) OPagel B.E.J., 1997 ”Nucleosynthesis and Chemical Evolution of Galaxies”, Cambridge Univ. Press (ISBL 0521550610)
- Nguyen et al. (2010) Nguyen et al., 2010, A & A 518, L5
- Reddy et al. (2010) Reddy et al., 2010, ApJ 712, 1070
- Pilbratt et al. (2010) Pilbratt et al. A&A 518, L1
- Roseboom et al. (2010) Roseboom, I. et al, 2010, MNRAS 409, 48
- Shapley et al. (2003) Shapley A.E., Steidel C.C., Pettini M., Adelberger K.L., 2003, ApJ, 588, 65
- Siana et al. (2009) Siana B., et al., 2009, ApJ, 698, 1273
- Siana et al. (2008) Siana B., et al., 2008, ApJ, 689, 59
- Steidel et al. (1996) Steidel C.C., Giavalisco M., Pettini M., Dickinson M., Adelberger K.L., 1996, ApJ, 462, L17
- Stetson (1987) Stetson P.B., 1987, PASP, 99, 191