The Australia Telescope Compact Array Broadband Backend (CABB): Description & First Results††thanks: The Australia Telescope Compact Array is part of the Australia Telescope National Facility which is funded by the Commonwealth of Australia for operation as a National Facility managed by CSIRO.
Abstract
Here we describe the Compact Array Broadband Backend (CABB) and present first results obtained with the upgraded Australia Telescope Compact Array (ATCA). The 16-fold increase in observing bandwidth, from MHz to MHz, high bit sampling, and addition of 16 zoom windows (each divided into a further 2048 channels) provide major improvements for all ATCA observations. The benefits of the new system are: (1) hugely increased radio continuum and polarization sensitivity as well as image fidelity, (2) substantially improved capability to search for and map emission and absorption lines over large velocity ranges, (3) simultaneous multi-line and continuum observations, (4) increased sensitivity, survey speed and dynamic range due to high-bit sampling, and (5) high velocity resolution, while maintaining full polarization output. The new CABB system encourages all observers to make use of both spectral line and continuum data to achieve their full potential.
Given the dramatic increase of the ATCA capabilities in all bands (ranging from 1.1 to 105 GHz) CABB enables scientific projects that were not feasible before the upgrade, such as simultaneous observations of multiple spectral lines, on-the-fly mapping, fast follow-up of radio transients (e.g., the radio afterglow of new supernovae) and maser observations at high velocity resolution and full polarization. The first science results presented here include wide-band spectra, high dynamic-range images, and polarization measurements, highlighting the increased capability and discovery potential of the ATCA.
keywords:
radio astronomy instrumentation, signal processing, correlator, interferometry, spectral line and continuum observations, calibration and data reduction, galaxies, H ii regions, masers, protoplanetary disks, pulsars, quasars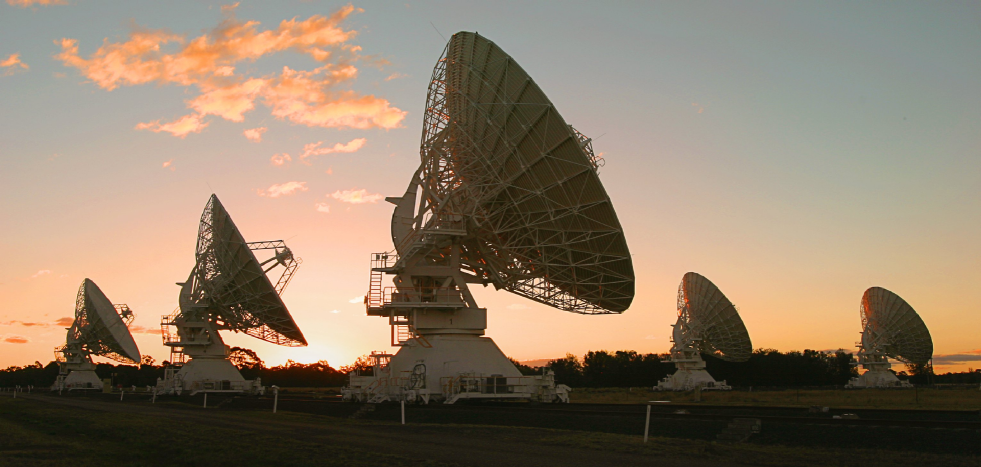
1 Introduction
The Australia Telescope National Facility (ATNF) provides open access to a large range of radio telescopes: the 64-m Parkes telescope, the Australia Telescope Compact Array (ATCA), the 22-m Mopra telescope, and the Long Baseline Array (LBA); see Frater, Brooks & Whiteoak (1992). Furthermore, CSIRO’s ‘Australian SKA Pathfinder’ (ASKAP), consisting of -m dishes, is currently under construction in Boolardy, Western Australia. With its expected 30 square degrees field of view at 1.4 GHz, provided by novel phased array feeds, ASKAP will be a fast 21-cm survey machine, designed to carry out large-scale H i spectral line, transients and radio continuum surveys of the sky (Johnston et al. 2007, 2008).
In this paper we focus on the ATCA and its recent upgrade in bandwidth from MHz to MHz. While greatly increasing the sensitivity of continuum and spectral line observations (a factor 16 in bandwidth gives a factor four in continuum sensitivity) or, alternately, reducing the required observing time for a given continuum sensitivity by a factor 16, this upgrade also enables simultaneous (full Stokes) multi-line observations, on-the-fly mapping, as well as searching for emission and absorption lines over large velocity ranges. The high-bit sampling further improves sensitivity, mapping speed and dynamic range for radio frequency interference (RFI) suppression.
1.1 The Australia Telescope Compact Array
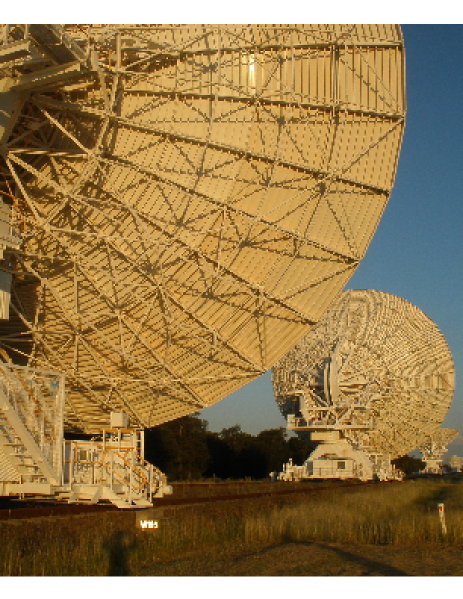
The ATCA is a radio interferometer consisting of six 22-m dishes (Frater &
Brooks 1992), creating 15 baselines in a single configuration. While five
antennas (CA01 to CA05) are movable along a 3-km long east-west track and
a 214-m long north-south spur (see Figs. 1 & 2), allowing the creation of
hybrid arrays111The ATCA hybrid configurations (H75, H168, H214)
provide excellent -coverage over a 6-h integration time, thereby
avoiding the need to observe astronomical sources at low elevations
(highly beneficial for mm-wave observations where the earth atmosphere
adds substantially to the system temperature and consequently the r.m.s.
noise).,
one antenna (CA06) is fixed at a distance of 3-km from the western end of the
track. Each antenna currently has a set of six cryogenically cooled low noise
receivers sampling the frequency range from 1.1 to 105 GHz (i.e., wavelengths
from 3-mm to 30-cm), apart from CA06 which does not have a 3-mm receiver
system (see Table 1). — A comprehensive description of aperture synthesis
and radio interferometry techniques is given in the expert lectures at the
regularly held Radio Synthesis Schools (e.g., Perley, Schwab & Bridle 1988,
and Taylor, Carilli & Perley 1998) and also Thompson, Moran, & Swenson
(2002).
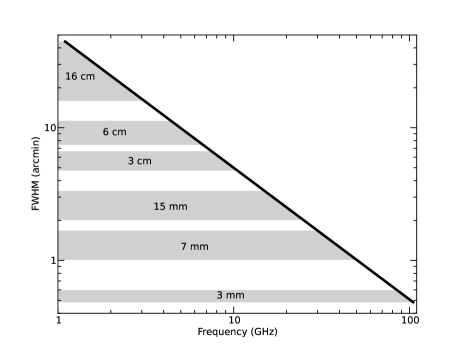
In their overview of the Australia Telescope, Frater, Brooks & Whiteoak (1992) stated the aim to operate the array in ten frequency bands, from 0.3 to 116 GHz. Initially, four bands (1.5, 2.3, 5.0 and 8.6 GHz) were available (James 1992; Sinclair et al. 1992) delivering excellent science (Ekers & Whiteoak 1992). The first stage of the millimeter-wave upgrade (Hall et al. 1997; Koribalski 1997, Brooks et al. 2000) added receivers at 15 – 25 GHz (15-mm), 30 – 50 GHz (7-mm) and 85 – 105 GHz (3-mm); for details see Gough et al. (2004) and Moorey et al. (2008). A further extension of the highest frequency band to 77 – 117 GHz (as already available on the 22-m Mopra antenna; Moorey et al. 2006) is desirable in the future. In 2010 the 1.5 GHz (20-cm) and 2.3 GHz (13-cm) bands were combined into one broad band covering the frequency range from 1.1 to 3.1 GHz (effectively 10 – 30-cm, now referred to as the 16-cm band). See Table 1 for a summary of some basic ATCA properties. Because the ATCA system temperature and primary beam FWHM vary significantly across the available frequency range, these are shown in Figs. 3 & 4.

| ATCA observing bands | 16-cm⋆ | 6-cm | 3-cm | 15-mm | 7-mm | 3-mm |
|---|---|---|---|---|---|---|
| (L/S) | (C) | (X) | (K) | (Q) | (W) | |
| frequency range [GHz] | 1.1 – 3.1 | 4.4 – 6.7 | 7.5 – 10.5 | 15 – 25 | 30 – 50 | 85 – 105 |
| number of antennas | 6 | 6 | 6 | 6 | 6 | 5 |
| number of baselines | 15 | 15 | 15 | 15 | 15 | 10 |
| primary beam FWHM | 44′– 16′ | 107 – 74 | 63 – 51 | 2′ | 70″ | 30″ |
Notes: ATCA observing information can be found at www.narrabri.atnf.csiro.au/observing, including a link to the CABB Sensitivity Calculator which is highly recommended to obtain observing characteristics (e.g., ) at specific frequencies and correlator settings (see also Fig. 3). The ATCA primary beam size (in arcmin) can be approximated by where is the observing frequency in GHz; the miriad task pbplot provides details of the primary beam model (see Fig. 4). ⋆ In 2010 the 1.5 GHz (20-cm) and 2.3 GHz (13-cm) bands were combined into one broad band covering the frequency range from 1.1 to 3.1 GHz (now referred to as the 16-cm band). Note that the 3- and 6-cm bands can be used simultaneously.
In this paper, we describe the design and construction of the Compact Array
Broadband Backend (CABB), the first observational results, and the scientific
potential of the upgraded instrument. The sections are as follows:
(2) CABB overview,
(3) CABB design,
(4) CABB installation and operations,
(5) CABB data reduction software,
and (6) first CABB results.
The design and construction of other correlators for radio interferometers such as Expanded Very Large Array (EVLA) and ASKAP are described in the respective overview papers by Perley et al. (2009) and DeBoer et al. (2009). SKA correlator advances are discussed by Bunton (2005) and software correlators by Deller et al. (2011).
2 CABB Overview
The Compact Array Broadband Backend (CABB) upgrade, described here, has provided a new wide-bandwidth correlator for the ATCA, which is significantly more versatile and powerful than the original correlator (Wilson et al. 1992).
The maximum bandwidth of the ATCA has been increased from 128 MHz to 2 GHz (dual polarization) in each of two independently tunable intermediate frequency (IF) bands, while CABB also increased the velocity resolution and delivers full Stokes parameters in all observing modes. Furthermore, the digitisation level has improved from 2-bits to 9-bits, increasing correlator efficiency and consequently lowering . In the following we list the advances provided by the new system.
-
•
The correlator is supplied with an 8 GHz wide IF band from the front-end. Within this, the observer can tune (within the receiver limits, see Table 1) two independent 2048 MHz windows (dual polarization) for correlation. This represents a factor of at least 16 increase in the useable bandwidth over the original ATCA correlator. Each 2 GHz window can be split into 2048, 512, 128, or 32 primary channels (see Table 2).
-
•
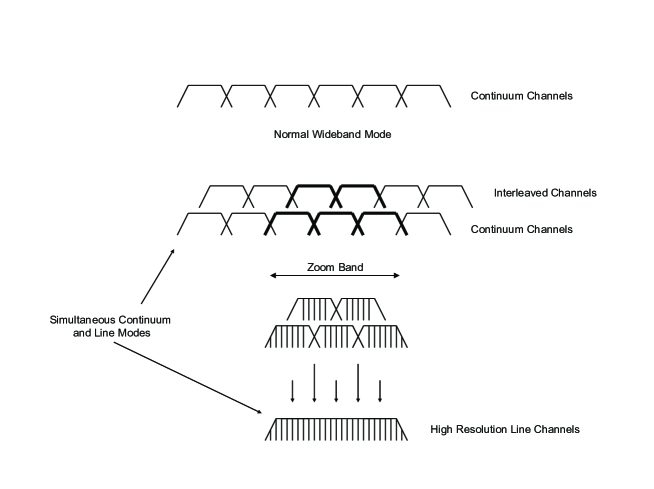
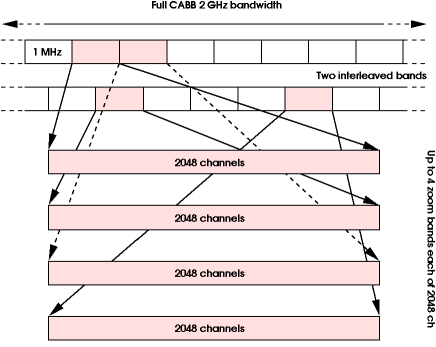
Up to 16 high velocity resolution zoom windows can be placed anywhere within each 2048 MHz band. Each zoom window covers the width of one ”continuum channel” in the primary band and further splits it into 2048 high-resolution spectral channels (as illustrated in Fig. 9). Basic correlator configurations are listed in Table 2.
-
•
CABB combines high spectral resolution with full Stokes imaging, e.g., needed for the study of Zeeman splitting in masers. All Stokes parameters are computed by the new correlator in all available modes. The original ATCA correlator was unable to provide cross-polarization correlations when used in modes with high spectral resolution.
-
•
Sampling resolution and digitisation accuracy has increased from 2-bits with the original correlator (Wilson et al. 1992) to 9-bits with CABB (see § 3.2), increasing the correlator efficiency from 0.88 to 1 (i.e., reducing the ATCA by 14%), the dynamic range and tolerance to radio frequency interference (RFI).
-
•
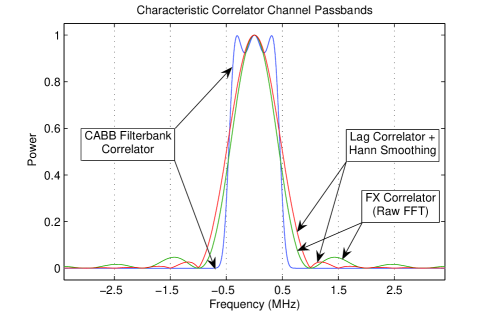
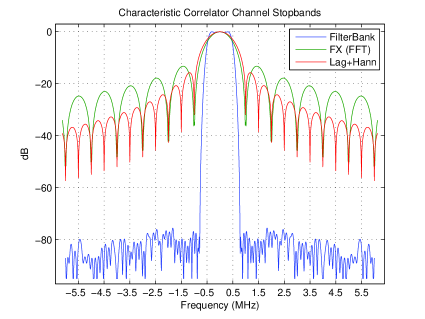
Internally, CABB constructs a polyphase filter bank, providing spectral channels that are largely independent with 80 dB isolation from adjacent channels. This avoids the ringing that was commonly seen with the original ATCA and other correlators while observing narrow spectral lines.
-
•
Modes providing high velocity resolution (for spectral line studies), high time resolution (for the study of fast transients), or pulsar binning come as an addition to the basic wide-bandwidth modes.
-
•
CABB also provides auto-correlation data.
| configuration | channel width | |
|---|---|---|
| primary band | secondary band | |
| CFB 1M–0.5k | 1.0 MHz | 0.488 kHz |
| CFB 4M–2k | 4.0 MHz | 1.953 kHz |
| CFB 16M–8k | 16.0 MHz | 7.812 kHz |
| CFB 64M–32k | 64.0 MHz | 31.250 kHz |
These improvements have a major impact on the scientific ability of the ATCA (see examples in § 6), including the following:
-
•
the much larger bandwidth reduces the time required to reach any particular continuum sensitivity, and the increased sampling depth allows for higher dynamic range and lower ;
-
•
narrow, independent channels allow for precise excision of narrowband interference;
-
•
the division of the primary IF bands into a large number of channels substantially improves the -coverage for any single observation when multi-frequency synthesis is used (see § 5.4);
-
•
at low frequencies (1 – 10 GHz), CABB’s large fractional bandwidth makes it possible to study the spectral behaviour of continuum sources without resorting to frequency switching (see § 6.7);
-
•
at high frequencies (16 – 105 GHz), CABB’s large frequency coverage allows projects to simultaneously observe multiple spectral lines that fall within 8 GHz of each other; it also provides broad velocity coverage to carry out reliable searches for molecular lines at high redshifts (see § 6.9);
-
•
the CABB zoom modes enable simultaneous observations of multiple spectral lines at high velocity resolution (see § 6.3);
-
•
the CABB zoom channels can also be concatenated to provide a wide velocity range, while maintaining high velocities resolution (see § 6.5);
-
•
the correlator can be configured to provide the most suitable compromise of sensitivity, speed and resolution for any particular observation. This is achieved by varying the width of each channel in the primary bands (see Table 2).
3 CABB System Design
The two main objectives of the ATCA broadband upgrade were to increase the sensitivity and versatility of the instrument while providing a test-bed for technologies which were judged to be important in the development of the Square Kilometre Array (SKA). The improvement in sensitivity was achieved by increasing the maximum available bandwidth from 128 MHz to 2.048 GHz. A Field Programmable Gate Array (FPGA) based correlator gave the required versatility, with its capability of being configured into many different operating modes. An important goal was to improve the spectral line capability of the instrument, particularly at the higher observing frequencies. Technologies employed, such as multi-bit digitising, high bandwidth digital data transfer over fibre optic cables, and advanced signal processing, were all considered to be applicable to the SKA.
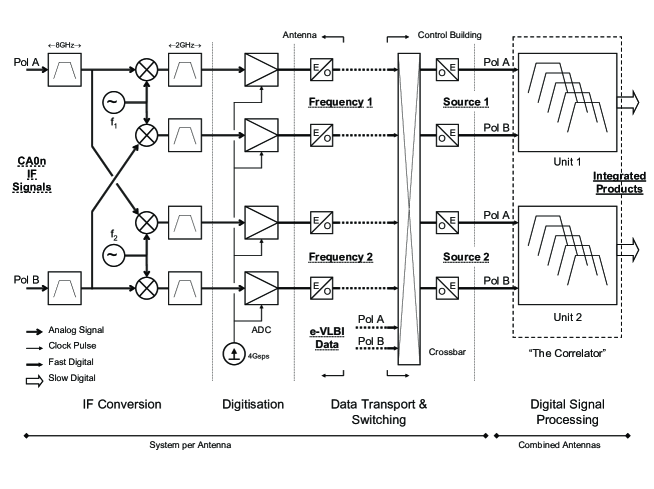
The first stage of the CABB backend selects two independently tuneable 2 GHz bands from the active receivers. Two orthogonal linear polarizations are available from each band. The four resulting 2 GHz wide IF bands are digitised and sent over fibre optic cables to the central control building. Here they enter the correlator, where the online signal processing takes place. A block diagram of the system is shown in Fig. 5, and details of the signal path and the processing are described in the following sections.
Associated analogue-to-digital conversion (ADC) requirements are pushing the limits of high-speed sampling and quantisation techniques. Nine bit data samples and 17-bit (minimum) internal signal paths through to the integrators provide performance approaching analogue correlation but with the obvious advantages of digital processing. Combined with excellent channel selectivity the system is significantly more robust against strong interference than 2-bit correlators (Ferris & Wilson 2002).
These new technologies are direct candidates for signal processing on the
proposed Square Kilometre Array (SKA) and its precursors, such as ASKAP, the
Australian SKA Pathfinder. CABB includes a total of eight antenna ports,
allowing two antennas to be added to the existing six antennas of the ATCA,
providing both a more powerful instrument and a mature test bed for the SKA
pathfinders.
In the following we describe the IF conversion system (§3.1), the digitisers and data transmitters (§3.2), data transport and reception (§3.3), the digital filter bank correlator (§3.4), the signal processing (§3.5), the correlator hardware implementation (§3.6), the rear transmission module (§3.7), the front board (§3.8), and the control software (§3.9). In §3.10 we briefly look at the role of CABB in demonstrating novel technologies for SKA. The last sub-section (§3.11) gives an overview of the CABB installation.
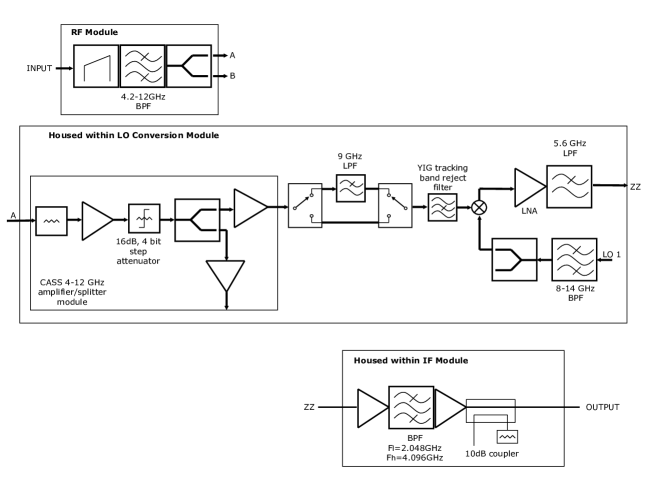
3.1 IF conversion system
The modular CABB IF conversion system resides in a shielded rack at the vertex of each antenna of the ATCA. The functionality of this system (see Fig. 6) includes primary band filtering 4.2 to 12 GHz, stepped level control of 16 dB, sub-band selection for image management and frequency translation to suit the digitiser requirement. Definition of the IF band is achieved by anti-aliasing filters covering 2.048 to 4.096 GHz, corresponding to the second Nyquist zone of the analog to digital converter.
The signal flow in Fig. 6 indicates the fundamental elements, which were selected with a significant emphasis on low cost where possible and the reuse of ATNF designed assemblies. Each input pair (two polarizations) is passively split allowing for two discretely tuneable 2 GHz wide slices of the incoming primary signals. The assembly is physically divided into three sections, the radio frequency (RF) module, the conversion module, and the intermediate frequency (IF) module, briefly described below:
-
•
Primary band filtering, loss slope equalisation and passive power splitting is achieved in the RF module.
-
•
Slope compensated low noise amplification, digitally controlled step attenuation, image suppressing sub-band selection, and frequency translation are achieved in the signal processing part of the conversion module. Support for maintenance is provided by low level monitoring outputs. Suppression of potential local oscillator (LO) leakage contamination from the split frequency design is provided by both fixed and tracking filtering. The provision of a YIG (yttrium iron garnet) tracking LO rejection filter is only made tractable by the integrated tuning management incorporated into the optically slaved LO system (see below).
-
•
The IF module provides slope compensated amplification, low level monitoring outputs and anti-aliasing band filtering.
In an effort to minimise the impact on system stability when moving to the increased fractional bandwidth required by CABB, a newly conceived and designed group of filters following a castellated wall ridged waveguide topology (Bowen et al. 2010) were used. These filters have low insertion loss, low sensitivity to temperature change and high component repeatability. They are used in the primary input filtering, LO noise filtering and the IF anti-aliasing filter.
Two central site reference frequencies, each in the range of 8 to 14 GHz, are transmitted to each antenna via separate intensity modulated optical fibre links. The antenna YIG oscillators are then offset phase locked to the optical references. The specific choice in YIG oscillators for the frequency conversion was heavily biased toward oscillators having low in-band phase noise and very low broadband noise in order to limit the coherent noise contamination seen at the IF.
The system’s dynamic range suffers as a result of the need to place a hard bound on the IF module’s saturated output power level to prevent degradation or destruction of the digitisers. The original low-end specification of the primary band was modified from 4 to 4.2 GHz due to excessive direct leakage into the output band. Triple balanced mixers were chosen due to their enhanced leakage suppression and lower spur product generation to further reduce spurious signal generation.
3.2 Digitisers and Optical Data Transmission
A major innovation required to realise the CABB specifications was the development of an analogue-to-digital converter (ADC; see Fig. 7) capable of supporting the 4.096 Gigasamples/s (GS/s) rate required for processing the 2.048 GHz of bandwidth demanded by the upgrade. The project ambitiously aimed to implement quantising at bit levels significantly higher than those traditionally undertaken in radio astronomy correlators. Typically, two bit sampling has been used. The major goal was to allow for faithful handling and removal of RFI in the signal processing as well as increased sensitivity. There were no commercially available ADC devices that met these specifications at the time the design commenced.
The need for high dynamic range, mostly due to RFI (but also required for deep fields or in the vicinity of extremely strong radio sources) makes it necessary to use sampling at high bit levels. In the noise dominated case (i.e., classical astronomical observation), the loss due to 2-bit (4-level) quantisation is large (Van Vleck & Middleton 1966; Cooper 1970), leading to a significant (14%) increase of the system temperature, . A high resolution digitiser with sufficient bits can be operated with negligible increase of , i.e. the correlator efficiency is 1.
The solution was to develop an ADC subsystem composed of two commercial 2 GS/s 10-bit ADC chips operated in an interleaved fashion. The same input is distributed to the two converters with their sampling times in precise anti-phase, to give an equivalent 4.096 GS/s 10-bit converter. This requires extremely tight matching of the two channels in terms of sampling phase, gain, bandwidth, and DC offset. High resolution calibration and trimming circuitry that can control these parameters to the level required has been incorporated on the board, and algorithms developed to automatically measure, and adjust, these trims in real time. Experience has shown that the system stability is such that only a single calibration is required. The board and ancillary systems are housed in a module that is located in each antenna’s shielded rack.
Performance achieved over the 2.048 to 4.096 GHz CABB IF band at full sampling rate is a signal-to-noise ratio of typically 38 dB, equivalent to approximately six effective digitiser bits, and spurious free dynamic range of 39 dB.
In addition to analogue-to-digital conversion the CABB ADC/Data Transmitter module performs framing and transmission of the ADC data. It takes the 40 Gigabits/second (Gbits/s) of data from the digitiser and frames it into four 10 Gbits/s serial data streams which are passed to laser driver chips driving externally modulated lasers at four different optical wavelengths. These are wavelength division multiplexed onto a single fibre for transport from the antenna to the central control building. Of the ten bits of sampled data, nine bits are transported over the link. The remaining link overhead is used for implementing a custom synchronisation and timing protocol that enables each of the 10 Gbits/s data streams to be re-aligned and allows precise tracking of the delays on each path back to the control building.
The digitiser/transmitter module has been designed to be as general as possible to allow it to be used in other applications apart from the CABB upgrade. It has, for example, been used as two independent 1 GHz bandwidth ADCs in the ATNF Pulsar Digital Filterbank systems at the Parkes 64-m telescope (Manchester et al. 2010), for radio transient detection experiments222During the CABB development phase (before March 2009), three antennas of the ATCA were used to hunt for ultra-high energy (UHE) neutrinos using the lunar Cherenkov technique. For details of the LUNASKA experiments see James et al. (2010) and McFadden et al. (2008). By-passing the original ATCA IF system, the teams obtained 600 MHz of bandwidth in the then available 20-cm band (1.2 to 1.8 GHz). Each polarised data stream was fed through an analogue de-dispersion filter (Roberts & Town 1995) before being sampled by the CABB ADC board at 2 GS/s with 8-bit effective precision. with both Parkes and the ATCA and as an RFI transient detector at the ASKAP Boolardy site.
3.3 Data Transport and Reception
The digitised data are transported to the correlator in the central control building via a single optical fibre feed from each digitiser. Each optical fibre carries four ’colours’ at the 200 GHz ITU frequencies of 193.8 THz, 193.6 THz, 193.4 THz and 193.2 THz. Each laser is co-packaged with an electro-absorption modulator and is intensity modulated at 10 GBits/s.
In the central control building, the four colours on each fibre are de-multiplexed and each optical signal is then detected by a Receive Optical Sub-Assembly (ROSA) which incorporates a PIN detector and a transimpedance amplifier. The electrical outputs to the correlator are Current Mode Logic differential signals. The ROSAs are part of the Rear Transition Module (RTM), which forms the interface between the fibre transmission and the correlator. The RTM is described in more detail below.
3.4 The Digital Filter Bank Correlator
The central feature of CABB is the FX-type spectroscopic correlator. Its design supports primary channelisation with 1, 4, 16 and 64 MHz resolution consistent with science requirements across the ATCA input frequency range of 1.1 to 105 GHz. For each frequency channel on each baseline the four cross-products of the two polarizations are formed. Also, for each frequency channel and for each antenna the two polarization auto-correlations and the cross-polarization product are formed, including a facility for synchronous extraction of a switched calibration signal. The latter is injected coherently into the orthogonal linear polarised receivers for polarization calibration. All products are always available across the full 2.048 GHz signal bandwidth.
At the same time up to 16 zoom windows (channels) at the primary resolution bandwidth, but half its channel spacing, may be selected for secondary processing into 2048 channels each. Again, all four polarization products are recorded. The available configurations are shown in Table 2. When two or more adjacent zoom windows are chosen, they are aggregated to provide a seamless high resolution spectrum across their net bandwidth. Passband ripple from the primary filter bank is automatically removed. This system provides for the simultaneous observation of multiple widely spaced spectral lines, plus the underlying continuum. An example of a zoom band setup is shown in Fig. 9.
Antenna signals with the primary channelisation may also be formed into beams for VLBI, pulsars, spacecraft tracking, etc., with the native linear polarizations added in quadrature to provide circular polarizations as required.
There are two such correlator units, one for each of the ATCA’s independently tuneable observing frequencies. Where the front-end bandwidth allows, observations at full specifications across a total of 4 GHz are possible. Alternatively the units may be tuned to the same input frequency to repeat the observation with a different set of correlator configuration parameters.
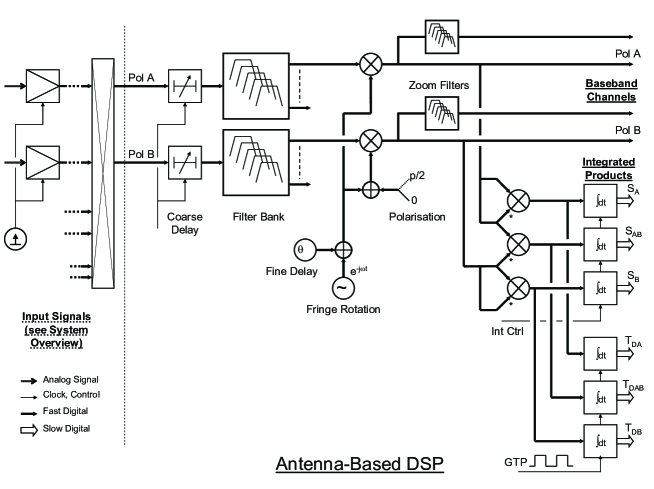
3.5 Signal Processing
The essential structure of the correlator signal path is shown in Figs. 10 & 12. Beginning with high resolution IF data from the ADCs, the bulk of the geometric delay is removed to the nearest sample time in the ‘Coarse Delay’ units. The 2 GHz wide signals are then analysed into many baseband channels as per Table 2 in the primary polyphase digital filter banks (PDFBs). The flat-topped, sharp cut-off, deep ( dB) stopband filter shape achieved (see Fig. 11) far exceeds the requirements of good measurement. Its purpose is to prevent the spread of strong RFI from channel to channel. The filter banks output only the positive frequency signal components to make subsequent processing easier.
 |
 |
Fringe rates are stopped on a per channel basis. Since the channel bandwidths are much smaller than their centre frequency on the sky, the timing residuals left by the ‘Coarse Delay’ are manifest as all but constant phase shifts. This is accurately removed by adding an offset, ‘Fine Delay’, to the fringe phase. An additional /2 can be added to the B polarization phase whenever necessary to generate circularly polarised beams in the beam formers.
After the ‘Fringe Rotators’ the signals are wavefront-aligned at all frequencies across all antennas. At this point (see Fig. 10) the user-selected subset of primary channels is fed to narrow band PDFBs to produce the high resolution zoom channels. The antenna auto-correlations and X/Y phases333Instrumental phase difference between X and Y polarization channels are also formed, using synchronous integration to extract the signature of the low-level switched noise diode calibration signal which is injected into the receiver horn. These signals are used to monitor and refine system calibration.
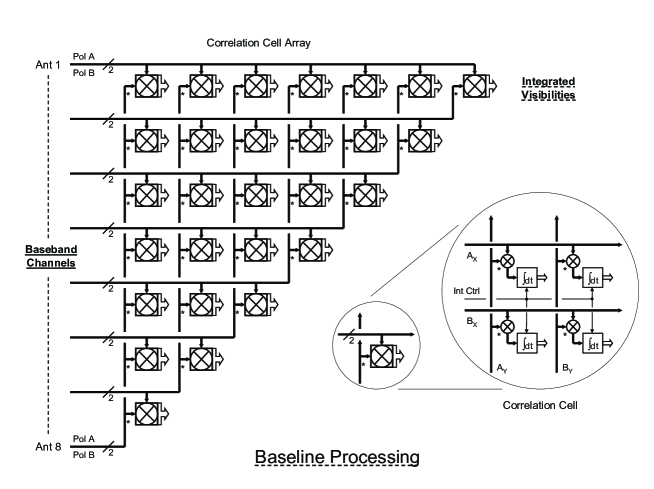
Baseband channels from all antennas are brought together in the ‘Correlation Cell Array’ (see Figure 12). In each cell the signals from one antenna are multiplied by the conjugate of the corresponding signals from another antenna, and the products integrated in simple accumulators. All four possible products are formed. Thus each cell computes the complex visibilities for one baseline. These are normally unloaded at ten second intervals, but shorter integration times are supported (110ms in pulsar binning mode and 20ms in high time resolution). Zoom channel processing follows the same form and is synchronised with the primary channels so that all output data have the same epoch.
Signals from all antennas can be added to produce phased array beams, with the option of applying complex weights to steer the beam around within the primary antenna pattern. The resulting signals are available outside the correlator for processing in other equipment.
The digital signal path begins with 9-bit ADC data, and word size expands with natural growth plus the addition of guard bits. There is no clipping or re-quantisation, and noise addition due to rounding and aliasing is carefully controlled. The dynamic range of the ADC is preserved so that expected variations in system temperature, front-end passband slope and ripple, and strong astronomical sources are accommodated without resort to gain control or nonlinear correlation corrections, and there is still headroom to tolerate RFI without distortion or compression.
The combination of high dynamic range in the time domain and high selectivity in the filter bank (see Fig. 11) ensure robustness against RFI. This linear, stationary signal path will provide an ideal platform for future RFI removal instigations (Ekers & Bell 2001).
Contrary to tradition there is no ‘Correlator Chip’ ASIC in this design. Instead all signal processing takes place in FPGAs wherein ready access to a very high density of logic resources allowed the development of an instrument with a level of sophistication unattainable in a hard-wired circuit. In addition, flexibility through reprogrammability has supported progressive development with evaluation on telescopes, multiple independent configurations (listed in Table 2), a shift from one generation of FPGAs to the next to take advantage of the latest technology, and the spinoff of several related but distinct instruments. Separating the signal processing from the hardware also allowed the parallel and largely independent development of the latter, a significant engineering project in its own right. A by-product of this flexibility has been the complexity of modes which are possible, leading to an increase in time needed for testing and commissioning.
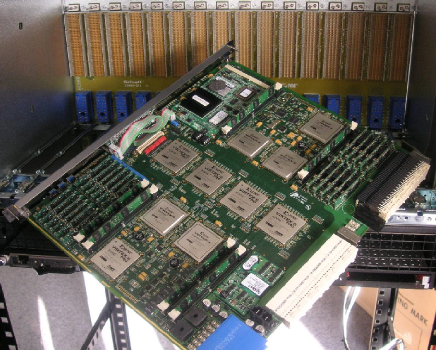
3.6 Correlator Hardware Implementation
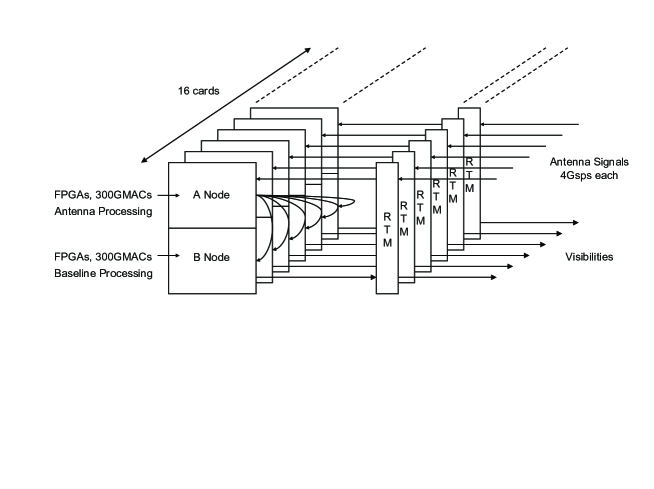
The architecture of the hardware platform, as depicted in Fig. 13, is driven by the need to connect signal paths from the antenna-based processing to the baseline-based processing, the details of which have been described in the previous section. It is well known that for large interferometers this apparently mundane task (which grows as the square of the number of antennas) is the main obstacle and becomes the major cost driver. For the modestly sized CABB correlator the solution was to adopt the newly announced Advanced Telecom Compute Architecture (AdvTCA) chassis, a commercial item developed by and for the telecommunications industry. Its backplane includes a mesh network, providing a high bandwidth link from every slot to every other slot, exactly as required. Each of 16 card slots can accommodate a large ‘Front Board’ which connects to the mesh and supports the signal processing, and a smaller directly linked board, the Rear Transition Module (RTM), which provides the physical interfaces to the external environment.
The CABB Front Board has half of its FPGA resources connected to the input side of the mesh, supporting most of the antenna-based digital signal processing (DSP; see Fig. 8) for one IF (polarization) for one antenna. The remaining resources are driven by the output side of the mesh and support the baseline-based DSP, plus the antenna-based Integrated Products since they require both polarizations. Thus each mesh input node sinks the full spectrum from 1/16 of the Frequency 1 (or 2) antenna IFs, and each mesh output node sources 1/16 of the spectrum from the full set of Frequency 1 (or 2) antenna IFs. In this way one AdvTCA chassis supports a correlator for eight antennas, the six ATCA dishes plus two further antennas, providing a mature test bed for the SKA pathfinders.
3.7 The Rear Transition Module
The functions of the Rear Transition Module (RTM) are:
-
•
to receive the four optically transported 10 Gbit/s data signals from one digitiser and to convert them back to electrical signals using one ROSA per ’colour’ and then synchronise and merge these four separate data streams into one parallel data stream;
-
•
to receive and buffer the main system clock signals of 256 MHz, 128 MHz, 32 MHz and 160 MHz;
-
•
to receive and buffer supplementary control signals, including a one pulse per second timing reference signal;
-
•
to provide four, four-lane Infiniband channels, with each lane capable of up to 3.125 Gbit/s data rate, for connection to or from external systems as required;
-
•
to provide a mass storage device for the Front Board’s embedded processor; and
-
•
to provide two ethernet connections to the control and data networks.
Most of the logic functionality is achieved using one FPGA. This FPGA may be set to be configured from an onboard PROM however it is generally configured from the Front Board’s embedded processor.
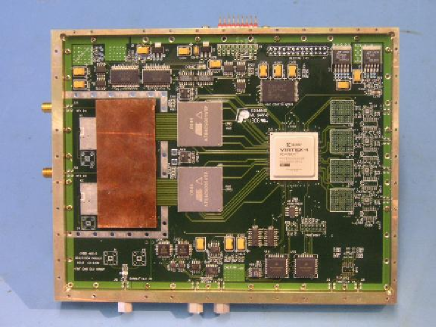
3.8 The Front Board
The complexity of the ‘Front Board’, also known as the CABB Signal Processing card, is indicated by its specifications. These include a 26-layer printed circuit board (PCB) measuring mm-standard AdvTCA form factor, 4188 components, and 20000 nets & 230000 holes. The major elements in the processing card are:
-
•
Ten signal processing FPGAs that have the following functions: (i) to perform coarse data delay functions and implement a filter bank; (ii) to provide = 64 high speed 2.5 Gbit/s communications channels, four to each of the other fifteen cards and one loopback. Each communications channel is full duplex, meaning that there is an independent 10 Gbit/s TX and 10 Gbit/s RX data path to every processing card from every other card; (iii) to implement a correlator; and (iv) provide for an external high speed data interface for applications such as VLBI and spacecraft tracking.
-
•
A small control computer with a Geode LX800 processor and 128 Mbytes of memory and onboard 10/100 Mbit/s Ethernet. The system communicates with the processing FPGAs via a standard PCI bus. An additional Ethernet interface chip is installed on the processing card to enable 1 Gbit/s Ethernet communications.
-
•
Two control FPGAs, one distributing control and monitoring data to all signal processing FPGAs and the other distributing accurate timing signals to all FPGAs. Both interface directly to the above system over the local PCI interface bus.
-
•
Six mini dual in-line memory modules (DIMMs) of DDR2 RAM, each supporting up to 1 GByte. Each correlator FPGA is connected to two modules and the delay FPGA is connected to two modules.
-
•
A flexible clock distribution network allowing either externally provided reference signals from the RTM, or locally generated signals, to be distributed to all processing FPGAs. Each processing card contains four local oscillators operating at 66 MHz, 200 MHz, 266 MHz and 156.25 MHz. The clock distribution network can be configured to shutdown if a temperature sensor surpasses a preset threshold.
-
•
System health monitor points for all onboard-generated voltages, all FPGA temperatures and PCB temperatures around the board.
-
•
An isolated power conversion module with a 48 V input generating all the required voltages for the FPGAs onboard. A large distributed heat sink covers all signal processing FPGAs to distribute heat over the entire card and reduce hot spots. Each card is rated at 200 W.
All signal processing FPGAs are connected to each other with parallel low voltage differential signalling (LVDS) data busses of varying widths. All data pairs run at a common data rate of 512 Mbps. Data arrives from the rear IO card across the AdvTCA zone 3 connector and is received by the coarse delay FPGA. It is then transferred to the two filter bank FPGAs. These FPGAs are interconnected allowing the signal processing required for the filter bank to be split across both. Each filter bank FPGA is connected to one of the data distribution FPGAs. Data is distributed between these four FPGAs as well as to and from every other processing card in the AdvTCA rack. Every data distribution FPGA has a dedicated link to each of the two correlator FPGAs, and each correlator FPGA has access to two modules of DDR memory for data accumulation.
3.9 Control Software
Control of the CABB hardware and firmware has been integrated into the standard correlator control software package, which itself has been developed over many years to support backend systems at all ATNF observatories. The major new functions required for CABB were antenna hardware switching control, local oscillator setting, correlator configuration control, delay tracking, procedures for the calibration of delay, phase and amplitude, system monitoring and data collection and archiving. The fact that much of the functionality of the previous backend system has been moved into the correlator required a significant expansion of the correlator control software. Examples of this are the delay tracking and narrow band conversion systems, which were previously located in special purpose hardware in the antennas.
The delay tracking software uses the GSFC Mk-5 VLBI Analysis Software CALC (Gordon 2004). A custom interface to the CALC package has been created to facilitate its use in the real-time CABB application.
3.10 Square Kilometre Array (SKA) Development Role
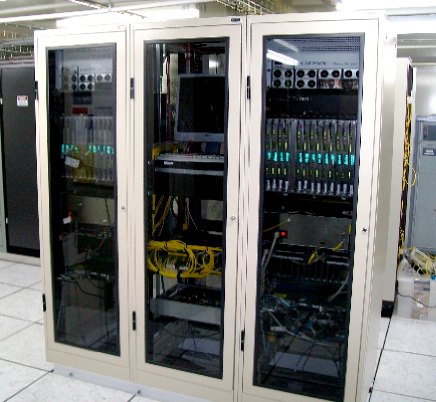
The construction of CABB (see Fig. 14) embodied the role of
demonstrating enabling
technologies for the SKA. Novel features include the digital filter bank
correlator architecture, the high 2 GHz signal bandwidth and 4 GHz total
bandwidth, high resolution digitisation followed by a linear, stationary,
signal path, RFI robustness, and simultaneous continuum and spectral line
observations at full specifications across the full bandwidth. The correlator
provides extra ports to incorporate two additional external antennas.
Wideband data produced by CABB provide challenging input to a new generation
of off-line data reduction and imaging software tools under development for
ASKAP and the SKA.
The Mopra wide-band system, the CABB 2 GHz correlator in Narrabri, the SKA Molonglo Prototype (SKAMP) correlator at Captain’s Flat (Adams, Bunton & Kesteven 2004), the Murchison Widefield Array (MWA) correlator (Lonsdale et al. 2009) and the Parkes Testbed, where a 48 (upgradable to 192) input beamformer has been implemented, can be considered prototype systems for the design of the ASKAP correlator (DeBoer et al. 2009).
4 CABB Installation and Operations
The installation of CABB required a significant shutdown of the Compact Array totalling six weeks in March/April 2009. The task was lessened somewhat through progressive installation over the year of an interim CABB system. This interim system, which ultimately provided a single 2 GHz bandwidth, with dual polarizations for five of the six ATCA antennas, was able to be operated in parallel with the original correlator system, allowing valuable comparisons and cross-checks to be made. In concert with the signal transmission and processing hardware changes, modules to interface the current suite of receivers to the new system have been fabricated and installed. CABB operations and scientific commissioning were interleaved with engineering maintenance periods in late April 2009. The new CABB system has also required significant changes to the array control and monitoring software, which has taken place in parallel with the hardware changes. In addition, the ATCA data analysis package miriad has required revision and extensions to enable the significantly larger CABB data files to be processed.
The first mode available for general observing consisted of MHz bandwidths with 2048 channels across each band, corresponding to a 1 MHz spectral resolution. For VLBI and NASA tracking a single 64 MHz channel observing mode was also made available. Table 2 summarises the basic modes; currently available are:
-
•
CFB 1M–0.5k: a bandwidth of 2 GHz divided into -MHz channels and (optionally) a fine resolution of 0.5 kHz in up to four zoom bands in each of the two IF bands has been available since May 2010. — The first observations with MHz zoom bands were obtained on 17 Dec 2010 (see Fig. 26).
-
•
CFB 64M–32k: a bandwidth of 2 GHz divided into -MHz channels and (optionally) a fine resolution of 32 kHz in up to four zoom bands in each of the two IF bands. Since October 2010 a single 64 MHz channel (divided into 2048 sub-channels) is available in each IF. We hope that all 32 channels and zoom channels will be available later in 2011.
-
•
pulsar binning modes were successfully tested in December 2010 (see § 6.13). The minimum time bin is 110s, allowing, for example, 32 phase bins across the period of a 3.5 milli-second pulsar.
-
•
high time resolution modes (10ms) was implemented in January 2011, with 4 MHz frequency resolution across each of the two 2 GHz IF bands.
4.1 CABB Milestones
The CABB project commenced in January 2002 and had at its core a new digital signal processing (DSP) system based on a novel polyphase Digital Filter Bank (PDFB) structure developed at ATNF. Key milestones on the path to completion of CABB included provision of the Mopra Spectrometer (MOPS444Previously developed ATNF 8 GS/s 2-bit sampler chips, as used in the Mopra Spectrometer (MOPS) were unsuitable for the CABB upgrade. Two bit sampler systems have significant quantization errors, increasing the noise and causing distortions. While they have adequate RFI rejection at high frequencies, they are unsuitable for the stronger RFI often encountered at lower frequencies. MOPS delivers a maximum bandwidth of 8 GHz, split into four overlapping IFs of 2.2 GHz each. Three modes are provided, giving resolutions of 2.2 MHz, 270 kHz or 34 kHz.; see, e.g., Walsh et al. 2010, Urquhart et al. 2010, Muller et al. 2010) in 2006, delivering 8 GHz of bandwidth, and the Pulsar Digital Filterbanks for the 64-m Parkes dish (Ferris & Saunders 2004).
CABB replaces the Compact Array’s original signal processing and digital correlator system (Wilson 1992). Those systems, at the time of their design and construction in the 1980s, were ”state-of-the-art” and gave the ATCA a competitive edge when it began operating in 1990 (Frater & Brooks 1992).
First fringes with the interim CABB system were obtained on 23 May 2008 between CA02 and CA03. On 12 Aug 2008, a three-baseline system was first demonstrated with the addition of CA05, with fringes obtained on a single polarization with a 128 MHz bandwidth, enabling further testing to be carried out. In early November 2008, full 2 GHz auto-correlation spectra were being obtained from CA01 to CA05, followed by the first CABB image (single IF, 128 MHz bandwidth, full polarization) in early December. Comparison with data from the original (pre-CABB) correlator indicated the CABB system was working well. In late December 2008 and early January 2009, the CABB bandwidth was gradually increased toward the full 2 GHz, with additional imaging observations being made to test the flow of data from the correlator and through miriad. In February 2009, the first observations utilising the full 2048 channels were made with the interim CABB system (five antennas, single IF). On 23 Feb, CA06 was taken off-line and preparations started for the full CABB installation. A six-week shutdown ran from 2 Mar to 14 Apr 2009, followed by a week of scientific commissioning (in the H168 array). Scheduled observing started on 22 Apr 2009.
The CABB shutdown diary, available on-line, provides a lively documentation of
the progress during that period. CABB fringes were progressively obtained to
the Compact Array antennas, with first CABB fringes to all six antennas
obtained on 1 Apr 2009. Upgrades to the ATCA operations and monitoring
software and to the popular miriad data reduction package were carried
out in parallel (see Section 5).
First scientific results, obtained by operations and astrophysics staff as
well as ATNF co-supervised students, were presented during the CABB Science
Day on 13 May 2009 (available on-line). Initially, only bands from 3-mm to
6-cm were available for testing, with poor weather conditions severely limiting
observations in the 3-, 7- and 12-mm bands. The 13- and 20-cm bands (now
replaced by a combined and much broadened 16-cm band) were available for
testing from 15 May 2009. The large number of ”dead channels” (due to missing
CABB boards in April and May 2009) made it difficult to obtain presentable,
wide-band spectra.
The first CABB zoom mode observations with a single ATCA baseline were taken in March 2010 (see Fig. 16). In December 2010, using all ATCA baselines, we successfully demonstrated spectral line observations with MHz zoom channels providing very high velocity resolution, and also pulsar binning mode. High time resolution modes are currently being tested. In Section 6 we present a selection of results obtained during the CABB commissioning week in April 2009 and afterwards.
4.2 The primary 2 GHz spectrum
A spectrum over the full bandwidth of 2 GHz is always observed and recorded (strictly, 2048 MHz, since all bandwidths and frequency separations are precisely MHz) for both IF bands. All four polarization products are computed, along with the auto-correlations and cross-correlations (interferometer output) for each of the six antennas of the ATCA. The chosen IF bands must be entirely contained within 8 GHz of each other (see Figure 3, for an overview of the currently available bands). Note that the 2 GHz band edges are defined by an analogue filter (as were the bands of the original ATCA correlator), so that increases gradually (by less than a factor two) towards the outermost edges of the band.
For this basic 2 GHz spectrum the maximum resolution is 1 MHz. Each channel has a ’square’ response, and thus there are 2048 independent channels across the full spectrum (see Fig. 11. This means that Hann (or ”Hanning”) smoothing, which is often used to remove ‘ringing’, is not required. Internal to the correlator, an output of 4096 channels is routinely computed (i.e., with additional channels interleaved with a half-channel shift) so as to allow flexibility in positioning of zoom bands (see Figs. 9 & 17). To enable the set-up of zoom bands with various widths, the following observing modes are planned for the primary band: MHz, MHz, MHz and MHz (see Table 2).
In Dec 2010 the original 20- and 13-cm band receivers were upgraded to a single 10–30-cm (or nominally 16-cm) band, providing an instantaneous frequency coverage from 1.1 to 3.1 GHz (although the usable bandwidth is reduced by RFI). The new receivers have an improved sensitivity over the original 20- and 13-cm receivers, and include new ortho-mode transducers, significantly improving the polarization performance towards the top end of the band.
In the 6- and 3-cm bands, which are generally observed simultaneously, the existing front-ends allow a 2 GHz bandwidth to be used for each band (see Fig. 3).
In the 15-mm (previously referred to as 12-mm), 7-mm and 3-mm bands, two IF bands may be selected within an 8 GHz bandwidth. In the 7-mm band, both band centres must be either greater than 41 GHz (the point at which the conversion changes from lower side-band to upper side-band) or both less than 41 GHz. For example, methanol lines at 36 and 44 GHz cannot be observed at the same time.
4.3 RFI and bad channels
Single-channel interference spikes are found one-quarter, one-half and three-quarters of the way across the 2 GHz band and are due to the way the interleaved ADC samples are generated (see § 3.2). When using 2048 channels, these are located in channels 513, 1025 (the centre channel) and 1537. Because they are always contaminated with self-generated interference, the channels are flagged by the correlator before the data are written to disk.
Further interference spikes are commonly observed due to harmonics of the 640 MHz data clock and the 4096 MHz ADC clock. These occur in channels 129, 257, 641, 769, 897, 1153, 1281, 1409, 1793 and 1921 (in 2048 channel mode). The correlator does not by default flag these channels (but can be instructed to) because they are not always correlated.
4.4 CABB cycle time
The CABB correlator defaults to writing out one set of spectra every ten seconds. If required, this interval can be decreased to as little as one second. Without zoom windows, the correlator will output 3.9 MByte per cycle, which corresponds to a data rate of 1.4 GByte per hour for ten second cycles. With a full set of zoom windows this rate may increase nearly twenty-fold.
4.5 Zoom modes
CABB provides up to 16 zoom windows in each of the two selected IF bands; these are in addition to the full 2 GHz primary spectrum. The four basic correlator configurations are listed in Table 2.
In each zoom band, the output will always be 2048 independent non-overlapping channels. Interleaved channels are not computed, but the channels will still be clean ’square’ channels, with negligible spillage (i.e., no ringing from narrow lines). The choice of bandwidths for the zoom windows is 1, 4, 16, and 64 MHz. Each of the 16 zoom windows must be the same width as the ”continuum channels” selected for the primary 2 GHz spectrum. The channel width of the primary 2 GHz spectrum can be chosen separately for each IF band.
The first full baseline ATCA observations with a CABB zoom mode were carried out in May 2010. Using MHz zoom windows we were able to observe eight methanol maser transitions around 25 GHz (see § 6.3). This was followed by OH maser observations in July 2010, with CABB providing full Stokes polarization and high spectral resolution (Caswell & Green 2011). The first observations with MHz zoom windows were obtained on 17 Dec 2010 (see § 6.5).
The separation of selected zoom windows within the 2 GHz band can be any integral multiple of half the zoom bandwidth. To seamlessly cover a selected band, zoom windows need to be interleaved by a half width (see Figs. 9 & 17). For example, four interleaved 1 MHz channels cover 2.5 MHz of bandwidth or 16 interleaved 1 MHz channels cover 8.5 MHz of bandwidth (see § 6.5). Consolidation and normalisation of interleaved channels takes place in the correlator, before the data are written to disk.
4.6 CABB scheduling
The addition of up to 16 zoom windows for each of two IF bands required an upgrade of the ATCA scheduling software. The old scheduler, atcasched, a terminal-based schedule creator, could not easily cope with another 32 input parameters. It has been replaced with a web-based scheduler called the CABBScheduler. The new scheduler runs as javascript in a browser and was written in java using the Google Web Toolkit. It makes use of tabs and stacking to reduce the amount of information presented at once and integrates existing web-based tools like the ATCA calibrator database and the velocity calculator into the scheduler interface. Behind the scenes it uses server validation of the schedule timing using the same code as the observing program to ensure accurate scheduling. The scheduler calculates the zoom band channels based on the date, source position, velocity and line rest frequency. It also searches for calibrators near the position of interest and displays their characteristics such that an informed selection can be made. While the scheduler is aimed at making it easy to manually create small schedules, there are facilities for bulk import of user created source catalogs and global search and replace of values. The schedule files are in a simple ASCII format with incremental scan to scan changes, making it relatively straightforward to produce large schedules with user written scripts.
Comprehensive ATCA observing information can be found at www.narrabri.atnf.csiro.au/observing, including a link to the CABB Sensitivity Calculator which is highly recommended to obtain observing characteristics (e.g., r.m.s. noise per channel) at specific frequencies and correlator settings.
As the implementation of zoom modes proceeds and our experience with CABB observing grows, the CABBScheduler is likely to accumulate further options. Most recently, an option to set the channel range for calibration purposes (in particular, delays and ) was added, with the goal to avoid RFI plagued channels in the respective observing bands.
After a proprietary period of 18 months, ATCA data are publicly available via the Australia Telescope On-line Archive (ATOA) at atoa.atnf.csiro.au.
4.7 CABB observing
The CABB correlator has radically altered the way the telescope operates. Extensive changes have been made to much of the control and monitoring software used by the ATCA, and a summary of these changes is presented here.
The coarse and fine attenuators have been replaced with CABB internal attenuators. The regular mm attenuators remain however, and progress is being made towards having specific attenuators for each cm receiver package as well. These attenuators continue to be controllable through CAOBS. The ATCA monitoring package, MoniCA has been revised to include all the new CABB monitoring points, and can now also be used to control many of the devices it is attached to. The primary control interface, CAOBS, has remained much the same as for the original correlator, but there are a number of changes. The most important change has seen the introduction of separate commands for delay, phase and amplitude calibration at the beginning of an observing run, replacing the automated cacal procedure.
A variant of the mosaic observing mode available on the ATCA has been introduced. Observations in the mosaic mode can cover a large contiguous area of sky with numerous pointing centres. The new variant, called “on-the-fly” (OTF) mosaicing, reduces the overheads of moving between pointing centres. For OTF mosaicing, the telescope slews continuously, moving the beam by half its width during each correlator cycle. This mode is made attractive with the broad bandwidths provided by CABB, as the integration time can be reduced without incurring the usual slew-settling overheads. In this way the time for each pass of the whole mosaic field is reduced, improving the sampling of the -plane.
5 CABB Data Reduction
The calibration, imaging and analysis of ATCA data is typically done in miriad. As miriad continues to be actively developed, it is essential that the latest software updates are used to reduce CABB data.
For continuum observations a new calibration strategy has been developed which ensures that amplitude calibration dependence on frequency is accounted for, regardless of the fractional bandwidth covered by the data. All ATCA users are encouraged to consult the miriad Users Guide for the full details of this calibration strategy.
To improve spectral line data calibration, miriad now generates time-variable bandpass solutions that have been found to reduce bandpass calibration errors in the 2 GHz band from 1% to as little as 0.1%. The zoom bands themselves have a digitally-defined bandpass that is corrected for online, and usually require no further correction during off-line reduction. For gain calibration purposes, miriad treats the zoom bands in the same way as the primary bands.
The greater instantaneous continuum sensitivity of CABB makes it easier to find suitable phase calibrators (close to the target source) and flux calibrators over the full frequency range. For frequencies between 1 GHz and 25 GHz, the preferred ATCA flux calibrator is PKS 1934–638. It has a known, stable flux, no detected linear polarization and only 0.01% circular polarization (Reynolds 1994, Sault 2003). At high frequencies (50 GHz), the preferred flux calibrator is the planet Uranus. Its flux is known to vary with time, but it does so in a way that is understood and can be modelled (Orton et al. 1986, Kramer et al. 2008). In the 7-mm band (30 – 50 GHz) either PKS 1934–638 or Uranus may be used, depending on the telescope configuration (in particular baseline length), frequency setup, and source elevation. Recent CABB measurements of PKS 1934–638 (and Uranus) in the 7-mm band flux indicate 0.52 (0.70) Jy at 33 GHz and 0.35 (1.17) Jy at 45 GHz.
At frequencies below 10 GHz the increased bandwidth also means a larger number
of channels will be affected by RFI, and extensive flagging of the data is
required before processing. The flagging capabilities of miriad have been
improved in an attempt to deal with this (see § 5.1). The large fractional
bandwidth has to be considered for data reduction below 10 GHz. One
approach is to split the data into several narrow frequency bands, then
calibrate and image these separately. Correcting the images for the primary
beam response, which varies with frequency (see Fig. 4), is then possible for
each sub-band, before combining them to reach the full sensitivity, if
required. Alternately, for single-pointing continuum observations at 4–10 GHz,
a 2 GHz wide band may be processed in one go as long as the multi-frequency
synthesis (mfs) is used for imaging (options mfs and sdb in the
task invert) and deconvolution (task mfclean). For observations
that require high dynamic range and/or accurate polarization calibration the
’divide and conquer’ approach is still expected to yield better results as
it can deal with variations in the calibration parameters with frequency.
A wiki for the ATCA Users Guide (atug.wikidot.com) and an ATCA discussion forum (currently at atcaforum.freeforums.org) have been set up for observers to discuss matters relating to CABB observing and data reduction.
Several tasks in the miriad software package (Sault et al. 1995) have been modified and some new tasks have been added. This work will continue over the next few years. It is therefore important to (a) reduce data in the latest version of miriad, (b) read all relevant documentation, (c) check each step, each task, and intermediate results carefully, and (d) provide feedback to the development team (email miriad@atnf.csiro.au).
5.1 Modified miriad tasks
Some of the notable changes to miriad tasks are:
-
•
The option rfiflag in the task atlod flags known, persistent RFI, mostly seen in the low frequency range. The RFI details are regularly updated and stored in ascii table which can be downloaded and modified for use in this task. The birdie option was updated to flag internal CABB RFI which is fixed in channel number. Both options, rfiflag and birdie, are recommended when loading CABB data as they eliminate a large fraction of the RFI and faciliate subsequent flagging and data calibration.
-
•
A maxwidth parameter was added to the task uvsplit to limit the bandwidth of the output files, allowing the data to be processed in smaller frequency chunks.
-
•
The flagging program blflag can now display data from all channels separately using the nofqav option.
-
•
Time variability in the bandpass can now be solved for with the task mfcal. The routines that apply calibration have been updated to interpolate between the bandpass solutions.
-
•
The task mfboot can now correct the spectral index across the spectrum as well as the flux level when using planets for flux calibration (typically used for mm observations).
-
•
Other tasks, in particular the plotting tasks, received minor updates to cope with larger data volumes, larger numbers of simultaneous frequency bands and much higher frequency resolution compared to that provided by the original ATCA correlator.
5.2 New miriad tasks
Several new tasks have been written by the miriad development team, including:
-
•
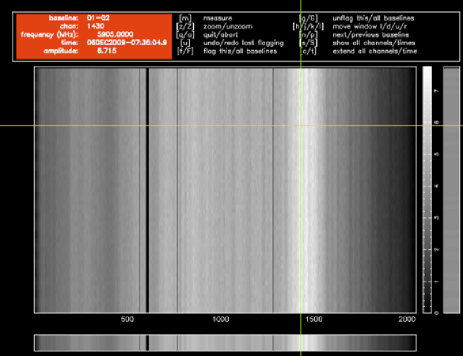
pgflag — a pgplot based data editing tool (see Fig. 19) replacing the task tvflag, an excellent, interactive flagging task which was designed for 8-bit displays;
-
•
mirflag — a task which allows automated flagging of a -data set (specifically continuum data; see also tvclip with options notv). It scans the data on a baseline-dependent and channel-dependent basis to find outliers (either in amplitude or based on r.m.s. noise) and flags these; it can be instructed to flag small or large clusters of data points. Care should be taken to not accidentally flag astrophysically important spectral lines.
-
•
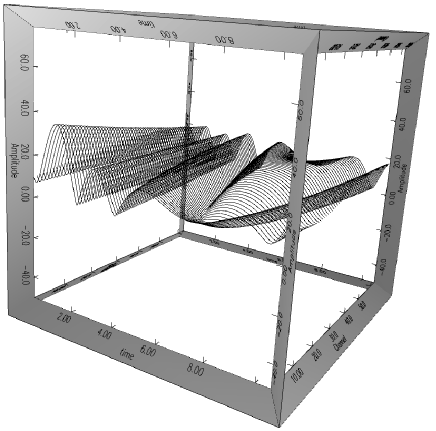
plotvis — provides an interactive, three dimensional view of the visibilities (see Fig. 18)
5.3 Example: The Radio Galaxy Pictor A
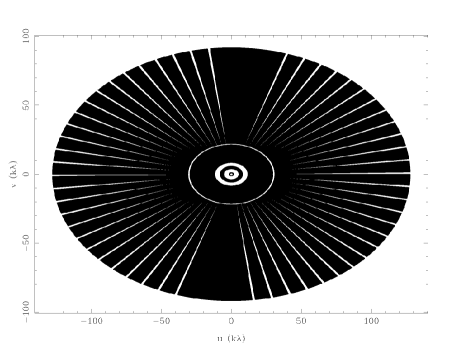
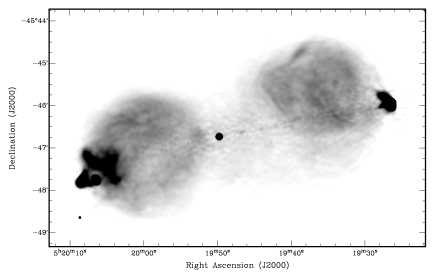
The large bandwidth (divided into a large number of channels) now available with CABB provides a hugely improved -coverage for any single observation when multi-frequency synthesis (mfs) is utilised (see Fig. 15). The almost-complete coverage reduces the need, in many instances, to observe the target with multiple ATCA configurations and thus alleviates issues associated with source variability and calibration differences between observations. However, care must be taken when imaging large or complex sources and sources with significant spectral variation. Large and complex sources, such as the nearby FR-II type galaxy Pictor A (Fig. 20), introduce large variations in complex visibilities not only in time but also in frequency. Figures 21a & b show the spectral plot at a given time and the amplitude visibility plot versus time. The time-frequency variability of the visibility amplitudes can more easily be seen using the new plotvis tool (see Fig. 18) which provides an interactive, three dimensional view of the visibilities. Spectral differences between the various components of the source, i.e. the lobes, hot-spots, jet and the core, further complicate imaging and necessitate the use of multi-frequency deconvolution algorithms such as mfclean.
 |
 |
6 CABB Results
CABB operations and scientific commissioning interleaved with engineering and maintenance blocks were carried out between 10–21 April 2009. Here we report on some of the results obtained during this period as well as more recent observations.
6.1 Star formation in the G305 H ii region
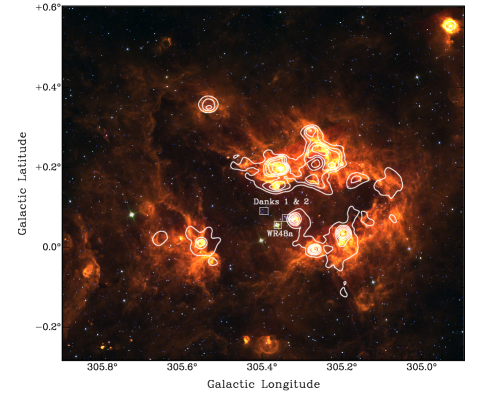
The G305 star forming region is one of the most luminous H ii regions in the Galaxy, centred on the open clusters Danks 1 & 2 and the Wolf-Rayet star WR 48a (Clark & Porter 2004). This complex, which extends over roughly one square degree, is located at = 305°, 0° and at a heliocentric distance of 4 kpc, which places it in the Scutum Crux arm. The central clusters have ages of about 3–5 Myr and are located in the centre of a large H ii region, surrounded by molecular gas and dust. There are numerous infrared hot-spots and massive young stellar objects (Urquhart et al. 2008), ultra compact (UC) H ii regions and molecular masers located on the periphery of the H ii region. The integrated radio flux is indicative of deeply embedded 07V stars (Clark & Porter 2004). The detection of these high-mass star formation tracers, within the boundary layer between the ionized and molecular gas, would suggest that, not only are high-mass stars currently forming, but their formation may have been triggered through the interaction of the ionization front and surrounding molecular material.
A multi-wavelength observing program was designed to study the star formation across the G305 complex. High frequency radio continuum observations are a key ingredient of this program as they allow the large scale structure of the ionized gas to be traced, and the emission from very young high-mass stars to be identified via their compact and ultra-compact H ii regions. Previous cm continuum observations have either covered small areas at high resolution, e.g., around the methanol masers listed in Walsh et al. (1998), or have been of low angular resolution and sensitivity (Danks et al. 1984, Caswell & Haynes 1987, Haverkorn et al. 2006). Mapping large Galactic star forming regions on the scale of G305 at high frequency and sub-arcminute resolution has only recently been made possible with the commissioning of CABB on the ATCA. This is primarily due to the factor of at least 16 increase in frequency bandwidth, which effectively increases mapping speeds by the same factor over the previous system to reach the same sensitivity. A further speed increase is gained by the potential to map two frequencies simultaneously using the two IFs.
G305 was mapped using ATCA with CABB at two frequencies (centred around 5 and 9 GHz), requiring 357 separate mosaic points to cover the whole region. Multiple array configurations were required to obtain sufficient -coverage to recover both extended and compact structures. In total, six different configurations were used to obtain fairly uniform baseline coverage between 30 m and 6 km, which provides sensitivity to angular scales of a few arcseconds to a few tens of arcminutes. The observations were made in snapshot mode, i.e. second integrations were spent on each of the 357 pointings. This was repeated for each configuration; the total integration time for the project was 75-h.
In Fig. 22 we present a three colour mid-infrared image of G305 overlaid with contours of the integrated 6-cm emission obtained from the three ATCA hybrid arrays (H75, H168 and H214); these configurations primarily consist of short baselines and so are very sensitive to the large scale structure of the ionized gas. The ionized gas is correlated with prominent emission structures seen in the mid-infrared, tracing the interface between the H ii region and surrounding molecular gas. Combining the radio emission with tracers of molecular gas (e.g., Hindson et al. 2010) and dust will allow investigating the impact of massive stars associated with Danks 1 and 2 on the structure of G305’s molecular gas as well as its influence on current and future star formation in the region.

6.2 A forest of molecular lines from NGC 6334 I
NGC 6334, also known as the ‘Cats Paw Nebula’, is a giant molecular cloud / H ii region located at a distance of 1.7 kpc in the southern Galactic Plane. Situated in its northern part is the high-mass star-forming site known as NGC 6334 I. This site contains a hot molecular dust core at the head of a bright cometary UC H ii region and is associated with a wealth of young high-mass star-forming phenomena such as masers, molecular outflows, a forest of molecular line hot-core chemistry as well as several compact millimetre continuum sources (e.g. Beuther et al. 2007, Hunter et al. 2006). Walsh et al. (2010) studied a region encompassing NGC 6334 I and another bright (sub)millimetre continuum source further north (NGC 6334 I(N)) at 3 mm (from 83.5 to 115.5 GHz) using the 22-m Mopra telescope (angular resolution 36″). They detect a total of 52 transitions from 19 species (molecules, ions and radicals). Beuther et al. (2008) studied NGC 6334 I with the ATCA in 2006 (pre-CABB) at around 88.4 GHz, achieving an rms of 23 mJy beam-1. While the angular resolution was high (), the modest observing bandwidth of 128 MHz only permitted two molecular emission lines to be detected simultaneously.
NCG 6334 I was again observed on 16 April 2009, as part of the CABB science commissioning program. Antenna array configuration H168 was used with an on-source observing time of 1.6-h. Fig. 23 shows the 2 GHz wide-band CABB spectrum (95 – 97 GHz) towards the central position of NGC 6334 I at (J2000) = 5335, –35° 47′ 16. More than 30 molecular lines are easily detected simultaneously, demonstrating the power of the Compact Array Broadband Backend (CABB) for multi-transition chemical line studies.
6.3 Galactic methanol maser observations

Fig. 24 demonstrates the power of CABB with its first zoom modes (obtained on 3 Jun 2010, by Maxim Voronkov). Eight zoom windows were chosen to cover bright methanol maser transitions near 25 GHz (JJ1 E methanol series) in the high-mass star-forming region G343.12–0.06 (IRAS 16547–4247). This source has a jet-driven molecular outflow embedded in a molecular cloud (Brooks et al. 2003). The interaction between the outflow and the cloud produced a number of masers across the region (Voronkov et al. 2006). The CABB observations shown here replicate in a more efficient way most of the 25 GHz observations from Voronkov et al. (2006) which were obtained with the original ATCA correlator by cycling through all the transitions sequentially (a stronger J=10 transition was observed instead of a weak J=2 maser reported in the original study). Each zoom window was 1 MHz wide (about 12 km s-1 of velocity coverage) and had 2048 spectral channels, providing a spectral resolution of about 6 m s-1. Even the narrow maser lines were notably oversampled, as the spectral resolution provided by this CABB configuration was a factor of 4 to 8 times better than that of Voronkov et al. (2006).
 |
 |
6.4 The Pictoris Debris Disk
Debris disks represent the final evolutionary phase of protoplanetary disks around young stars. They are optically thin, contain little or no gas and are generally thought to be in the final planet forming stage (Wyatt 2008). At a distance of just 19.3 pc (Crifo et al. 1997), the Pictoris debris disk is an excellent target for high resolution imaging.
Pictoris has been extensively studied since its discovery as an infrared excess star by IRAS (Aumann 1984) and subsequent imaging of its dusty disk by Smith & Terrile (1984). The latter revealed a nearly edge-on disk 400 AU (20″) in extent. At an age of 10–20 Myrs (Zuckerman et al. 2001), Pic is mature enough to host planets and, indeed, the direct detection of an 8 Jupiter mass planet was recently reported (e.g., Lagrange et al. 2010).
Modelling of the thermal and scattered light by Artymowicz (1997) indicates that the Pic disk contains a wide range of grain sizes from sub-micron through to at least millimetre dimensions. Simple order of magnitude estimates show that even the smaller dust grains cannot be primordial because they would be blown away radiatively on timescales of tens of orbits. Collisions between larger bodies will lead to fragmentation, since there is very little gas to dampen the relative grain velocities (Lecavelier des Etangs et al. 2001), and thus these collisions act to replenish the dust. Debris disks can have a very different appearance at different wavelengths. Sub-mm and mm observations trace the largest grains, which are least affected by stellar radiation, suggesting that these grains are the best probe for the larger parent bodies responsible for the dust production.
Millimetre interferometry provides high angular resolution and much needed information on the largest grain populations in debris disks. The close proximity of Pic and its southern declination make it an ideal target for mm-imaging with the ATCA.
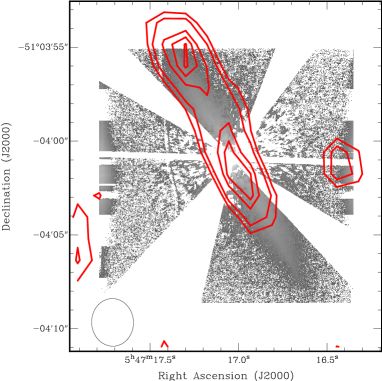
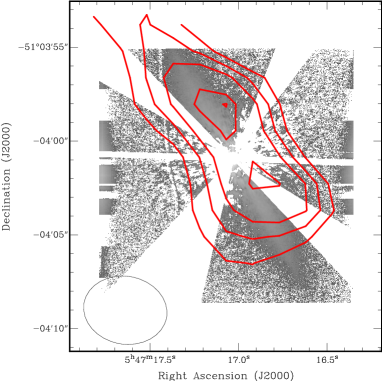
Using CABB 3-mm (92 – 96 GHz) and 7-mm (42 – 46 GHz) observations with the ATCA in the H214 configuration, Maddison & Wright (2011) were able to clearly resolve the debris disk of Pic (see Fig. 25). These are the longest wavelength detections of any debris disk obtained to date. To achieve the 4 GHz wide bandwidth, they placed the two 2 GHz IF bands adjacent to each other; integration times were 8-h at 3-mm (12/13 Sep 2009) and 6.5-h at 7-mm (13/14 Sep 2009). Maddison & Wright (2011) found clear evidence of structure within the dust and a direct detection of inner disk clearing, in agreement with recent Sub-Millimetre Array (SMA) 1.3-mm observations by Wilner et al. (2011).

6.5 Water masers in the Sgr B2
In Dec 2010 the first CABB observations with MHz zoom channels were successfully demonstrated. Fig. 26 shows the high-velocity resolution line data of water masers in Sgr B2. Here the zoom channels are overlapped in 0.5 MHz steps to obtain a uniform spectrum over 8.5 MHz of bandwidth with a velocity resolution of 7 m s-1. McGrath et al. (2004) show a similar spectrum at 0.66 km s-1 velocity resolution, while Reid et al. (2009) determined the trigonometric parallax of Sgr B2 by measuring the H2O maser positions with the Very Large Baseline Array (VLBA) over one year.
6.6 The Circinus Galaxy
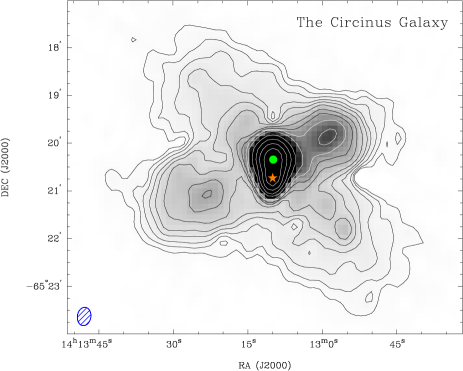
The Circinus Galaxy is, at a distance of 4 Mpc, one of the closest active galaxies. Discovered relatively recently (Freeman et al. 1977) and obscured by Galactic foreground stars and dust, it nevertheless remains a prominent observing target at a large range of frequencies. It harbours an active galactic nucleus (AGN) surrounded by a star-forming ring, an extended stellar disk, double radio lobes (orthogonal to the disk), and an enormous H i gas envelope (Jones et al. 1999; Curran, Koribalski & Bains 2008). Bauer et al. (2008) discovered a supernova, named SN1996cr, located just 25″ south of the AGN, adding to the continuing interest in this spectacular galaxy (see Fig. 27).
CABB 6-cm observations were carried out in April 2009 using the EW352 array. The 2 GHz band, centred at 5500 MHz, was divided into 2048 channels. During the 9-h synthesis we regularly observed the nearby calibrator PKS 1352–63. The bandpass and amplitude calibrator PKS 1934–638 was observed at the start of the session. Radio interference was detected in numerous channels, particularly around 5600 MHz (bandwidth 6 MHz) probably related to the 5625 MHz weather radar near the town of Moree. Our goal was to reproduce (or enhance) the 6-cm radio continuum map of the Circinus galaxy obtained by Elmouttie et al. (1998), to study the emission from the nuclear region, the disk and the radio lobes. Their published ATCA data consisted of -h with a bandwidth of 128 MHz, reaching an r.m.s. of 120 Jy beam-1. With an effective increase of a factor 20 in the useable bandwidth ( MHz), a factor 2 in , highly improved uv-coverage and dynamic range, we estimate a theoretical noise of 13 Jy beam-1 for the CABB 6-cm imaging of the Circinus galaxy (’uniform’ weighting). The data were calibrated in miriad by splitting the 2 GHz band into MHz channels, then imaged and further calibrated in difmap (Shepherd 1997) using a combination of model-fitting and self-calibration. The resulting image (uniformly weighted; no self-calibration) is shown in Fig. 27. In the nuclear region the AGN and the supernova SN1996cr are clearly detected (and well-resolved in the high-resolution image, not displayed here). Thanks to CABB, the extended, star-forming disk of the Circinus galaxy and its spectacular radio lobes are revealed in detail (the image dynamic range is 1000:1). Our CABB 6-cm image closely resembles the pre-CABB 20-cm image by Elmouttie et al. (1998). An in-depth analysis of the gas distribution and star formation in Circinus is under way (For, Koribalski & Jarrett 2011).
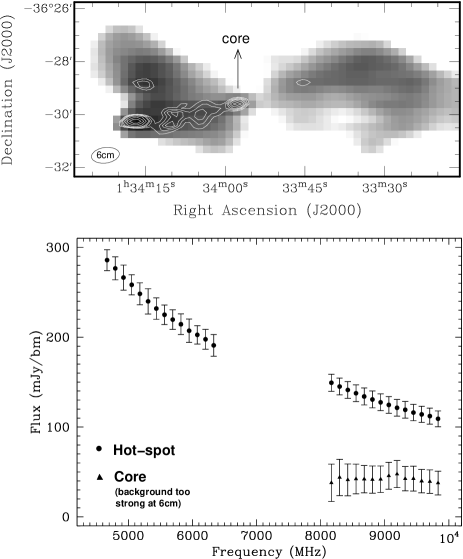
6.7 The Radio Galaxy NGC 612
NGC 612 (PKS 0131–36) is one of the nearest powerful radio galaxies ( = 0.0297; e.g., Ekers et al. 1978). Its eastern radio jet shows a hot-spot, typical for Fanaroff & Riley type-II radio sources. The host galaxy is a dust-lane S0 with a young stellar population detected along its disk (Véron-Cetty & Véron 2001; Goss et al. 1980; Holt et al. 2007). NGC 612 also contains a large-scale disk of H i gas (140 kpc in diameter) as well as a faint bridge-like H i structure (400 kpc in size) that stretches towards a gas-rich companion (Emonts et al. 2008). The proximity of NGC 612 allows us to have a close look into the physical processes associated with powerful radio galaxies.
The complex and bright structure of the radio continuum source (roughly the size of the primary beam at 6-cm) made NGC 612 an excellent target to image during CABB commissioning. On 9 and 10 April 2009, NGC 612 was the first science target observed simultaneously in the 3- & 6-cm bands, using the H168 hybrid configuration. Over the following months, these observations were repeated in H75 and H168 at three additional epochs. The main aims were to perform wide-band imaging across the primary beam, derive instantaneous spectral index information of both the nucleus and hot-spot across a large frequency range and investigate CABB’s performance for deriving polarization properties of this source.
Figure 28 shows preliminary results obtained from the CABB observations of NGC 612. It includes total intensity images of its radio continuum emission at 3- & 6-cm and a spectral index diagram (over 4 GHz) of both its nucleus and eastern hot-spot. For the latter, each individual data point was obtained by extracting 128 MHz sub-bands from the full CABB 2 GHz band. Standard reduction was performed on each 128 MHz sub-band (i.e. bandpass/phase/flux calibration, imaging, cleaning and primary beam correction – see § 5 for details). We then measured the integrated flux densities of the nucleus and the eastern hot-spot by fitting Gaussians functions in each ‘128 MHz’ sub-image. The steep spectral index of the eastern radio hot-spot555In Fig. 28 the spectral index of NGC 612’s eastern hot-spot is plotted using linear rather than logarithmic axes in order to better visualise the instantaneous frequency coverage of CABB. is in stark contrast to the rather flat spectrum of the nucleus (at 6-cm the continuum of the inner radio lobes becomes too bright to clearly distinguish the resolved nucleus). These results are in agreement with continuum observations at 20 GHz by Burke-Spolaor et al. (2009). The wealth of spectral index information that can be obtained with a single CABB observation, once the calibration is finalised, is striking. The preliminary analysis also indicates that the eastern hot-spot is highly polarised (25%) at 6-cm.
6.8 Deep continuum observations of the ECDFS
The Extended Chandra Deep Field South (ECDFS) is part of the Australia Telescope Large Area Survey (ATLAS; Norris et al. 2006). The goal of ATLAS is to study the origin and evolution of both star-forming and AGN-dominated galaxies by making deep multi-wavelength radio observations complemented by deep infrared and optical imaging as well as spectroscopy.
The ECDFS was observed for about 4-h in the ATCA H168 configuration on 19 Apr 2009. The 2 GHz CABB band was centred at 5500 MHz and divided into 2048 channels. The data were processed in miriad, initially using the full 2 GHz spectrum. Without self-calibration, an r.m.s. noise of 23 Jy was obtained (see Fig. 29); this was improved to 16 Jy (close to the theoretical r.m.s.) after one iteration of phase self-calibration. Re-processing and primary beam correction in smaller sub-bands (e.g. 128 MHz) will be required to obtain correct flux densities and spectral indices for all sources in the field.
Source S415, located several arc minutes from the pointing centre, is an example of the rare ”Infrared-faint Radio Sources” published by Norris et al. (2006); see also Beswick et al. (2008). Using ATLAS data, Middelberg et al. (2011) give its 20-, 13- and 6-cm flux densities as mJy, mJy, and 0.33 mJy, respectively, resulting in a spectral index of . The CABB 6-cm data reveal a 80 Jy radio source at the position of S415, confirming the steep spectral index. This is important since such sources are often associated with high-redshift radio galaxies (Krolik & Chen 1991; de Zotti et al. 2010). S415 has no detected 3.6 m counterpart to a limit of 1 Jy, giving it a ratio of 2000, compared to 200 typical for radio-loud quasars and 10 for star-forming galaxies.
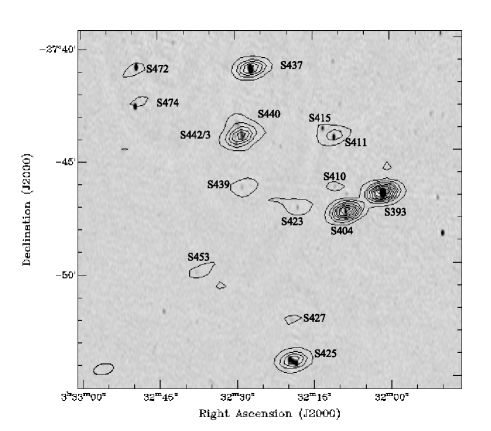
6.9 High redshift CO
A crucial component in the study of star formation throughout the Universe is a detailed knowledge of the content and properties of the molecular gas. An excellent tracer for molecular gas is the emission-line of carbon monoxide (CO), which is strong enough to be observed out to high redshifts. However, since the first detection of CO at by Brown Vanden Bout (1991), observations of molecular gas at high redshifts have been limited by the fact that, at the high observing frequency of CO ( GHz for the lowest rotational transition), existing narrow-band receivers covered a velocity range that was generally not much larger than the CO line width or the accuracy of the redshift. Moreover, the lack of millimetre receivers in the 20–50 GHz regime resulted in a focus on observations of the higher order rotational transitions. While the higher order transitions are good tracers for the molecular gas that is dense and thermally excited, large reservoirs of low-density and widely distributed gas could be hiding in the lower rotational CO transitions (e.g. Papadopoulos et al. 2000, 2001).
In its coarsest spectral line mode, the GHz CABB bands with 1 MHz spectral resolution are ideal for targeting high- CO lines, in particular regarding the lower order transitions that are shifted into the ATCA 7-mm and 15-mm bands. For example, a source at = 3.8 can be observed in CO(1–0) at 24 GHz (15-mm band) as well as CO(2–1) at 48 GHz (7-mm band), with observations of the latter covering a velocity range of more than 12,000 km s-1 per 2 GHz band at a resolution of 6 km s-1.
The first detection of high- CO with CABB was made by Coppin et al. (2010), who detected the CO(2–1) transition in a distant sub-millimetre galaxy at = 4.76, indicating the presence of 1.6 M⊙ of molecular gas. Recently, Emonts et al. (2011a) detected the CO(1–0) transition in a powerful radio galaxy at , representing 5 M⊙ of molecular gas. This is only the third known high- radio galaxy detected in CO(1–0), after detections in two others at a significantly lower signal-to-noise levels (Greve et al. 2004; Klamer et al. 2005). These initial results show the enormous advantage CABB delivers for ATCA studies of molecular gas and star formation in the Early Universe. The excellent performance of CABB for high- CO observations is demonstrated by Emonts et al. (2011b), including a detailed description of their observing strategy for millimetre spectral line work with CABB.
6.10 Polarization synthesis
The large frequency bandwidths that have become available with CABB are also useful for radio polarization observations, which can tell us about the properties of magnetic fields in the Milky Way and beyond. In particular Faraday rotation, an effect where the plane of polarization of a radio wave is rotated when the wave passes through an ionised region with an embedded magnetic field, has been a very popular method over many years (Gaensler et al. 2005; Brown et al. 2007). Faraday rotation strongly varies with the observing wavelength (), which means that the polarization vectors at different frequencies will have different orientations. The magnitude of this variation with frequency (known as the ‘rotation measure’, or RM) depends on the magnetic field strength and the free electron density in the column that the radio wave passes through. From the measured RM we can estimate the magnetic field strength, if we can correct for the electron density contribution to RM.
A large observing bandwidth gives a great improvement in sensitivity, also in polarization, but only if we can correct for the change in orientation of the polarization vectors with frequency, which is the result of the Faraday effect. By simply summing the different frequency channels some of the polarised signal will be lost if the polarization vectors have different orientations. The novel technique of rotation measure synthesis (or ‘RM synthesis’; Brentjens & De Bruyn 2005666RM synthesis was developed independently in 1996 by De Bruyn (NFRA note 655) and by Killeen et al. (1999).) helps us out: if the Faraday effect rotates the polarization vectors as a function of frequency, then by choosing the correct RM for that line of sight the polarization vectors can be de-rotated (in RM synthesis-speak the RMs are referred to as ‘Faraday depths’). This way the polarization vectors from all the frequency channels in the observing band can be combined, and the noise level is thus greatly reduced. Typically one would use many trial Faraday depths and calculate how much polarised flux is recovered at each Faraday depth, to find the Faraday depth of the polarised emission for a particular line of sight. Furthermore, when there are regions along the line of sight that emit polarised radiation with different Faraday depths (e.g. when there is additional Faraday rotation between the emission regions), then each Faraday depth will produce a polarization vector that rotates at a specific rate as a function of observing frequency. RM synthesis can separate such regions, since it is essentially a Fourier transform. This way RM synthesis adds a depth dimension to measurements of the Faraday effect.
To study whether magnetic fields are important for the evolution of the Galactic supershell GSH287+04–17 we used CABB 20-cm data in combination with RM synthesis. For this purpose we determined Faraday depths of extragalactic sources that are seen through the wall of the supershell, and we compared these to the Faraday depths of extragalactic sources that lie just outside the shell wall. Fig. 30 shows the polarised intensities and polarization angles that were derived for one such source and the polarised intensity that is recovered for different trial Faraday depths. In this example the extragalactic source is the only source of polarised emission along the line of sight, and the expected response from RM synthesis (similar to the dirty beam in synthesis imaging), which is indicated with a thick red line, closely matches the measured response. We determined the Faraday depths of 100 extragalactic sources that are seen through or close to the ionised inner part of the supershell wall. The enhanced free electron density will naturally lead to an increase in RM if the magnetic field remains the same. However, we did not find such an enhancement of the RMs of the extragalactic sources here, but we did find a narrow filament that runs nearly parallel to the Galactic plane, where the RM varies by 250 rad/m2. This filament spans the entire width of the area we surveyed (and is therefore 5° wide) but it is only 1° high. Since there appears to be no enhancement in the H intensity that is associated with this ribbon it must be magnetic in origin, and it will be very interesting to investigate how such a magnetized structure can have survived in the Galactic interstellar medium.
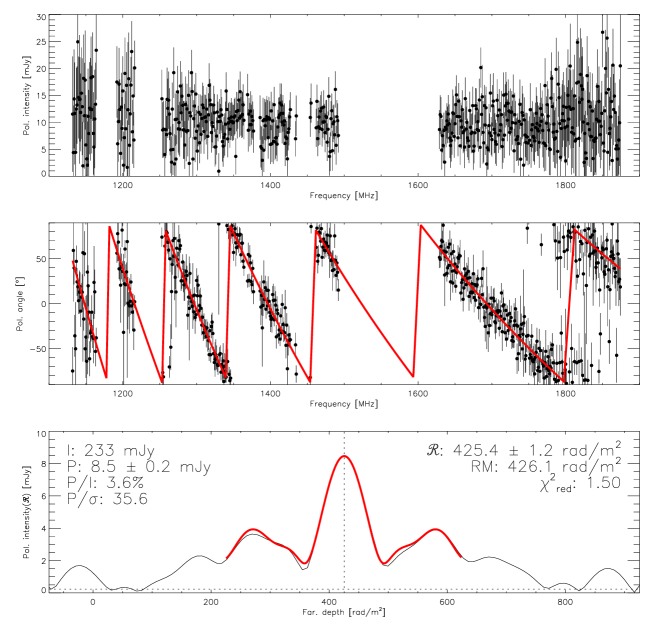
6.11 AT20G quasar study
Mahony et al. (2011) observed a sample of over 1100 QSOs to study their radio luminosity distribution, a subject that has long been debated in the literature (e.g., Kellermann et al. 1989, Cirasuolo et al. 2003). QSOs are often separated into two categories; ‘radio-loud’ and ‘radio-quiet’, but the dividing line between these two classes remains unclear. The increased bandwidth of CABB, and hence increased sensitivity compared to the original ATCA correlator, allows a large sample of objects to be observed in a smaller amount of time, whilst also probing further into the ‘radio-quiet’ regime. A more detailed description of the observing program is given in (Mahony et al. 2010b). Targets were selected from the RASS–6dFGS catalogue (Mahony et al. 2010a); a catalogue of 3405 AGN selected from the ROSAT ALL Sky Survey (RASS) Bright Source Catalogue (Voges et al. 1999) that were observed as part of the 6dF Galaxy Survey (6dFGS; Jones et al. 2009). The observations were carried out in snapshot mode using a hybrid array (H168) on the ATCA from 2008 to 2010, using a two-step process. Firstly, all sources were observed for seconds reaching an r.m.s. noise of 0.2 mJy. Secondly, non-detections were re-observed for minutes, reaching an r.m.s. noise of 0.1 mJy.
Preliminary results are shown in Fig. 31 which compares the 20 GHz flux densities (vs redshift) of the X-ray selected sample achieved pre-CABB and with CABB (since March 2009). It highlights the significant increase in sensitivity that CABB has achieved in comparison to the original correlator.
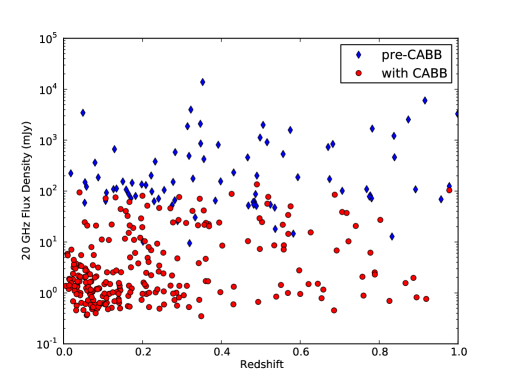
6.12 Surprising S-Z results for Two Clusters
Pre-CABB, no Sunyaev-Zeldovich Observations (S-Z) observations with resolution better than a few arc minutes were possible. Even for rich clusters of galaxies many days of integration were required to marginally detect the low brightness S-Z dip.
This all changed with the increased sensitivity provided by the CABB system. Two independent observations of different galaxy clusters made with CABB at 18 GHz detected the S-Z dip with sub arc minute resolution and in both observations the S-Z was displaced from the peak of the X-ray emission from the cluster gas.
Massardi et al. (2010) observed CL J0152–1357, a massive cluster at = 0.83, and concluded that the cluster was still recovering from its merging formation; it is not in virial equilibrium and must contain lower temperature high pressure gas not detected in X-ray observations. Malu et al. (2011) observed the Bullet cluster (1E0657–56) at = 0.296. They note that the deepest S-Z features seem to avoid the regions of most intense X-ray emission (see Fig. 32). These two independent results support Malu et al.’s assertion that modeling cluster dynamics is non trivial and that our lack of understanding of cluster merger astrophysics may be limiting our ability to model the cosmological distribution of S-Z counts.
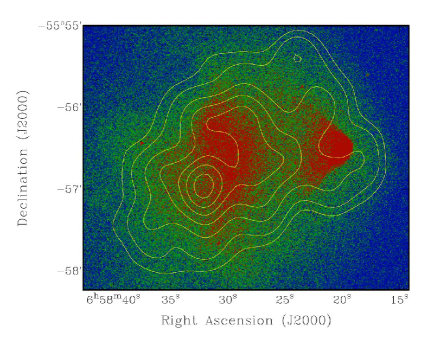
6.13 Pulsar binning
CABB is capable of operating in pulsar mode, where a pulse profile can be recorded every cycle for each frequency channel for each polarization in up to two IFs. Typically 32 phase bins across the pulsar period can be recorded with a minimum bin time of 110s.
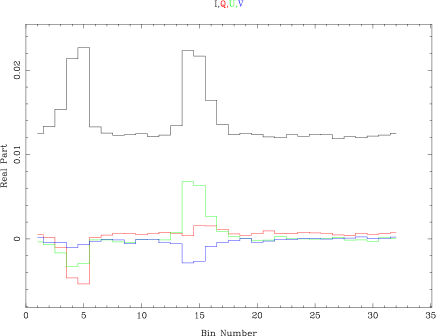
Observations in pulsar mode require knowledge of the pulsar rotation’s period at the observatory and how the period changes over the course of the observation. This is done using a tempo2 predictor file (Hobbs et al. 2009) and requires that the pulsar ephemeris details are stored in the pulsar catalogue. If this is the case then the code ”psrpred” can be executed on the correlator computer to set up the predictor file.
Various science applications for pulsar mode can be conceptualised. One example is to determine where pulsars emit during the so-called off-pulse phase or whether the emission there is truely zero. A further application would be the removal of the pulsar signal to determine whether there is underlying emission from a pulsar wind nebula (Stappers, Gaensler & Johnston 1999). Finally, transient continuum (unpulsed) emission from a pulsar system can also be detected and the flux density measured without contamination from the pulsar signal (Johnston et al. 2005).
The periastron passage of the pulsar PSR B1259–63 around its companion Be star is known to produce transient emission over a wide range of wavelengths, from the radio to the TeV. The most recent periastron occurred on 14 Dec 2010, and a major campaign was mounted to maximise the coverage over the electromagnetic spectrum. In the radio, observations were made at the ATCA on a regular basis from early Nov 2010 until Mar 2011 using CABB in pulsar mode. Fig. 33 shows an observation made at 9 GHz on 11 Jan 2011. The two pulses which make up this pulsar’s profile are clearly seen sitting on a pedestal of transient emission with a flux density of 12 mJy. The transient emission is unpolarized. However, the pulsar itself is highly polarized (including circular polarization) as shown by the lower traces. Full analysis of this data is still in progress.
6.14 SEDs for AT20G sources observed by Planck
The Australia Telescope 20 GHz (AT20G) Survey (Murphy et al. 2010; Massardi et al. 2011a) used a custom-made analogue correlator, with 8 GHz of bandwidth in dual polarization, on three antennas and was completed while the CABB system was under construction. Although it had similar bandwidth to CABB, it had no delay tracking, so could not be used to follow-up sources after the survey was completed. CABB follow-up observations of 483 AT20G sources provided flux density measurements almost simultaneously with Planck observations (Massardi et al. 2011b). These extend the frequency coverage of Planck providing for the first time the instantaneous Spectral Energy Distributions (SED) of the brightest AGN from 4.5 to 40 GHz (ATCA) and from 30 to 857 GHz (Planck). The project is known as the ”Planck-ATCA Co-eval Observations” (PACO). As an example we show the SED of PKS B1921–293 (also known as OV–236 or here AT20G J192451–291430), a redshift 0.35 QSO and a very bright flat spectrum AGN (see Fig. 34), often used as ATCA bandpass calibrator at mm-wavelengths. The wide-bandwidth multi-frequency CABB data samples a large fraction of the SED, up to 40 GHz, and shows continuity with the Planck Early Release Compact Source Catalogue (ERCSC, Planck Collaboration 2011) data at higher frequencies. The multi-epoch CABB data highlight the importance of near simultaneous observations to sample the full SED without the distortion due to variability.
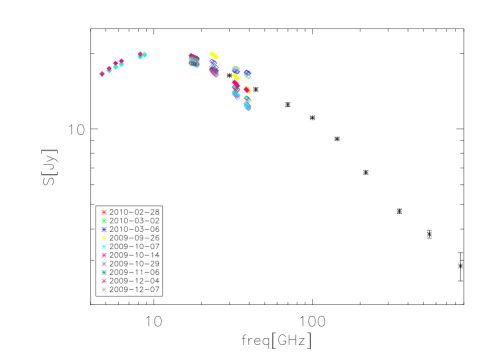
7 Summary
The Compact Array Broadband Backend (CABB) upgrade has been described and its potential for new discoveries demonstrated. The high flexibility of CABB allows a large range of oberving modes, providing wide bandwidth as well as high spectral resolution and full polarization output. The increased bandwith, effectively by a factor 20 (from 100 MHz of useable bandwidth in the original correlator to the full CABB 2 GHz bandwidth), available in two IF bands (dual polarization) or four IF bands (single polarization) together with multi-bit digitisation and much improved instantaneous -coverage (for continuum observations) has substantially advanced the science capabilities of the ATCA. Furthermore, the widening and combination of the original, relatively narrow 20-cm and 13-cm bands to one broad band spanning 1.1 to 3.1 GHz allows multi-line (e.g., searching for H i and OH emission and absorption lines) plus continuum observations over a large range of velocities. We hope that you, the reader, will be tempted to observe with the new system if you have not already done so.
Acknowledgements
The CABB project is grateful for the funding received through the Australian Government’s Major National Research Facilities (MNRF) 2001 program. Our appreciation also goes to the engineers and technicians at CSIRO’s Marsfield and Narrabri sites whose dedicated efforts made for the successful design, construction and implementation of this system. We thank the editor and the referee for a delightful report, improving the content and clarity of the paper.
References
- [2004] Adams, T.J., Bunton, J.D., Kesteven, M.J. 2004, ExA 17, 279
- [1984] Aumann, H.H. 1984, BAAS, 16, 483
- [2008] Bauer, F., et al. 2008, ApJ 688, 1210
- [2003] Benjamin, R.A., et al. 2003, PASP 115, 953
- [2008] Beswick, R.J., et al. 2008, MNRAS 385, 1143
- [2007] Beuther, H., Walsh, A.J., Thorwirth, S., Zhang, Q., Hunter, T.R., Megeath, S.T., Menten, K.M. 2008, A&A 481, 169
- [2008] Beuther, H., Walsh, A.J., Thorwirth, S., et al. 2007, A&A 466, 989
- [2010] Bowen, M., Doherty, P., Dunning, A., Kanoniuk, H., Moorey, G., Reilly, L., Sykes, P. 2010, Proc. WARS, p. 46
- [2005] Brentjens, M.A., & De Bruyn, A.G. 2005, A&A 441, 1217
- [2000] Brooks, J.W., Hall, P.J., Sinclair, M.W., Wilson, W.E., Kesteven, M.J. 2000, Proc. WARS, p. 182
- [2003] Brooks, K.J., Garay, G., Mardones, D., Bronfman, L. 2003, ApJ 594, L131
- [1991] Brown, R.L., Vanden Bout, P.A. 1991, AJ 102, 1956
- [2004] Bunton, J.D. 2004, ExA 17, 251
- [2009] Burke-Spolaor, S., Ekers, R. D., Massardi, M., Murphy, T., Partridge, B., Ricci, R., Sadler, E. M. 2009, MNRAS, 395, 504
- [1987] Caswell, J.L., Haynes, R.F. 1987, A&A 171, 261
- [2011] Caswell, J.L., Green, J.A. 2011, MNRAS 411, 2059
- [2003] Cirasuolo M., et al. 2003, MNRAS 346, 447
- [Clark & Porter(2004)] Clark, J.S., Porter, J.M. 2004, A&A 427, 839
- [1970] Cooper, B.F.C. 1970, Aust. J. Phys. 23, 521
- [2010] Coppin, K., Chapman, S., Smail, I., Swinbank, M., Walter, F., Wardlow, J., Weiss, A., Alexander, D. M., et al. 2010, MNRAS 407, L103
- [1997] Crifo, F. et al. 1997, A&A 320, L29
- [1997] Curran, S.J., Koribalski, B.S., Bains, I. 2008, MNRAS 389, 63
- [1984] Danks, A.C., Wamsteker, W., Shaver, P.A., & Retallack, D.S. 1984, A&A 132, 301
- [2009] DeBoer, D.R., et al. 2009, Proc. IEEE 97, 1507
- [2011] Deller, A., et al. 2011, PASP 123, 275
- [1978] Ekers, R.D., Goss, W.M., Kotanyi, C.G., Skellern, D.J. 1978, A&A 69, L21
- [1992] Ekers, R.D., Whiteoak, J.B. 1992, JEEE 12, 225
- [2001] Ekers, R.D., Bell, J.F. 2001, IAU Symposium 196, p. 199
- [2008] Emonts, B.H.C., Morganti, R., Oosterloo, T. A., Holt, J., Tadhunter, C. N., van der Hulst, J. M., Ojha, R., Sadler, E. M. 2008, MNRAS 387, 197
- [2011a] Emonts, B.H.C., Feain, I., Mao, M.Y., Norris, R.P., Ekers, R.D., Miley, G., Sadler, E. M., Villar-Martín, M., et al., 2011a, ApJL, submitted
- [2011b] Emonts, B.H.C., Norris, R.P., Feain, I., Miley, G., Sadler, E.M., Villar-Martín, M., Mao, M.Y., Oosterloo, T.A., et al. 2011b, MNRAS, in press (arXiv/1103.5806)
- [2002] Ferris, R.H., & Wilson, W.E. 2002, URSI XXVIIth General Assembly, Maastricht, 17–24 August 2002, poster 1629
- [2004] Ferris, R.H., & Saunders, S.J. 2004, ExA 17, 269
- [2011] For, B., Koribalski, B.S., Jarrett, T. 2011, in prep.
- [1992] Frater, R.H., Brooks, J.W. 1992, JEEE 12, Special Issue editors, p. 100 – 232
- [1992] Frater, R.H., Brooks, J.W., Whiteoak, J.B. 1992, JEEE 12, 103
- [1977] Freeman, K. et al. 1977, A&A 55, 445
- [2004] Gordon, D. 2004, IVSG Conf. Proc., p. 265
- [1980] Goss, W.M., Danziger, I.J., Fosbury, R.A.E., Boksenberg, A. 1980, MNRAS, 190, 23
- [2004] Gough, R., Archer, J., Roberts, P., Moorey, G., Graves, G., Bowen, M., Kononiuk, H. 2004, in Proc. 12th European Gallium Arsenide and other Compound Semiconductors Application Symposium, p. 359
- [2004] Greve, T.R., Ivison, R.J., Papadopoulos, P.P., 2004, A&A 419, 99
- [1997] Hall, P.J., Brooks, J.W., Sinclair, M.W., Wilson, W.E., Kesteven, M.J. 1997, Proc. WARS, Barossa Valley, Australia, p. 65
- [2006] Haverkorn, M., Gaensler, B.M., McClure-Griffiths, N.M., Dickey, J.M., Green, A.J. 2006, ApJS 167, 230
- [2010] Hindson, L., Thompson, M.A., Urquhart, J.S., Clark, J.S., Davies, B. 2010, MNRAS 408, 1438
- [2009] Hobbs, G., et al. 2009, MNRAS 394, 1945
- [2007] Holt, J., Tadhunter, C.N., González Delgado, R.M., Inskip, K.J., Rodriguez, J., Emonts, B.H.C., Morganti, R., Wills, K.A. 2007, MNRAS 381, 611
- [2006] Hunter, T.R., Brogan, C.L., Megeath, S.T., et al. 2006, ApJ 649, 888
- [1992] James, G.L. 1992, JEEE 12, 137
- [2010] James, C., Ekers, R.D., et al. 2010, Physical Review D, Vol 81, 042003
- [2011] James, C., Protheroe, R.J., Ekers, R.D., et al. 2011, MNRAS 410, 885
- [2005] Johnston, S., et al. 2005, MNRAS 358, 1069
- [2007] Johnston, S., et al. 2007, PASA 24, 174
- [2007] Johnston, S., et al. 2008, ExA 22, 151
- [2009] Jones, D.H., et al. 2009, MNRAS 399, 683
- [1999] Jones, K.L., Koribalski, B.S., Elmouttie, M., Haynes, R.F. 1999, MNRAS 302, 649
- [1989] Kellermann, K., et al., 1989, AJ 98, 1195
- [1999] Killeen, N.E.B., Fluke, C.J., Zhao, Jum-Hui, Ekers, R.D. 1999, MNRAS, submitted (MZ381)
- [2005] Klamer, I.J., Ekers, R.D., Sadler, E.M., Weiss, A., Hunstead, R.W., De Breuck, C. 2005, ApJL 621, L1
- [1997] Koribalski, B.S. 1997, Proc. WARS, Barossa Valley, Australia, p. 3
- [2008] Kramer, C., Moreno, R., Greve, A. 2008, A&A 482, 359
- [1997] Krolik, J.H., Chen, W. 1991, AJ 102, 1659
- [2010] Lagrange, A.-M., et al. 2010, Science 329, 57
- [2009] Lonsdale, C.J., et al. 2009, Proc. IEEE 97, 1497
- [2011] Maddison, S., Wright, C. 2011, in prep.
- [2010a] Mahony, E.K., Croom, S.M., et al. 2010, MNRAS 401, 1151
- [2010b] Mahony, E.K., Sadler, E.M., Croom, S.M., Ekers, R.D., Feain, I.J., Murphy, T. 2010, ISJKAF2010, Proc. of Science, in press (astro-ph/1008.4429)
- [2011] Mahony, E.K., et al. 2011, in prep.
- [2010] Malu, S.S., Subrahmanyan, R., Wieringa, M., Narasimha, D. 2011, submitted (arXiv:1005.1394)
- [1995] Manchester, R.N., Johnston, S. 1995, ApJ 441, L65
- [2010] Manchester, R.N. et al. 2010, ApJ 710, 1694
- [2010] Massardi, M., Ekers, R.D., Ellis, S., Maughan, B. 2010, ApJ 718, L23
- [2011a] Massardi, M., Ekers, R.D., et al. 2011a, MNRAS 412, 318
- [2011b] Massardi, M., Bonaldi, A., Bonavera, L., López-Caniego, M., De Zotti, G., Ekers, R.D. 2011b, MNRAS, in press (arXiv:1101.0225)
- [2008] McFadden, R., Bhat, N.D.R., Ekers, R.D., James, C.W., Jones, D., Tingay, S.J., Roberts, P.P., Phillips, C.J., Protheroe, R.J. 2008, Proc. International Cosmic Ray Conf., Vol 5, 1549
- [2010] McFadden, R. Ekers, R.D., et al. 2010, in prep.
- [2004] McGrath, E.J., Goss, W.M., De Pre, C.G. 2004, ApJS 155, 577
- [2011] Middelberg, E., Norris, R.P., Hales, C.A., Seymour, N., Johnston-Hollitt, M., Huynh, M.T., Lenc, E., Mao, M.Y. 2011, A&A 526, 8
- [2006] Moorey, G., et al. 2006, Proc. WARS, R-30 & R-31
- [2008] Moorey, G.G., Bolton, R.J., Bowen, M.A., Carrad, G.J., Dunning, A., Gough, R.G., Graves, G.R., Kononiuk, H.P., Reilly, L.J. 2008, in Proc. 38th European Microwave Conference, IEEE, New York, p. 155
- [2010] Muller, E. et al. 2010, ApJ 712, 1248
- [2010] Murphy, T., Sadler, E. M., Ekers, R.D., et al. 2010, MNRAS 402, 2403
- [2006] Norris, R.P., et al. 2006, AJ 132, 2409
- [1986] Orton, G.S., Griffin, M.J., Ade, P.A.R., Nolt, I.G., Radostitz, J.V. 1986, Icarus 67, 289
- [2000] Papadopoulos, P.P., Röttgering, H.J.A., van der Werf, P.P., Guilloteau, S., Omont, A., van Breugel, W.J.M., Tilanus, R.P.J. 2000, ApJ 528, 626
- [2001] Papadopoulos, P., Ivison R., Carilli C., Lewis G. 2001, Nature 409, 58
- [1988] Perley, R., Schwab, Bridle, A. 1988, ASP Conf. Series Vol. 6
- [2009] Perley, R., et al. 2009, Proc. IEEE 97, 1448
- [2011] Planck Collaboration et al., 2011, A&A, submitted (arXiv:1101.2041)
- [1994] Reynolds, J. 1994, ATNF Memo (AT/39.3/040)
- [1995] Sault, R.J., Teuben, P.J., Wright, M.C.H. 1995, ASP Conf. Series, Vol. 77, 433
- [2003] Sault, R.J. 2003, ATNF Memo (AT/39.3/124)
- [1984] Smith, B.A., Terrile, R.J. 1984, Science 226, 1421
- [2009] Reid, M.J., Menten, K.M., Zheng, X.W., Brunthaler, A., Xu, Y. 2004, ApJ 705, 1548
- [1995] Roberts, P.P., Town, G.E. 1995, IEEE Trans. Microwave Theory and Techniques, Vol. 43, No. 4, p. 739
- [2007] Rodríguez, L.F., Zapata, L.A., Ho, P.T.P. 2007, ApJ 654, L143
- [1992] Sinclair, M.W., Graves, G.R., Gough, R.G., Moorey, G.G. 1992, JEEE 12, 147
- [1997] Shepherd, M.C. 1997, ADASS VI, ASP Conf. Series 125, 77
- [1999] Stappers, B.W., Gaensler, B.M., Johnston, S. 1999, MNRAS 308, 609
- [1998] Taylor, G., Carilli, C., Perley, R. 1998, ASP Conf. Vol. 180
- [2002] Thompson, A.R., Moran, J.M., Swenson, G.W., Jr. 2002, Interferometry and Synthesis in Radio Astronomy, 2nd edition, Wiley, New York
- [2008] Urquhart, J.S., Hoare, M.G., Lumsden, S.L., Oudmaijer, R.D., Moore, T.J.T. 2008, Massive Star Formation: Observations Confront Theory, 387, 381
- [2010] Urquhart, J.S., Hoare, M.G., Purcell, C.R., Brooks, K.J., Voronkov, M.A., Indermuehle, B.T., Burton, M.G., Tothill, N.F.H., Edwards, P.G. 2010, PASA 27, 321
- [2001] Véron-Cetty, M.P. & Véron, P. 2001, A&A 375, 791
- [1999] Voges, W., et al. 1999, A&A 349, 389
- [2006] Voronkov, M.A., Brooks, K.J., Sobolev, A.M., Ellingsen, S.P., Ostrovskii, A.B., Caswell, J.L. 2006, MNRAS 373, 411
- [1998] Walsh, A.J., Burton, M.G., Hyland, A.R., & Robinson, G. 1998, MNRAS 301, 640
- [2010] Walsh, A.J., Thorwirth, S., Beuther, H., Burton, M.G. 2010, MNRAS 404, 1396
- [2011] Wilner, D.L., Andrews, S.M., Hughes, A.M. 2011, ApJ 727, L42
- [1992] Wilson, W.E., Davis, E.R., Loone, D.G., Brown, D.R. 1992, JEEE 12, 187
- [2005] Wilson, W.E., Ferris, D. 2005, Proc. 4th eVLBI workshop (published online at www.atnf.csiro.au/vlbi/evlbi2005)
- [2000] Wilson, W.E. 2000, Encyclopedia of Astronomy and Astrophysics, ed. Paul Murdin, article 2918 (online)
- [2008] Wyatt, M.C. 2008, ARA&A 46, 339
- [2001] Zuckerman, B. et al. 2001, ApJ 562, L87
- [2010] de Zotti et al. 2010, A&A Reviews 18, 1