Main-Belt Comet 238P/Read Revisited 111 Some of the data presented herein were obtained at the W. M. Keck Observatory, which is operated as a scientific partnership among the California Institute of Technology, the University of California, and the National Aeronautics and Space Administration. The Observatory was made possible by the generous financial support of the W. M. Keck Foundation. Some data presented herein were also obtained at ESO facilities at La Silla under program ID 085.C-0363(A).
Abstract
We present a series of observations of the return of activity in main-belt comet 238P/Read. Using data obtained in July and August 2010 when 238P appeared to be largely inactive, we find best-fit IAU phase function parameters of mag, corresponding to a nucleus radius of km (assuming an albedo of ), and . Observations from September 2010 onward show a clear rise in activity, causing both a notable change in visible morphology and increasing photometric excesses beyond what would be expected based on bare nucleus observations. By the end of the observing period reported on here, the dust mass in the coma shows indications of reaching a level comparable to that observed in 2005, but further observations are highly encouraged once 238P again becomes observable from Earth in late 2011 to confirm whether this level of activity is achieved, or if a notable decrease in activity strength compared to 2005 can be detected. Comet 238P is now the second main-belt comet (after 133P/Elst-Pizarro) observed to exhibit recurrent activity, providing strong corroboration for the conclusion that it is a true comet whose active episodes are driven by sublimation of volatile ice.
keywords:
comets: general — comets: individual (238P/Read) — minor planets, asteroids1 INTRODUCTION
Main-belt comets (MBCs) are a recently-identified population of solar system objects that exhibit cometary activity but are dynamically indistinguishable from main-belt asteroids (Hsieh & Jewitt, 2006). Discovered on UT 2005 October 24 (Read et al., 2005), comet 238P/Read (hereafter, 238P) was the second main-belt comet to be discovered. A physical study of the comet shortly following its discovery found that its activity was consistent with dust emission driven by the sublimation of recently excavated subsurface ice, and inconsistent with impact-driven dust emission, meaning that 238P is a true comet (Hsieh et al., 2009b), and not a disrupted asteroid (cf. Jewitt et al., 2010). That study further found a mass loss rate roughly an order of magnitude larger than that calculated for the first known MBC, 133P/Elst-Pizarro (Hsieh et al., 2004). This higher rate of dust emission may indicate that 238P’s activity was triggered much more recently than that of 133P, and therefore is driven by the sublimation of a much less depleted volatile supply (Hsieh et al., 2009b).
Haghighipour (2009) found 238P to be dynamically unstable on a time scale of 20 Myr. Its proximity to the Themis collisional family, however, suggests that it may have once been a stable Themis family member, but was destabilized (via a gradual increase of its orbital eccentricity) by the nearby 1:2 mean-motion resonance with Jupiter. As such, despite its current instability, 238P may be physically related, and therefore compositionally similar, to actual Themis family members and fellow MBCs 133P and 176P/LINEAR.
2 OBSERVATIONS
-band observations of 238P were made in photometric conditions between July and December 2010 using the 4.2 m Southern Astrophysical Research (SOAR) telescope at Cerro Pachon and the 3.54 m New Technology Telescope (NTT) at La Silla, both in Chile, and the 10 m Keck I and 2.2 m University of Hawaii (UH) telescopes on Mauna Kea in Hawaii. Details of these observations are listed in Table 1. Observations with SOAR were made using the SOAR Optical Imager (SOI; Schwarz et al., 2004) which utilizes a mosaic of two E2V pixel CCDs ( pixel-1 using 22 binning) behind standard Kron-Cousins broadband filters. NTT observations were made using the ESO Faint Object Spectrograph and Camera (EFOSC2; Buzzoni et al., 1984), which employs a pixel Loral/Lesser CCD ( pixel-1 using 22 binning), behind Bessel broadband filters. Observations with Keck were made using the Low Resolution Imaging Spectrometer (LRIS; Oke et al., 1995) in imaging mode. LRIS employs a Tektronix CCD with an image scale of pixel-1 and Kron-Cousins filters. UH 2.2 m observations were made using a Tektronix pixel CCD ( pixel-1) behind Kron-Cousins filters.
Standard bias subtraction and flat-field reduction were performed on all data. For SOAR, NTT, and UH 2.2 m data, flat fields were constructed from dithered images of the twilight sky, while images of the illuminated interior of the dome were used to construct flat field images for Keck data. Photometry of Landolt (1992) standard stars and field stars was obtained by measuring net fluxes within circular apertures, with background sampled from surrounding circular annuli. Comet photometry was performed using circular apertures with radii selected to match the seeing conditions of each night, but to avoid the contaminating effects of the coma, background sky statistics were measured manually in regions of blank sky near, but not adjacent, to the object. Field stars in each comet image were also measured to assess and correct for extinction variation during each night.
3 RESULTS
3.1 Morphology
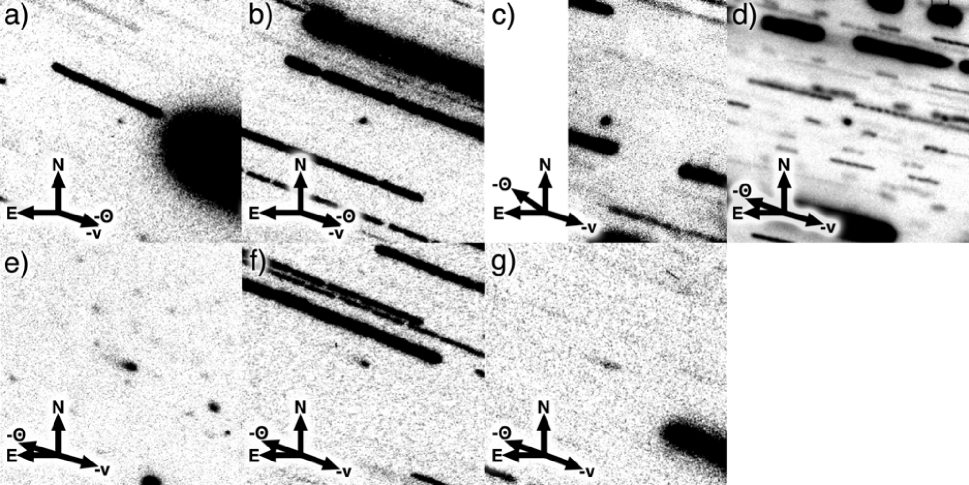
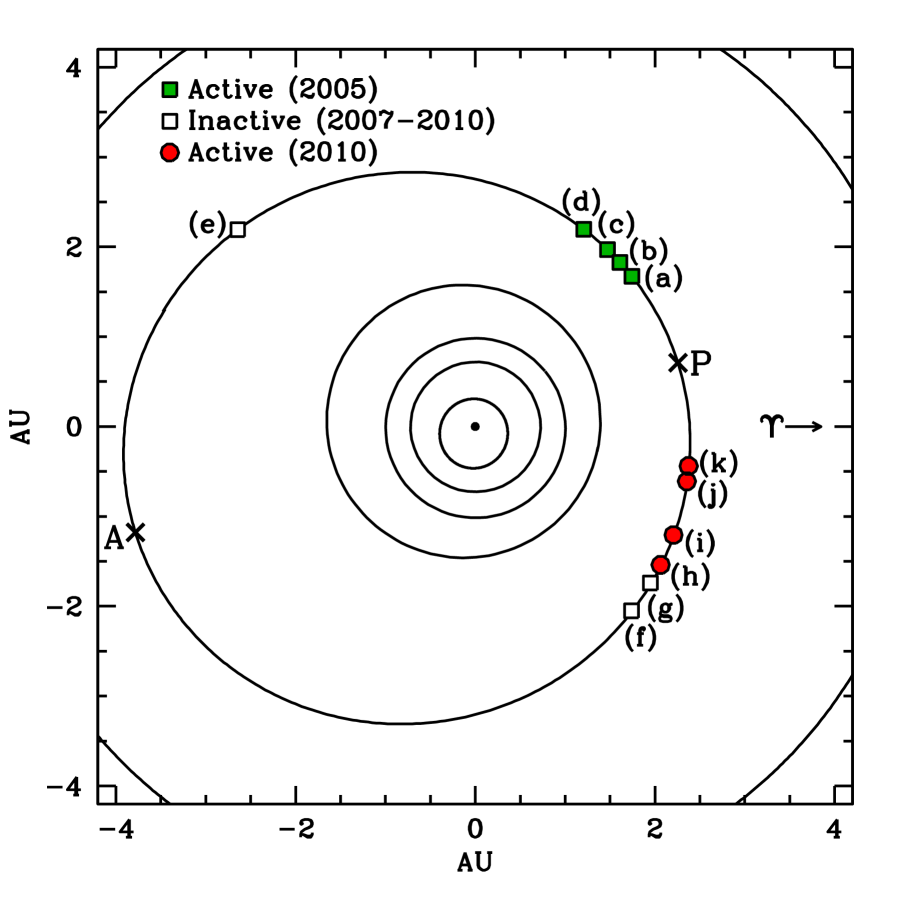
To search for and characterize faint activity for 238P, we obtained multiple exposures of the comet each night. Nightly images were then shifted (using linear interpolation) to place the comet in the same location and then added together to create deep composite images (Fig. 1). These deep composite images chronicle a rise in activity for 238P over the course of these observations. While in principle, residual dust could remain from the comet’s 2005 outburst, there is a clear transition from a nucleus-dominated morphology in July, August, and September (Fig. 1a-c) to a coma-dominated morphology in October and November (Fig. 1d-e), the latter of which strongly resembles the morphology observed in 2005 (Hsieh et al., 2009b). As shown in Figure 2, these observations tightly constrain the time and orbital position of the onset of 238P’s current active episode. This morphological transition is a strong indication that renewed dust production took place during this period, a key finding for ascertaining the origin of that dust production, and an issue we consider further in §3.2.1.
3.2 Photometry
3.2.1 Phase Function Analysis
The variation of an object’s brightness with solar phase angle (i.e., its phase function) is dependent on properties of that object’s regolith, including albedo, particle size distributions, surface roughness, and porosity (cf. Helfenstein & Veverka, 1989; Muinonen et al., 2002). Comparisons of phase function parameters found for different objects therefore provide a means for comparing the objects’ surface properties themselves.
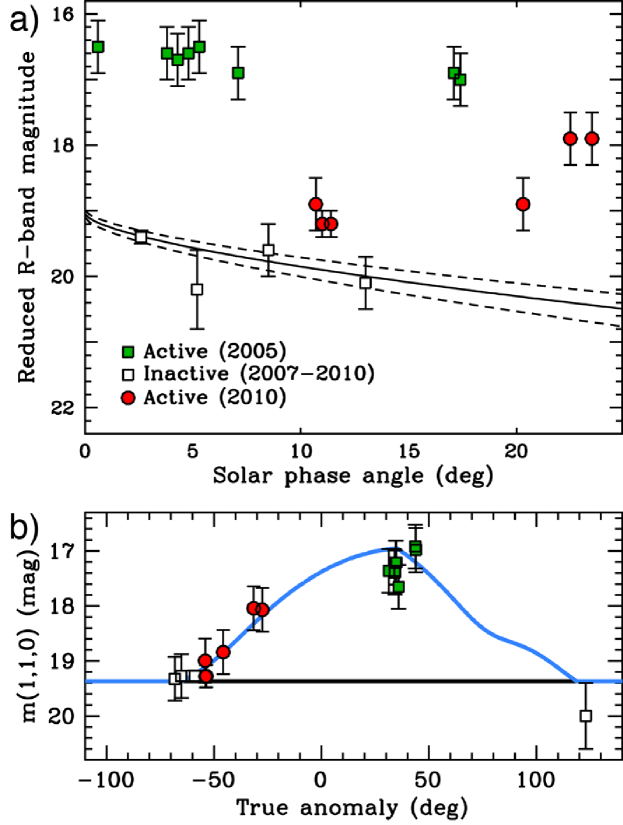
Using data obtained in July and August 2010 when 238P was observed to be largely inactive, we obtain the best-fit phase function plotted in Figure 3a, defined by an absolute magnitude (at and AU) of mag and slope parameter in the IAU system (corresponding to a linear phase-darkening coefficient of mag deg-1). For this fit, we omit the inactive but extremely faint January 2007 observation from Hsieh et al. (2009b) which we judged to be unreliable. For comparison, the slope parameters calculated for MBCs 133P and 176P are and (Hsieh et al., 2009a), respectively, and the range of slope parameters measured for other kilometer-scale Themis asteroids is (Hsieh et al., 2008). This result therefore reinforces findings to date that aside from their cometary activity, MBCs exhibit no observable physical differences from dynamically similar but inert members of the background asteroid population. Using a geometric -band albedo of , consistent with that of other MBCs (Hsieh et al., 2009a), we estimate an effective nucleus radius for 238P of km.
Comparison of the remainder of our 2010 data to magnitudes predicted for an inactive 238P nucleus using the phase function derived here reveals a steadily increasing photometric excess for data from September through December 2010, corroborating the conclusion of our morphological analysis (§3.1) that 238P experienced renewed dust production, likely to be sublimation-driven (see §3.2.2), during this period. Plotting data (corrected to normalized photometry apertures) from both 2005-2007 and 2010 (Table 2) as a function of true anomaly (Fig. 3b), we find comparable photometric excesses in both data sets, with the excess observed in 2010 appearing poised to rise to the level observed in 2005. Further observations will be required when 238P reaches a comparable point in its orbit in late 2011 to confirm whether its current activity actually reaches a level comparable to its previous active episode.
3.2.2 Sublimation Modeling
To further analyze the photometric excesses detected in our data (§3.2.1), we employ a thermal sublimation model to estimate the grain flux, which can then be used to derive the estimated photometric enhancement expected from a sublimating surface (Meech et al., 1986). This model is capable of simulating multiple volatile components, but previous thermal modeling has shown that crystalline water ice is the only cometary volatile that is likely to be present on MBCs (Schorghofer, 2008; Prialnik & Rosenberg, 2009). As such, for 238P, we only consider the action of H2O ice sublimation.
For the purposes of the model, we assume that the comet’s activity profile is identical during each apparition, permitting us to combine observations from 2005 and 2010 by parameterizing them by true anomaly. Due to the highly underconstrained nature of this modeling effort, we do not conduct a systematic search of the entire available parameter space, but instead seek to simply find a plausible sublimation scenario that reproduces our limited observations. Using standard assumptions for albedo and emissivity used for other comets and primitive asteroids, we find that our data fit plausibly well to a model in which activity turns on at (corresponding to 06 December 2004, or 21 July 2010), rising exponentially until reaching a maximum (scaled to match the maximum activity intensity) at (24 November 2005, or 06 July 2011), and then immediately declining exponentially and ceasing at (07 January 2007, or 08 August 2012).
Given the numerous underconstrained free parameters in our model, these activity initiation, peak, and cessation points certainly do not represent a unique solution and therefore do not necessarily reflect the precise reality of this comet’s active behavior. They do, however, represent a plausible scenario in which 238P’s activity is driven by the sublimation of water ice, accomplishing the primary goal of our modeling efforts.
From our models, we find a likely active area equivalent to % of 238P’s total surface area, which for a km body, represents an active area of m2, equivalent to a circular region with a radius of m. This radius is about an order of magnitude larger than the radius of the active area estimated for 133P (Hsieh et al., 2004). Along with 238P’s smaller size and therefore lower escape velocity for emitted dust particles, the larger physical size of its active area is consistent with its dramatically more vigorous activity compared to 133P.
Using the models, we also derive a maximum launchable dust grain size of mm, assuming a freely-sublimating surface. If sublimation is concentrated in vents, even larger grains could potentially be emitted. As such, long-lasting residual activity due to slow-dissipating large grains from 238P’s previous active apparition in 2005 cannot be ruled out by the results of this modeling. Whether remnants of previous dust emission episodes are present or not, however, we already find strong evidence of renewed dust production in analyses discussed in §3.1 and §3.2.1.
The delay in peak activity for 238P until past perihelion as implied by the best-fit model suggests either (1) the ice reservoir driving the observed cometary activity is located at some depth below the surface, delaying the onset of activity until a solar radiation-driven thermal wave of sufficient intensity is able to propagate to that depth, or (2) activity is modulated by seasonal effects as hypothesized for 133P (Hsieh et al., 2004) where maximum solar insolation of an isolated active site is primarily a function of an object’s obliquity and solstice position, not heliocentric distance. If (1) is correct, we would expect all MBCs to exhibit peak activity shortly after perihelion. If (2) is correct, we would expect other MBCs to be equally likely to exhibit peak activity before perihelion as well. Thus far, all the known MBCs primarily exhibit post-perihelion activity, though better characterization of precise activation and cessation points, as well as the discovery and characterization of a larger sample MBCs, are required to determine whether (1) or (2) is the primary mechanism for MBC activity modulation.
4 DISCUSSION
Our finding of renewed dust production is strong confirmation that 238P is exhibiting genuine cometary activity driven by the sublimation of volatile ice. As concluded for 133P (Hsieh et al., 2004), repeated activity is extremely unlikely to occur if 238P’s observed dust emission is simply an ejecta cloud produced by an impactor striking inert asteroidal regolith. This scenario would require two separate collisions to occur on 238P within less than 5 years, when collisions causing similar behavior are not observed anywhere nearly as frequently on other nearby asteroids. The extraordinarily coincidental timing required to produce two active episodes at nearly the same portions of 238P’s orbit further decreases the plausibility of impact generation for its activity. A far more plausible explanation is that 238P’s activity is driven by the sublimation of volatile ice, perhaps preserved in a subsurface reservoir still reachable (after a delay) by solar insolation, or contained within an isolated area exposed on the surface via collisional excavation and subsequently subjected to seasonal variations (either due to the object’s obliquity, in direct analogy to Earth’s seasons, or possibly also related to the local topography surrounding the active site) in solar radiation.
Observations of 238P’s activity in 2010 are thus far insufficient to evaluate the suggestion made by Hsieh et al. (2009b) that we had perhaps witnessed the immediate aftermath of a collisional activation of the MBC in 2005 and that subsequent outbursts may be much weaker. The observations of 238P reported here were made at a different portion of its orbit than in 2005 and it is unclear whether the activity will increase or decline in intensity as the object progresses to that later portion of its orbit again. For this reason, further observations of 238P are highly encouraged when it again becomes observable from Earth in mid-2011.
Even if activity levels during the current active episode remain comparable to those during 2005, it is still possible that 238P was activated much more recently than less vigorously-active MBCs like 133P and 176P, except that its activity declines on a more gradual basis than from one orbit to the next. Long-term monitoring of 238P (and other vigorously-active MBCs such as P/2008 R1 (Garradd) and P/2010 R2 (La Sagra)) will help clarify this behavior and likely give valuable insights into the scale of volatile reservoirs in active MBCs, and by extension, in compositionally similar but otherwise inactive main-belt asteroids, as well as their rate of depletion once excavated.
We find that in comparison to 133P, whose periodic cometary activity appears to begin shortly before perihelion (Hsieh et al., 2010), 238P shows periodic activity beginning much earlier relative to perihelion. This discrepancy is consistent with the seasonal hypothesis proposed for the modulation of activity in 133P (and by extension, in other MBCs) (Hsieh et al., 2004), as it shows that MBC activity is not strictly correlated to heliocentric distance. This interpretation is not conclusive proof of this hypothesis, but does highlight the need for regular monitoring of other MBCs. Should MBCs consistently show activity only near perihelion, as most of the currently known MBCs do, this would be a sign that sublimation-driven cometary activity in these bodies is in fact strongly dependent on heliocentric distance, perhaps subject to moderate delays in the propagation of solar thermal waves introduced by insulating surface material. The collisional activation model for MBCs and correlated seasonal modulation hypothesis suggest, however, that other MBCs may exhibit activity well before perihelion, since under those hypotheses, activity modulation depends more on shadowing due to obliquity and topography than heliocentric distance (though some observational bias towards detections of active MBCs at smaller geocentric, and therefore heliocentric, distances is expected).
Acknowledgements.
HHH is supported by NASA through Hubble Fellowship grant HF-51274.01 awarded by the Space Telescope Science Institute, which is operated by the Association of Universities for Research in Astronomy, Inc., for NASA, under contract NAS 5-26555, and by the UK’s Science and Technology Facilities Council (STFC) through STFC fellowship grant ST/F011016/1. Some material presented here was also based on work supported by NASA through the NASA Astrobiology Institute under Cooperative Agreement No. NNA09DA77A issued through the Office of Space Science, and in part through NASA grant NNX07AF79G. Additional observing travel support was provided by the STFC through the Panel for the Allocation of Telescope Time, and the European Southern Observatory. We are grateful to Sergio Pizarro, Daniel Maturana, Angelica León, Greg Wirth, Heather Hershley, John Dvorak, Dave Brennen, Richard Morriarty, and Callie McNew for their assistance with our observations, and to Bin Yang, Pedro Lacerda, Gal Sarid, and Zahed Wahhaj for helpful comments on this manuscript.References
- Buzzoni et al. (1984) Buzzoni, B., Delabre, B., Dekker, H., Dodorico, S., Enard, D., Focardi, P., Gustafsson, B., Nees, W., Paureau, J., & Reiss, R. 1984, The ESO Messenger, 38, 9
- Haghighipour (2009) Haghighipour, N. 2009, Proc. IAUS 263, 207
- Helfenstein & Veverka (1989) Helfenstein, P., & Veverka, J. 1989, Asteroids II, eds. R. P. Binzel, T. Gehrels, & M. S. Matthews (Tucson: Univ. of Arizona Press), 557
- Hsieh & Jewitt (2006) Hsieh, H. H., & Jewitt, D. 2006, Science, 312, 561
- Hsieh et al. (2004) Hsieh, H. H., Jewitt, D., & Fernández, Y. R. 2004, AJ, 127, 2997
- Hsieh et al. (2008) Hsieh, H. H., Jewitt, D., & Fernández, Y. R. 2008, LPI Contributions, 1405, 8200
- Hsieh et al. (2009a) Hsieh, H. H., Jewitt, D., & Fernández, Y. R. 2009, ApJ, 694, L111
- Hsieh et al. (2009b) Hsieh, H. H., Jewitt, D., & Ishiguro, M. 2009, AJ, 137, 157
- Hsieh (2010) Hsieh, H. H. 2010, IAU Circ., 9183, 2
- Hsieh et al. (2010) Hsieh, H. H., Jewitt, D., Lacerda, P., Lowry, S. C., & Snodgrass, C. 2010, MNRAS, 403, 363
- Jewitt et al. (2010) Jewitt, D., Weaver, H., Agarwal, J., Mutchler, M., & Drahus, M. 2010, Nature, 467, 817
- Landolt (1992) Landolt, A. U. 1992, AJ, 104, 340
- Meech et al. (1986) Meech, K. J., Jewitt, D., & Ricker, G. R. 1986, Icarus, 66, 561
- Muinonen et al. (2002) Muinonen, K., Piironen, J., Shkuratov, Y. G., Ovcharenko, A., & Clark, B. E. 2002, Asteroids III, eds. W. F. Bottke Jr., A. Cellino, P. Paolicchi, & R. P. Binzel (Tucson: Univ. of Arizona Press), 123
- Oke et al. (1995) Oke, J. B., Cohen, J. G., Carr, M., Cromer, J., Dingizian, A., Harris, F. H., Labrecque, S., Lucinio, R., Schaal, W., Epps, H., & Miller, J. 1995, PASP, 107, 375
- Prialnik & Rosenberg (2009) Prialnik, D., & Rosenberg, E. D. 2009, MNRAS, 399, L79
- Read et al. (2005) Read, M. T., Bressi, T. H., Gehrels, T., Scotti, J. V., & Christensen, E. J. 2005, IAU Circ., 8624, 1
- Schorghofer (2008) Schorghofer, N. 2008, ApJ, 682, 697
- Schwarz et al. (2004) Schwarz, H. E., et al. 2004, Proc. SPIE, 5492, 564
| UT Date | Tel. | MoonaaPhase of moon, in offset from new moon (“N”) in days | bbAverage seeing (FWHM) in arcsec | NccNumber of images | ddHeliocentric distance (AU) | eeGeocentric distance (AU) | ffSolar phase angle (Sun-238P-Earth) in degrees | ggTrue anomaly in degrees | hhPosition angle of the antisolar vector, as projected in the plane of the sky, in degrees east of north | iiPosition angle of the negative velocity vector, as projected in the plane of the sky, in degrees east of north | Active?jjIs visible activity detected? |
|---|---|---|---|---|---|---|---|---|---|---|---|
| 2010 Jul 07 | UH2.2 | N5 | 07 | 16 | 2.704 | 1.821 | 13.0 | 291.8 | 253.5 | 251.0 | no |
| 2010 Jul 20 | UH2.2 | N8 | 07 | 23 | 2.674 | 1.709 | 8.5 | 294.8 | 256.0 | 251.4 | no |
| 2010 Aug 15 | SOAR | N5 | 10 | 21 | 2.616 | 1.608 | 2.6 | 301.1 | 55.0 | 252.9 | no |
| 2010 Sep 03 | UH2.2 | N5 | 07 | 5 | 2.576 | 1.643 | 10.7 | 305.9 | 69.9 | 254.0 | no |
| 2010 Sep 04 | NTT | N4 | 11 | 54 | 2.574 | 1.647 | 11.0 | 306.1 | 70.1 | 254.1 | yes |
| 2010 Sep 05 | NTT | N3 | 08 | 35 | 2.572 | 1.651 | 11.4 | 306.4 | 70.3 | 254.1 | yes |
| 2010 Oct 05 | Keck | N2 | 09 | 8 | 2.514 | 1.869 | 20.3 | 314.3 | 73.0 | 254.4 | yes |
| 2010 Nov 25 | UH2.2 | N11 | 08 | 8 | 2.433 | 2.414 | 23.5 | 328.5 | 71.3 | 251.0 | yes |
| 2010 Dec 09 | UH2.2 | N3 | 08 | 10 | 2.416 | 2.566 | 22.5 | 332.5 | 70.3 | 249.7 | yes |
| UT Date | aaMean -band magnitude (averaged in flux space), measured in radius apertures | bbEstimated midpoint of -band lightcurve, assuming peak-to-trough photometric range of mag | ccReduced midpoint -band magnitude (normalized to AU) | ddDeviation between measured and predicted magnitude from best-fit phase function based on data from July-August 2010 when 238P was observed to be inactive | eeInferred ratio of scattering surface area of dust to nucleus scattering surface area | ffEstimated dust mass, in 104 kg, assuming 10 m-radius grains and =1300 kg m-3, as for 133P (Hsieh et al., 2010), contained within photometry apertures |
|---|---|---|---|---|---|---|
| 2005 Nov 10ggFrom Hsieh et al. (2009b). | 19.280.05 | — | 16.50.4 | 2.70.4 | 124 | 104 |
| 2005 Nov 19ggFrom Hsieh et al. (2009b). | 19.340.05 | — | 16.60.4 | 2.90.4 | 154 | 134 |
| 2005 Nov 20ggFrom Hsieh et al. (2009b). | 19.460.05 | — | 16.70.4 | 2.80.4 | 134 | 114 |
| 2005 Nov 21ggFrom Hsieh et al. (2009b). | 19.370.05 | — | 16.60.4 | 3.00.4 | 165 | 144 |
| 2005 Nov 22ggFrom Hsieh et al. (2009b). | 19.280.05 | — | 16.50.4 | 3.10.4 | 175 | 154 |
| 2005 Nov 26ggFrom Hsieh et al. (2009b). | 19.720.05 | — | 16.90.4 | 2.80.4 | 134 | 114 |
| 2005 Dec 24ggFrom Hsieh et al. (2009b). | 20.120.03 | — | 16.90.4 | 3.30.4 | 216 | 185 |
| 2005 Dec 25ggFrom Hsieh et al. (2009b). | 20.160.03 | — | 17.00.4 | 3.20.4 | 196 | 175 |
| 2007 Jan 27ggFrom Hsieh et al. (2009b). | 24.90.4 | — | 20.20.6 | 0.60.6 | — | — |
| 2010 Jul 07 | 23.610.10 | 23.60.4 | 20.10.4 | 0.10.4 | — | — |
| 2010 Jul 20 | 22.850.06 | 22.90.4 | 19.60.4 | 0.20.4 | — | — |
| 2010 Aug 15 | 22.340.05 | 22.50.1 | 19.40.1 | 0.00.1 | — | — |
| 2010 Sep 03 | 21.970.04 | 22.00.4 | 18.90.4 | 1.00.4 | 2.51.7 | 2.21.5 |
| 2010 Sep 04 | 22.010.05 | 22.30.2 | 19.20.2 | 0.70.2 | 1.90.3 | 1.60.3 |
| 2010 Sep 05 | 22.020.05 | 22.30.2 | 19.20.2 | 0.70.2 | 1.90.3 | 1.60.3 |
| 2010 Oct 05 | 22.250.05 | 22.30.4 | 18.90.4 | 1.40.4 | 3.61.1 | 3.11.0 |
| 2010 Nov 25 | 21.750.05 | 21.80.4 | 17.90.4 | 2.50.4 | 103 | 8.72.6 |
| 2010 Dec 09 | 21.860.07 | 21.90.4 | 17.90.4 | 2.50.4 | 103 | 8.72.6 |