Galaxy Formation in Heavily Overdense Regions at :
the Prevalence of Disks in Massive Halos
Abstract
Using a high-resolution cosmological numerical simulation, we have analyzed the evolution of galaxies at in a highly overdense region of the universe. These objects could represent the high redshift galaxies recently observed by the Hubble’s WFC3, and be as well possible precursors of QSOs at . To overcome the sampling and resolution problems in cosmological simulations of these rare regions, we have used the Constrained Realizations method. Our main result for shows the high-resolution central region of radius in comoving coordinates being completely dominated by disk galaxies in the total mass range of . We have verified that the gaseous and stellar disks we identify are robust morphological features, capable of surviving the ongoing merger process at these redshifts. Below this mass range, we find a sharp decline in the disk fraction to negligible numbers. At this redshift, the disks appear to be gas-rich compared to , and the dark matter halos baryon-rich, by a factor of above the average fraction of baryons in the universe. The dominance of disk galaxies in the high density peaks during the epoch of reionization is contrary to the morphology-density trend observed at low redshifts.
Subject headings:
galaxies: evolution — galaxies: formation — galaxies: halos — galaxies: interactions — galaxies: kinematics and dynamics — galaxies: star formation1. Introduction
Deep sky surveys are providing large sample of color-selected galaxies out to (e.g., Bouwens et al. 2007) and a growing number of spectroscopically confirmed objects (e.g., Fan et al. 2004; Malhotra et al. 2005; Stark et al. 2011). With the availability of the Wide Field Camera 3 (WFC3) on the Hubble Space Telescope (HST) more than 100 galaxies have been detected at (e.g., Bouwens et al. 2010; McLure et al. 2010; Oesch et al. 2010). These high- galaxies are expected to be significantly clustered in the high density environments (e.g., Overzier et al. 2006).
Recent studies of high-redshift QSOs have indicated that they reside in rare and highly overdense regions at , with the comoving space density of (e.g., Fan et al. 2004). These dense environments, inhabiting Gyr old Universe, can be precursors of massive clusters of galaxies at (e.g., Fan et al. 2004; Springel et al. 2005; Li et al. 2007), but not necessarily the most massive clusters (e.g., Trenti et al. 2008; Romano-Diaz et al. 2011). Chemical composition inferred from QSO spectra and additional correlations with the cosmic star formation history indicate a possible link between galaxy evolution and the QSOs — being metal-rich they plausibly are located at the centers of massive galaxies (Graham et al. 2001; Barth et al. 2003; Bunker et al. 2004).
Galaxy evolution in these overdensities can differ from that in the field, both quantitatively and qualitatively, due to earlier formation times, an absence or a decreased intensity of the background UV field, and a possible radiative and mechanical feedback from the QSOs. The reionization of the Universe could start with these regions as early as and extend to (e.g., Becker et al. 2001; Barkana 2002; Cen & McDonald 2002). But the population of galaxies responsible for re-ionization of the Universe is not yet found. It is also not clear at present what fraction of overdense regions and to what extent is affected by QSOs and background UV.
The most overdense peaks are hard to sample with cosmological simulations at high resolution. Recent detections of candidate galaxies and proto-clusters at , have inspired us to study properties of galaxies at these redshifts (e.g., Trenti et al. 2011a,b; Bouwens et al. 2011; Oesch et al. 2011; Capak et al. 2011), and this is first in the series of papers on this issue. Circumventing the difficulty of sampling, we resort to the Constrained Realizations (CR) method (e.g., Hoffman & Ribak 1991), a fully self-consistent method which allows to simulate such rare regions at highest resolution, without loss of generality.
Current efforts in modeling galaxy evolution aim at reproducing the observed morphology at (e.g., Governato et al. 2004; Robertson et al. 2004; Tasker & Bryan 2008), but also analyze the relevant physical processes at high (e.g., Gnedin et al. 2009; Romano-Diaz et al. 2009; Gnedin & Kravtsov 2010; Greif et al. 2010; Wise et al. 2010; Pawlik et al. 2011).
To probe the dark matter (DM) backbone of galaxy formation at in highly overdense regions, Romano-Diaz et al. (2011) have performed a set of carefully designed DM simulations with CRs. Constructed halo Mass Functions have shown that on average, the QSO hosts have enhanced the halo formation in their vicinity due to pure gravitational effects, when compared with an average region in the Universe. Here we extend our study to include treatment of the baryonic component, and analyze the properties of galaxies at . In this Letter, we focus on the most general properties of galaxy population, such as morphology and baryon fraction. In the long run, our goal is to quantify the environment of high- QSOs, understanding the similarities and peculiarities of galaxy evolution in the overdensest regions at . While current simulation does not include the QSO feedback, and for neglects the UV background, it would be interesting to account for these effects in the future.
This Letter is structured as follows: section 2 summarizes the technical details of our simulation setup and its initial conditions; section 3 analyzes obtained galaxy morphology at , and the last section discusses the obtained results.
2. Numerics and Initial Conditions
We use the modified version of the tree-particle-mesh Smoothed Particle Hydrodynamics (SPH) code GADGET-3 originally described in Springel (2005), in its conservative entropy formulation (Springel & Hernquist 2002). Our conventional code includes radiative cooling by H, He, and metals (Choi & Nagamine 2009), star formation, its feedback, a phenomenological model for galactic winds, and sub-resolution model of multiphase interstellar medium, ISM (Springel & Hernquist 2003). Since we only focus on high redshift before the full reionization and do not implement on-the-fly radiative transfer of ionizing photons, the UV background is not included in our simulation. In the multiphase ISM model, star forming SPH particles contains the cold phase that forms stars and the hot phase that results from a supernova (SN) heating. The cold phase contributes to the gas mass, and the hot phase contributes to gas pressure. For the star formation, we use the “Pressure model” which reduces the high- star formation rate (Choi & Nagamine 2010) relative to the previous model by Springel & Hernquist (2003). The star formation is triggered when the gas density is above the threshold .
The initial conditions have been generated using the CR method (Hoffman & Ribak 1991; see also Romano-Diaz et al. 2007) and are similar to those used by Romano-Diaz et al. (2011, see the Appendix there). The constraints were imposed onto a grid of within cubic box of to create a DM halo seed of collapsing by , according to the top-hat model. We assume the CDM cosmology with WMAP5 parameters (Dunkley et al. 2009), , , , and , where is the Hubble constant in units of . The variance of the density field convolved with the top hat window of radius Mpc-1 was used to normalize the power spectrum.
The evolution has been followed from . The growth of structure has been substantially accelerated by resulting high overdensity, , within the central region. The simulation runs in comoving coordinates and with vacuum boundary conditions. We have applied the zoom-in technique with 3 levels of refinement to increase the numerical resolution. The inner region has a radius , having an effective resolution of in DM and SPH particles. Within this region, we obtain the particle mass of (DM), (gas) and (stars). Gravitational softening is pc (comoving).
We have used the halo finding algorithm HOP (Eisenstein & Hut 1998) to identify DM halos, and have defined halo virial masses and radii in the context of the spherical top-hat collapse model, , where is the cosmic background density and (Bryan & Norman 1998) is the critical overdensity at virialization. The halo and disk shapes have been found using the method described in Romano-Diaz et al. (2009) following Heller et al. (2007).
3. Disk Fraction
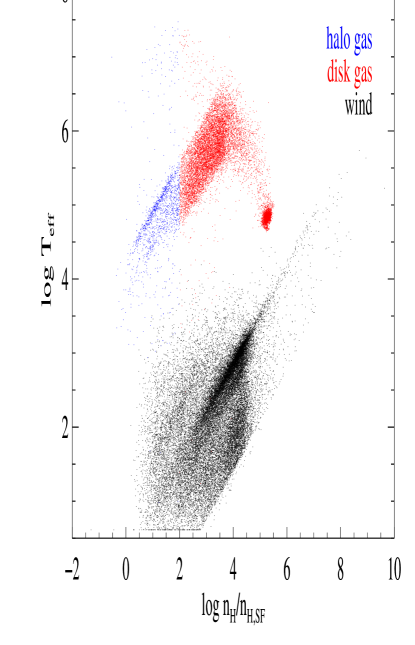
By , nearly 500 halos above have been detected and cataloged. To analyze the baryons within the DM halos, they have been divided into three groups: (1) gas; (2) stars; and (3) gas which currently experiences feedback from stellar evolution and is found on ballistic trajectories — this is the wind. To identify and quantify gas properties, we have constructed the phase diagram (e.g., Fig. 1). The gas tends to cluster in two main regions: the top ones (blue and red, see below) are the disk/halo particles which can experience the star formation and whose effective temperature, , is the result of a shock heating by the SN. The second region (black) consists of particles that comprise the wind. All gas can be cooled/heated via expansion/compression.
We do not know apriori whether a halo contains a gas disk, and, therefore, identify its presence, based on axial ratios determined from the moments of inertia (Heller et al. 2007; Romano-Diaz et al. 2009). Major and minor equatorial axes are defined as and , and (disk semi-thickness) along rotation axis of the disk. Specifically, we focus on the ratio of the minor-to-major axis, — its actual values are discussed below. If, based on the ratio, we decide that a particular halo does not contain a gas disk, we call the gaseous entity irregular. We have empirically determined that disk and halo gas can be separated by a density cut at . The red color in Fig. 1 corresponds to the disk gas and the blue color to the halo gas. We have verified this separation randomly for a large sample of DM halos. Of course, in the absence of a disk this separation is not important, but we still keep it for the sake of simplicity. The disk stars have been separated from halo stars based on the alignment of their angular momenta (e.g., Romano-Diaz et al. 2009).
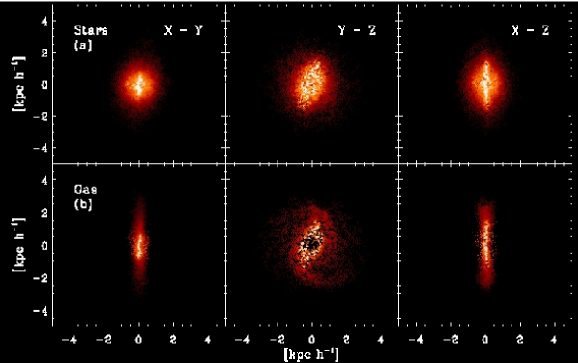
After isolating the disk gas, we have deprojected its spatial distribution in each halo onto three fundamental planes: face-on and edge-on (see an example in Fig. 2 for the most massive halo). The disks are clearly visible, have sizes kpc and are embedded in halos of kpc. The face-on disks show large-scale bars, sometimes comparable to the disk size, and their gas layer full thickness is kpc, and is pressure-supported.
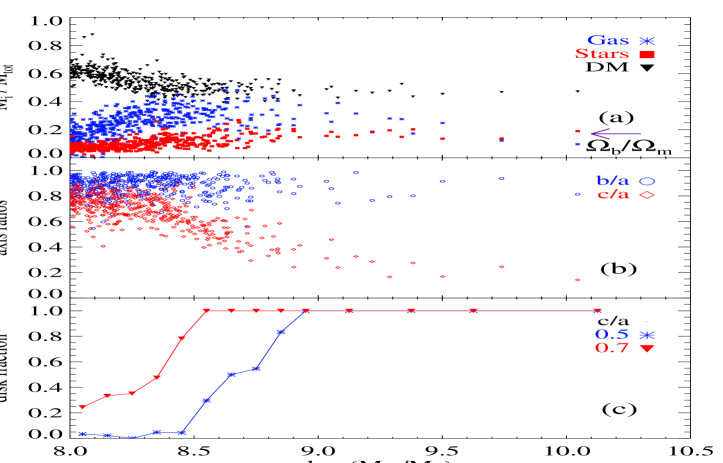
Figure 3a shows the disk gas and stars, and DM fractions as functions of the total halo masses. The cutoff at log approximately corresponds to particles within and we consider this to be reliable in determining halo (e.g., Trenti et al. 2010) and disk shapes. Two types of behavior can be observed in Fig. 3a. The DM fraction drops and gas fraction increases to , and the stellar fraction increases up to . The DM and stellar fractions flatten thereafter, while the gas fraction declines.
The stellar disks are generally less massive than the gaseous ones for most of the mass range, log (Figs. 2b, 3a). The overall trend is a strong increase in the gas fraction in disks with the total mass, up to log , to , and a decrease thereafter. The steep decline in the gas fraction below log is related to the inability of the halo to retain all of the gas because of the SN feedback and low virial temperatures. Below log (not shown here), the gas fraction in the halos is negligible because of the same effect. For the most massive halos, there appears to be roughly equal fraction of disk gas and stars, .
The shapes of the gaseous disks show interesting trends (Fig. 3b). Overall disks appear mildly non-axisymmetric, , with a slight increase in the dispersion of toward smaller . On the other hand, there appears to be a strong trend toward increased flatness, , with increasing mass, down to . Below , the gaseous disks appear prolate and their rotation axis can be distinguished only based on the angular momentum. We also note that parent halos of galaxies discussed here are quite triaxial with the range of and and therefore can influence the shape of the disk they harbor (Berentzen & Shlosman 2006).
The stellar disks (e.g., Fig. 2b) exhibit a high density midplane component of newly formed stars, with the mass of for the most massive halo at , and a lower density spheroidal stellar component, of , when integrated over the extended halo. Note that the star formation we measure is not limited to the disk regions only, but engulfs the entire halos because the gas density there appears above the threshold density . So the spheroidal component in our galaxies has its origin in the halo and was not formed as a result of the secular or dynamical thickening of the stellar disk, or from the heating by minor mergers. It is not clear what is the fate of this spheroidal stellar component. Does it represents low metallicity halo stars at low redshifts? Following the evolution of the relative masses of disk and halo stars, we only comment that the spheroids have formed early, by , and we observe a steadily increasing disk masses, compared to the halo stars, with time.
We are now in a position to estimate the disk fraction, , within the high resolution box of the simulation. To show the robustness of our result, we adopt two definitions of the gaseous disks, these of and . The first and more conservative definition exhibits a sharp decline below , while the second one shows a very similar decline below . Hence, both agree that the disk fraction is 100% for the more massive halos (Fig. 3c). There is some indication that the disk fraction levels off again for very small halos, at the level of .
We have checked the sensitivity of to our definition of the disk gas threshold (§3). Varying the threshold by does not change for , and changes it negligibly for smaller masses. Furthermore, we have tested in lower resolution simulation and find it nearly identical —a sign of numerical convergence. Finally, we note that the blue and red point scatter is uniform across the mass range in Fig. 3b — a sign that the resolution effects do not compromise the results. In summary, the disk fraction is for for massive halos in our simulation, and exhibits a sharp decline by an order of magnitude below .
The circular velocities for massive halos are contributed by baryons and DM nearly equally. Only for the most massive halo, we see maximal . For the 15 most massive halos, we have instead maximal . Overall, the total mass in a halo roughly correlates with the maximal , meaning that the halo concentration is a monotonic function of .
4. Discussion
Using a high-resolution cosmological numerical simulation, we have analyzed the evolution of galaxies at in a highly overdense region of the universe. These objects could represent high redshift galaxies recently observed by the WFC3/HST, and be possible precursors of QSOs at . For this purpose we have employed high-resolution simulations of region in radius involving a multiphase ISM and feedback from stellar evolution. Halos with are resolved with particles. We find that the fraction of disk galaxies is unity for total masses above , with a sharp decline in for less massive halos. We also find that the baryon fraction (with respect to total mass) peaks around , slowly declines towards higher masses and sharply declines toward smaller masses. So overall, above the resolved total mass of , halos are baryon-rich at these redshifts with respect to the WMAP ratio, in a broad agreement with Harford et al. (2008). More massive halos appear with about equal gas and stellar fractions, while less massive ones have higher gas fractions.
The prevalence of disk galaxies at high redshifts is not a trivial result because of ongoing merging between galaxies which contributes to strong perturbations in disk morphology, and has been tracked by us. Four objects in the process of merging have been omitted from our statistics for . All the mergers we observe are between disks. Despite this process, we find that gas-rich halos are capable of reforming the disks in a short time. This effect has been demonstrated previously by Springel & Hernquist (2005) and we confirm it here — the mergers we have observed do not destroy the disks. Taken at the face value, the dominant population of disk galaxies at overdense peaks at appears to contradict the morphology-density relation observed at low (e.g., Dressler 1980). The most straightforward explanation for this is that various processes leading to deficiency of disks in the density peaks at (e.g., dry mergers, gas ablation) have had not enough time to operate at . A number of processes at high contribute to galaxies being gas-rich, among them the ongoing gas accretion which joins the disks in their equatorial planes. In tandem with prominent (gas-rich) bars, these disks can serve as a fuel reservoir for growing supermassive black holes (SBHs) already at this epoch.
While it has been claimed that the feedback from such SBHs (neglected here) can terminate the accretion process and drive the gas out of the galaxy (e.g., Di Matteo et al. 2005), it is by no means a solved problem. It is also not clear when the morphology-density correlation observed here is reversed to its low-redshift counterpart.
Our simulation has demonstrated that well resolved galaxies hosted by mass halos possess well defined gaseous and stellar disks. Moreover, by observing the evolution of these galaxies through major mergers, we have verified that the disks are also robust morphological features and survive this process. We do agree with Greif et al. (2010) and Wise et al. (2010) simulations of smaller halos that the stellar feedback becomes increasingly dominant when smaller, halos are analyzed, and with Pawlik et al. (2011) who have obtained the disk formation in higher mass halos. We interpret the increased irregular morphology below as the effect of a stellar (SN) feedback on the disk gas. At this mass range, the morphology becomes chaotic and the gas fraction declines sharply. The observed decreasing disk fraction in low mass halos appears to be real. However, the analysis of the feedback process to quantify this phenomenon is outside the scope of this Letter.
The dominant population of the disk galaxies at in the overdense regions simulated in this work appear consistent with the presence of extended morphologies in bright galaxies observed by HST (Oesch et al. 2010). However, a direct comparison of our predictions will be possible only with next generation telescopes such as JWST or 30m-class observatories from the ground, which will have sufficient sensitivity and angular resolution to investigate the morphology of galaxies.
References
- Barkana (2002) Barkana, R. 2002, New Astronomy, 7, 85
- Barth, Martini, Nelson, & Ho (2003) Barth, A. J., Martini, P., Nelson, C. H., & Ho, L. C. 2003, ApJ, 594, L95
- Becker et al. (2001) Becker, R. H., et al. 2001, AJ, 122, 2850
- Berentzen & Shlosman (2006) Berentzen, I., & Shlosman, I. 2006, ApJ, 648, 807
- Bouwens et al. (2011) Bouwens, R. J., et al. 2011, Nature, 469, 504
- Bouwens et al. (2010) Bouwens, R. J., et al. 2010, ApJ, 709, L133
- Bouwens et al. (2007) Bouwens, R. J., et al. 2007, ApJ, 670, 928
- Bryan & Norman (1998) Bryan, G. L., & Norman, M.L. 1998, ApJ, 495, 80
- Bunker et al. (2004) Bunker, A. J., Stanway, E. R., Ellis, R. S., & McMahon, R. G. 2004, MNRAS, 355, 374
- Capak et al. (2011) Capak, P. L. et al. 2011, Nature, 470, 233
- Cen & McDonald (2002) Cen, R., & McDonald, P. 2002, ApJ, 570, 457
- Choi & Nagamine (2010) Choi, J., & Nagamine, K. 2010, MNRAS, 407, 1464
- Choi & Nagamine (2009) Choi, J., & Nagamine, K. 2009, MNRAS, 393, 1595
- Di Matteo et al. (2005) Di Matteo, T., Springel, V., & Hernquist, L. 2005, Nature, 433, 604
- Dressler (1980) Dressler, A. 1980, ApJ, 236, 351
- Dunkley et al. (2009) Dunkley, J., et al. 2009, ApJS, 180, 306
- Eisenstein & Hut (1998) Eisenstein, D. J., & Hut, P. 1998, ApJ, 498, 137
- Fan et al. (2004) Fan, X., et al. 2004, AJ, 128, 515
- Gnedin & Kravtsov (2011) Gnedin, N. Y., & Kravtsov, A. K. 2011, ApJ, 728, 88
- Gnedin et al. (2009) Gnedin, N. Y., Tassis, K., & Kravtsov, A. V. 2009, ApJ, 697, 55
- Governato et al. (2004) Governato, F., et al. ApJ, 607, 688
- Graham et al. (2001) Graham, A. W., Erwin, P., Caon, N., & Trujillo, I. 2001, ApJ, 563, L11
- Greif et al. (2010) Greif, T. H., Glover, S. C. O., Bromm, V., & Klessen, R. S. 2010, ApJ, 716, 510
- Harford et al. (2008) Harford, A. G., Hamilton, A. J. S., & Gnedin, N. Y. 2008, MNRAS, 389, 880
- Heller et al. (2007) Heller, C. H., Shlosman, I., & Athanassoula, E. 2007, ApJ, 671, 226
- Hoffman & Ribak (1991) Hoffman, Y., & Ribak, E. 1991, ApJ, 380, L5
- Li et al. (2007) Li, Y., et al. 2007, ApJ, 665, 187
- Malhotra et al. (2005) Malhotra, S., et al. 2005, ApJ, 626, 666
- McLure et al. (2010) McLure, R. J., et al. 2010, MNRAS, 403, 960
- Oesch et al. (2011) Oesch, P. A., et al. 2011, arXiv:1105.2297
- Oesch et al. (2010) Oesch, P. A., et al. 2010, ApJ, 709, L21
- Overzier et al. (2006) Overzier, R. A., Bouwens, R. J., Illingworth, G. D., & Franx, M. 2006, ApJ, 648, 5
- Pawlik et al. (2011) Pawlik, A. H., Milosavljevic, M., Bromm, V. 2011, ApJ, 731, 54
- Robertson et al. (2004) Robertson, B., Yoshida, N., Springel, V., Hernquist, L. 2004, ApJ, 606, 32
- Romano-Diaz et al. (2011) Romano-Diaz, E., Shlosman, I., Trenti, M., & Hoffman, Y. 2011, ApJ, 734, in press, arXiv:1010.3715
- Romano-Diaz et al. (2009) Romano-Diaz, E., Shlosman, I., Heller, C. H., Hoffman, Y. 2009, ApJ, 702, 1250
- Romano-Diaz et al. (2007) Romano-Diaz, E., Hoffman, Y., Heller, C. H., Faltenbacher, A., Jones, D., & Shlosman, I. 2007, ApJ, 657, 56
- Sommer-Larsen et al. (2003) Sommer-Larsen, J., Götz, M., & Portinari, L. 2003, Ap&SS, 281, 519
- Springel (2005) Springel, V. 2005, MNRAS, 364, 1101
- Springel & Hernquist (2005) Springel, V., & Hernquist, L. 2005, ApJ, 622, L9
- Springel et al. (2005) Springel, V., et al. 2005, Nature, 435, 629
- Springel & Hernquist (2003) Springel, V., & Hernquist, L. 2003, MNRAS, 339, 289
- Springel & Hernquist (2002) Springel, V., & Hernquist, L. 2002, MNRAS, 333, 649
- Stark et al. (2011) Stark, D. P., Ellis, R. S., & Ouchi, M. 2011, ApJ, 728, L2
- Tasker et al. (2008) Tasker, E. J., & Bryan, G. L. 2008, ApJ, 673, 810
- Trenti et al. (2011a) Trenti, M., et al. 2011a, ApJL, submitted
- Trenti et al. (2011b) Trenti, M., et al. 2011b, arXiv:1011.4075
- Trenti et al. (2010) Trenti, M., Smith, B. D., Hallman, E. J., Skillman, S. W., & Shull, J. M. 2010, ApJ, 711, 1198
- Trenti et al. (2008) Trenti, M., Santos, M. R., & Stiavelli, M. 2008, ApJ, 687, 1
- Wise et al. (2010) Wise, J. H., Turk, M. J., Norman, M. L., & Abel, T. 2010, arXiv:1011.2632