22institutetext: Agenzia Spaziale Italiana Science Data Center, c/o ESRIN, via Galileo Galilei, Frascati, Italy
33institutetext: Astroparticule et Cosmologie, CNRS (UMR7164), Université Denis Diderot Paris 7, Bâtiment Condorcet, 10 rue A. Domon et Léonie Duquet, Paris, France
44institutetext: Astrophysics Group, Cavendish Laboratory, University of Cambridge, J J Thomson Avenue, Cambridge CB3 0HE, U.K.
55institutetext: Atacama Large Millimeter/submillimeter Array, ALMA Santiago Central Offices, Alonso de Cordova 3107, Vitacura, Casilla 763 0355, Santiago, Chile
66institutetext: CITA, University of Toronto, 60 St. George St., Toronto, ON M5S 3H8, Canada
77institutetext: CNRS, IRAP, 9 Av. colonel Roche, BP 44346, F-31028 Toulouse cedex 4, France
88institutetext: California Institute of Technology, Pasadena, California, U.S.A.
99institutetext: Centre of Mathematics for Applications, University of Oslo, Blindern, Oslo, Norway
1010institutetext: Centro de Astrofísica, Universidade do Porto, Rua das Estrelas, 4150-762 Porto, Portugal
1111institutetext: Centro de Estudios de Física del Cosmos de Aragón (CEFCA), Plaza San Juan, 1, planta 2, E-44001, Teruel, Spain
1212institutetext: DSM/Irfu/SPP, CEA-Saclay, F-91191 Gif-sur-Yvette Cedex, France
1313institutetext: DTU Space, National Space Institute, Juliane Mariesvej 30, Copenhagen, Denmark
1414institutetext: Departamento de Física Fundamental, Facultad de Ciencias, Universidad de Salamanca, 37008 Salamanca, Spain
1515institutetext: Departamento de Física, Universidad de Oviedo, Avda. Calvo Sotelo s/n, Oviedo, Spain
1616institutetext: Department of Astronomy and Astrophysics, University of Toronto, 50 Saint George Street, Toronto, Ontario, Canada
1717institutetext: Department of Physics & Astronomy, University of British Columbia, 6224 Agricultural Road, Vancouver, British Columbia, Canada
1818institutetext: Department of Physics and Astronomy, University of Southern California, Los Angeles, California, U.S.A.
1919institutetext: Department of Physics and Astronomy, University of Sussex, Brighton BN1 9QH, U.K.
2020institutetext: Department of Physics, Gustaf Hällströmin katu 2a, University of Helsinki, Helsinki, Finland
2121institutetext: Department of Physics, Princeton University, Princeton, New Jersey, U.S.A.
2222institutetext: Department of Physics, Purdue University, 525 Northwestern Avenue, West Lafayette, Indiana, U.S.A.
2323institutetext: Department of Physics, University of California, Berkeley, California, U.S.A.
2424institutetext: Department of Physics, University of California, Santa Barbara, California, U.S.A.
2525institutetext: Department of Physics, University of Illinois at Urbana-Champaign, 1110 West Green Street, Urbana, Illinois, U.S.A.
2626institutetext: Dipartimento di Fisica G. Galilei, Università degli Studi di Padova, via Marzolo 8, 35131 Padova, Italy
2727institutetext: Dipartimento di Fisica, Università La Sapienza, P. le A. Moro 2, Roma, Italy
2828institutetext: Dipartimento di Fisica, Università degli Studi di Milano, Via Celoria, 16, Milano, Italy
2929institutetext: Dipartimento di Fisica, Università degli Studi di Trieste, via A. Valerio 2, Trieste, Italy
3030institutetext: Dipartimento di Fisica, Università di Ferrara, Via Saragat 1, 44122 Ferrara, Italy
3131institutetext: Dipartimento di Fisica, Università di Roma Tor Vergata, Via della Ricerca Scientifica, 1, Roma, Italy
3232institutetext: Discovery Center, Niels Bohr Institute, Blegdamsvej 17, Copenhagen, Denmark
3333institutetext: Dpto. Astrofísica, Universidad de La Laguna (ULL), E-38206 La Laguna, Tenerife, Spain
3434institutetext: European Southern Observatory, ESO Vitacura, Alonso de Cordova 3107, Vitacura, Casilla 19001, Santiago, Chile
3535institutetext: European Space Agency, ESAC, Camino bajo del Castillo, s/n, Urbanización Villafranca del Castillo, Villanueva de la Cañada, Madrid, Spain
3636institutetext: European Space Agency, ESAC, Planck Science Office, Camino bajo del Castillo, s/n, Urbanización Villafranca del Castillo, Villanueva de la Cañada, Madrid, Spain
3737institutetext: European Space Agency, ESTEC, Keplerlaan 1, 2201 AZ Noordwijk, The Netherlands
3838institutetext: Finnish Centre for Astronomy with ESO (FINCA), University of Turku, Väisäläntie 20, FIN-21500, Piikkiö, Finland
3939institutetext: Helsinki Institute of Physics, Gustaf Hällströmin katu 2, University of Helsinki, Helsinki, Finland
4040institutetext: INAF - Osservatorio Astronomico di Padova, Vicolo dell’Osservatorio 5, Padova, Italy
4141institutetext: INAF - Osservatorio Astronomico di Roma, via di Frascati 33, Monte Porzio Catone, Italy
4242institutetext: INAF - Osservatorio Astronomico di Trieste, Via G.B. Tiepolo 11, Trieste, Italy
4343institutetext: INAF/IASF Bologna, Via Gobetti 101, Bologna, Italy
4444institutetext: INAF/IASF Milano, Via E. Bassini 15, Milano, Italy
4545institutetext: IPAG: Institut de Planétologie et d’Astrophysique de Grenoble, Université Joseph Fourier, Grenoble 1 / CNRS-INSU, UMR 5274, Grenoble, F-38041, France
4646institutetext: ISDC Data Centre for Astrophysics, University of Geneva, ch. d’Ecogia 16, Versoix, Switzerland
4747institutetext: Imperial College London, Astrophysics group, Blackett Laboratory, Prince Consort Road, London, SW7 2AZ, U.K.
4848institutetext: Infrared Processing and Analysis Center, California Institute of Technology, Pasadena, CA 91125, U.S.A.
4949institutetext: Institut Néel, CNRS, Université Joseph Fourier Grenoble I, 25 rue des Martyrs, Grenoble, France
5050institutetext: Institut d’Astrophysique Spatiale, CNRS (UMR8617) Université Paris-Sud 11, Bâtiment 121, Orsay, France
5151institutetext: Institut d’Astrophysique de Paris, CNRS (UMR7095), 98 bis Boulevard Arago, F-75014, Paris, France
5252institutetext: Institut de Ciències de l’Espai, CSIC/IEEC, Facultat de Ciències, Campus UAB, Torre C5 par-2, Bellaterra 08193, Spain
5353institutetext: Institute for Space Sciences, Bucharest-Magurale, Romania
5454institutetext: Institute of Astronomy and Astrophysics, Academia Sinica, Taipei, Taiwan
5555institutetext: Institute of Astronomy, University of Cambridge, Madingley Road, Cambridge CB3 0HA, U.K.
5656institutetext: Institute of Theoretical Astrophysics, University of Oslo, Blindern, Oslo, Norway
5757institutetext: Instituto de Astrofísica de Canarias, C/Vía Láctea s/n, La Laguna, Tenerife, Spain
5858institutetext: Instituto de Física de Cantabria (CSIC-Universidad de Cantabria), Avda. de los Castros s/n, Santander, Spain
5959institutetext: Istituto di Fisica del Plasma, CNR-ENEA-EURATOM Association, Via R. Cozzi 53, Milano, Italy
6060institutetext: Jet Propulsion Laboratory, California Institute of Technology, 4800 Oak Grove Drive, Pasadena, California, U.S.A.
6161institutetext: Jodrell Bank Centre for Astrophysics, Alan Turing Building, School of Physics and Astronomy, The University of Manchester, Oxford Road, Manchester, M13 9PL, U.K.
6262institutetext: Kavli Institute for Cosmology Cambridge, Madingley Road, Cambridge, CB3 0HA, U.K.
6363institutetext: LERMA, CNRS, Observatoire de Paris, 61 Avenue de l’Observatoire, Paris, France
6464institutetext: Laboratoire AIM, IRFU/Service d’Astrophysique - CEA/DSM - CNRS - Université Paris Diderot, Bât. 709, CEA-Saclay, F-91191 Gif-sur-Yvette Cedex, France
6565institutetext: Laboratoire de Physique Subatomique et de Cosmologie, CNRS/IN2P3, Université Joseph Fourier Grenoble I, Institut National Polytechnique de Grenoble, 53 rue des Martyrs, 38026 Grenoble cedex, France
6666institutetext: Laboratoire de l’Accélérateur Linéaire, Université Paris-Sud 11, CNRS/IN2P3, Orsay, France
6767institutetext: Lawrence Berkeley National Laboratory, Berkeley, California, U.S.A.
6868institutetext: Max-Planck-Institut für Astrophysik, Karl-Schwarzschild-Str. 1, 85741 Garching, Germany
6969institutetext: Max-Planck-Institut für Extraterrestrische Physik, Giessenbachstraße, 85748 Garching, Germany
7070institutetext: Niels Bohr Institute, Blegdamsvej 17, Copenhagen, Denmark
7171institutetext: Observational Cosmology, Mail Stop 367-17, California Institute of Technology, Pasadena, CA, 91125, U.S.A.
7272institutetext: Optical Science Laboratory, University College London, Gower Street, London, U.K.
7373institutetext: SISSA, Astrophysics Sector, via Bonomea 265, 34136, Trieste, Italy
7474institutetext: School of Physics and Astronomy, Cardiff University, Queens Buildings, The Parade, Cardiff, CF24 3AA, U.K.
7575institutetext: Space Research Institute (IKI), Russian Academy of Sciences, Profsoyuznaya Str, 84/32, Moscow, 117997, Russia
7676institutetext: Space Sciences Laboratory, University of California, Berkeley, California, U.S.A.
7777institutetext: Stanford University, Dept of Physics, Varian Physics Bldg, 382 Via Pueblo Mall, Stanford, California, U.S.A.
7878institutetext: Tartu Observatory, Toravere, Tartumaa, 61602, Estonia
7979institutetext: Tuorla Observatory, Department of Physics and Astronomy, University of Turku, Väisäläntie 20, FIN-21500, Piikkiö, Finland
8080institutetext: UPMC Univ Paris 06, UMR7095, 98 bis Boulevard Arago, F-75014, Paris, France
8181institutetext: Universität Heidelberg, Institut für Theoretische Astrophysik, Albert-Überle-Str. 2, 69120, Heidelberg, Germany
8282institutetext: Université de Toulouse, UPS-OMP, IRAP, F-31028 Toulouse cedex 4, France
8383institutetext: University Observatory, Ludwig Maximilian University of Munich, Scheinerstrasse 1, 81679 Munich, Germany
8484institutetext: University of Granada, Departamento de Física Teórica y del Cosmos, Facultad de Ciencias, Granada, Spain
8585institutetext: Warsaw University Observatory, Aleje Ujazdowskie 4, 00-478 Warszawa, Poland
Planck Early Results XXVI: Detection with Planck and confirmation by XMM-Newton of PLCK G266.627.3, an exceptionally X-ray luminous and massive galaxy cluster at
We present first results on PLCK G266.627.3, a galaxy cluster candidate detected at a signal-to-noise ratio of in the Planck All Sky survey. An XMM-Newton validation observation has allowed us to confirm that the candidate is a bona fide galaxy cluster. With these X-ray data we measure an accurate redshift, , and estimate the cluster mass to be . PLCK G266.627.3 is an exceptional system: its luminosity of – equals that of the two most luminous known clusters in the universe, and it is one of the most massive clusters at . Moreover, unlike the majority of high-redshift clusters, PLCK G266.627.3 appears to be highly relaxed. This observation confirms Planck’s capability of detecting high-redshift, high-mass clusters, and opens the way to the systematic study of population evolution in the exponential tail of the mass function.
Key Words.:
Cosmology: observations Galaxies: cluster: general Galaxies: clusters: intracluster medium Cosmic background radiation, X-rays: galaxies: clusters1 Introduction
Very massive clusters above redshift , when the Universe was at half the present age, are predicted to be very rare. They potentially provide a sensitive probe to constrain deviations from the standard CDM paradigm (e.g. Mortonson et al., 2011); e.g., owing to non-Gaussian perturbations, non-standard quintessence models or modified gravity models (see Allen et al., 2011, for a review). They are also ideal targets for studying key aspects of the gravitational physics that drives cluster formation, including measurement of the evolution of the mass concentration. For these reasons, the scientific community has, over the past two decades, put strong effort into the discovery and characterisation of these objects.

Until recently it was possible to identify clusters of galaxies only via optical/infrared or X-ray surveys. Indeed, the most distant clusters presently known have all been detected with these techniques, e.g., the IR-selected cluster CL J1449+0856 at (Gobat et al., 2011) and the X-ray selected system XMMU J105324.7+572348 at (Henry et al., 2010). For both of these objects, extended X-ray emission has been detected with XMM-Newton, confirming their status as fully established galaxy clusters; however, their total masses are more typical of systems in the poor cluster or group regime (). Until recently, the most massive cluster known in the universe was XMMU J2235.32557 at , discovered in the XMM-Newton Distant Cluster Project (XDCP) based on serendipitous cluster searches in XMM-Newton observations (Mullis et al., 2005). For this system, Jee et al. (2009) estimate a mass of from a weak lensing analysis.
However, clusters are also detectable through the Sunyaev-Zeldovich (SZ) effect (Sunyaev & Zeldovich, 1972), the spectral distortion of the cosmic microwave background (CMB) generated via inverse Compton scattering of CMB photons by the hot electrons in the intra-cluster medium. Crucially, the total SZ signal is expected to be closely related to the cluster mass (e.g. da Silva et al., 2004), and its brightness insensitive to redshift dimming. As a result, SZ surveys can potentially provide unbiased cluster samples that are as close as possible to being mass-selected111In practice, the mass threshold detectable by Planck increases with redshift. The total SZ signal is not resolved by Planck at high and it decreases with due to the decreasing angular size of the object.. They offer an ideal way to identify massive, high-redshift clusters. One recent illustration is the detection of SPT-CL J21065844 at by the South Pole Telescope (SPT) survey (Foley et al., 2011). With an estimated mass of , SPT-CL J21065844 is nearly twice as massive as XMMU J2235.32557.
The Planck222Planck (http://www.esa.int/Planck) is a project of the European Space Agency (ESA) with instruments provided by two scientific consortia funded by ESA member states (in particular the lead countries: France and Italy) with contributions from NASA (USA), and telescope reflectors provided in a collaboration between ESA and a scientific consortium led and funded by Denmark. satellite has been surveying the sky in the microwave band since August 2009 (Planck Collaboration, 2011a) with a good (band-dependent) spatial resolution of 5 arcmin (Mennella et al., 2011; Planck HFI Core Team, 2011). Compared to other SZ experiments such as ACT (Marriage et al., 2011) or SPT (Carlstrom et al., 2009), Planck brings unique nine-band coverage from 30 to 857 GHz and, most crucially, an exceptionally large survey volume. Planck is the first all-sky survey capable of blindly detecting clusters (i.e., not guided in the search by prior observations), since the ROSAT All-Sky Survey (RASS) in the X-ray domain. This coverage allows detection of the rarest clusters, the most massive objects lying in the exponential tail of the mass functitheron.
Planck Collaboration (2011b) recently published the Early SZ (ESZ) sample, the first sample of galaxy clusters detected blindly in the all-sky maps from the first ten months of the Planck survey. The properties of this first sample already show that Planck is detecting previously unknown, massive clusters that do not appear in RASS or in other smaller area SZ surveys (Planck Collaboration, 2011c). The ESZ comprises high signal-to-noise ratio () Planck SZ sources up to . We report here on an SZ source that was blindly identified at in the Planck all-sky survey, and recent XMM-Newton validation observations confirm it is a massive cluster at .
In this paper, we adopt a CDM cosmology with km s-1 Mpc-1, , and . The factor is the ratio of the Hubble constant at redshift to its present-day value. The quantities and are the total mass and radius corresponding to a total density contrast , as compared to , the critical density of the Universe at the cluster redshift; . The SZ flux is characterised by , where is the spherically integrated Compton parameter within (corresponding to ), and is the angular-diameter distance to the cluster.
2 Planck detection
The blind search for clusters in Planck data relies on a multi-matched filter (MMF) approach (Melin et al., 2006). Candidates then undergo a validation process, including internal quality checks and cross-correlation with ancillary data and catalogues, as described in Planck Collaboration (2011b). This process produces a list of new Planck SZ cluster candidates above a given S/N threshold that require follow-up for confirmation. The XMM-Newton follow-up for validation, undertaken in Director’s Discretionary Time via an agreement between the XMM-Newton and Planck Project Scientists, plays a central role in this confirmation procedure. It consists of snapshot exposures (), sufficient for unambiguous discrimination between clusters and false candidates (Planck Collaboration, 2011c). The results of the first two runs (completed in September 2010) are reported by Planck Collaboration (2011b, c).
The XMM-Newton validation programme is continuing to explore lower S/N and detection quality criteria. PLCK G266.627.3, detected at , was observed in the framework of the third run of the XMM-Newton validation programme, for which the analysis is on-going. This run comprises a total of 11 candidates detected at from the same Planck HFI maps used for the construction the ESZ sample. The 11 candidates were sent for scheduling in November 2010 and the observations were performed between 22 December 2010 and 16 May 2011. Interestingly, PLCK G266.627.3 has been independently detected in the SPT survey. Its Planck position (, ) is consistent with that of SPT-CL J0615-5746 (Williamson et al., 2011, published on arXiv.org in January 2011, with a photometric redshift of ).
3 XMM-Newton validation
3.1 Observation and data reduction
PLCK G266.627.3 was observed with the XMM-Newton EPIC instrument (Turner et al., 2001; Strüder et al., 2001), using the thin filters and the extended full frame mode for the ‘pn-CCD’ camera. The data analysis and validation procedure is described in Planck Collaboration (2011c). Calibrated event lists were produced with v11.0 of the XMM-Newton Science Analysis System. Data that are affected by periods of high background due to soft proton flares were omitted from the analysis, and the remaining data were pattern-selected and corrected for vignetting, as described in Pratt et al. (2007). Bright point sources were excised from the data. Background treatment is described in Pratt et al. (2010). In the spectroscopic analysis, the cluster component was modelled with an absorbed thermal emission model (mekal) with a hydrogen column density fixed at the 21-cm value of Dickey & Lockman (1990).
The observation, , was affected by soft proton flares. The net exposure time after flare cleaning is only for the pn-CCD camera, with a particle background higher than nominal. The MOS camera data are less affected with a clean time of and a background excess about two times lower. We undertook a conservative approach to analysing spectroscopic data, since they are the most sensitive to the background estimate. We first fitted the data from the three cameras simultaneously, then fitted only the MOS cameras. The uncertainties in the physical quantities below reflect the difference in best-fitting values between the two analyses and their errors.
3.2 Confirmation and estimate
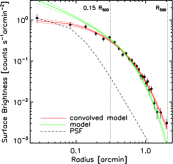
In Fig. 1 we show the vignetting-corrected count rate image of the cluster in the – band. An extended X-ray source is clearly coincident with PLCK G266.627.3. Its total EPIC count rate in the – band is within , the maximum radius of detection. The offset between the X-ray cluster centre, defined as the emission peak at , , and the Planck blind position is , consistent with the position reconstruction uncertainty, driven by the Planck spatial resolution and the source (Planck Collaboration, 2011b). The extended nature of the source is confirmed by comparing the surface brightness profile with the XMM-Newton point spread function (PSF) (Fig. 1, right panel). A typical (PSF-convolved) cluster surface brightness model consisting of a -model with a central cusp (Eq. 2 in Pratt & Arnaud, 2002) provides a good fit to the data and further supports the extended nature of the source (Fig. 1).
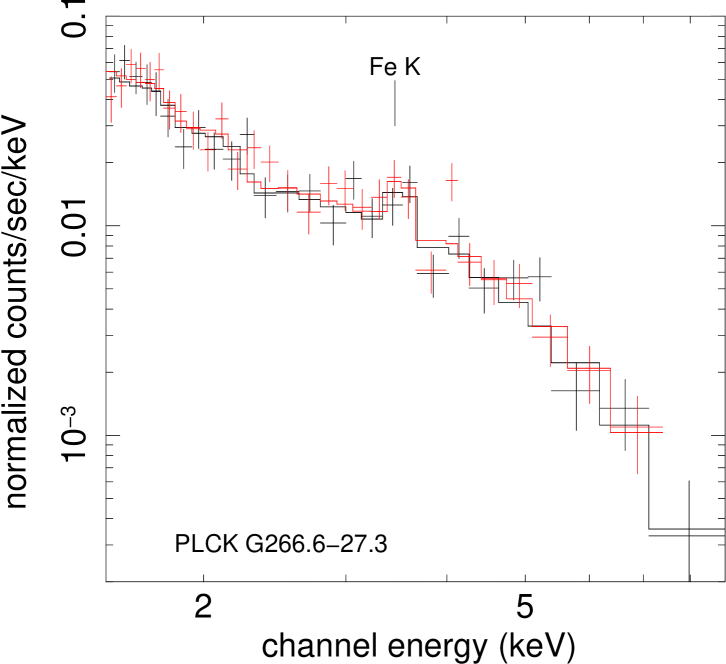
We extracted a spectrum within a circular region corresponding to the maximum significance of the X–ray detection (). The iron K line complex is clearly detected (Fig. 2). Its significance is , estimated from a fit of the spectrum in the – band with a continuum plus a Gaussian line model. Since the centroid of the line complex depends on the temperature, the redshift is determined from a thermal model fit to the full spectrum, as described in detail in Planck Collaboration (2011c). This yields a precise redshift estimate of .
4 Physical cluster properties
4.1 An exceptionally luminous and massive cluster
We derived the deprojected, PSF-corrected gas density profile from the surface brightness profile, using the non-parametric method described in Croston et al. (2006). Global cluster parameters were then estimated self-consistently within via iteration about the – relation of Arnaud et al. (2010), assuming standard evolution, . The quantity , introduced by Kravtsov et al. (2006), is defined as the product of , the gas mass within , and . is the spectroscopic temperature measured in the – aperture. In addition, , the X-ray luminosity inside , was calculated as described in Pratt et al. (2009). All resulting X-ray properties, including iron abundance, are summarised in Table 1.
PLCK G266.627.3 is an exceptionally luminous system. Its – band luminosity of is equal to that of the fifth most luminous object in the MCXC compilation of Piffaretti et al. (2010), MACS J0717.5+3745 at , discovered in the RASS by Edge et al. (2003). Moreover, its – band luminosity is consistent with that of SPT-CL J21065844, the most luminous cluster known beyond (Foley et al., 2011). Collectively, these three clusters are the most luminous systems at . They are only fainter than RXJ 1347.5-1145, the most X-ray luminous cluster known in the Universe (Piffaretti et al., 2010).
|
Consistent with expectations for high-redshift Planck-detected clusters, we find that this cluster is extremely hot, , and massive, with a mass of . Our mass estimate is consistent with the less precise value, , which is derived by Williamson et al. (2011) using the relation between SPT S/N and mass. Comparison of the masses of high-redshift systems is not trivial, because the estimation strongly depends on method, e.g which mass proxy is used and at what reference radius the mass is measured. On the basis of the published mass estimates, PLCK G266.627.3 would appear to be the most massive cluster at . Using the same factor to convert to as Foley et al. (2011), we obtain , to be compared to 444The error includes an extra error accounting for uncertainties in the scaling relations. for SPT-CL J2106-5844. However, the last value was derived by combining X-ray and SZ data. A more direct comparison of values estimated from the – relation indicates that they are identical within their uncertainties: for PLCK G266.627.3 and for SPT-CL J21065844.
4.2 Compton parameter versus
The MMF blind detection was performed using the universal pressure profile of Arnaud et al. (2010) as a spatial template, leaving the position, characteristic size, , and SZ flux, , as free parameters. The resulting flux, , is consistent with the value, , expected from the measured value of using the scaling relation derived from the universal pressure profile (Arnaud et al., 2010, Eq. 19). The cluster size, comparable to Planck’s spatial resolution, is poorly constrained, . As discussed in Planck Collaboration (2011b), the uncertainty on the blind value is then large because of the flux-size degeneracy, where an overestimate of the cluster size induces an overestimate of the SZ signal. The SZ photometry can be improved by using the more precise XMM-Newton position and size in the flux extraction. The value obtained using these X-ray priors, , is lower than the value expected from the X-ray data at the significance level.
| Method | Definition | Value | |
|---|---|---|---|
| () | (arcmin) | ||
| MMF blind | |||
| PWS blind | |||
| MMF X-ray prior | fixed | ||
| PWS X-ray prior | fixed | ||
| MILCA |
To check the robustness of the estimate, we compared the MMF value with the one derived from the PowellSnakes (PWS; Carvalho et al., 2009, 2011) algorithm and the modified internal linear combination algorithm (MILCA; Hurier et al., 2010). The values are given in Table 2. PWS is a blind detection algorithm that assumes the same profile shape as MMF, but is based on a Bayesian statistical approach, as fully described in Carvalho et al. (2009). MMF and PWS give consistent results, the difference between MMF and PWS values being about 1.3 times the respective uncertainties. MILCA is a component separation method that allows reconstruction of the SZ map around the cluster from an optimised linear combination of Planck HFI maps. In contrast to the MMF and PWS methods, the SZ flux derived from MILCA is obtained from aperture photometry, i.e., with no assumptions on SZ profile shape or size. Assuming a typical conversion factor of based on the universal profile to convert the total MILCA measurement to , the MMF and MILCA estimates are in excellent agreement.
Several factors may affect the X-ray and SZ flux measurements and bring them out of accord. We have checked for possible AGN contamination that could lower the value using the NVSS (at 1.4 GHz, Condon et al. 1998) and SUMSS (at 0.84 GHz, Bock et al. 1999) catalogues, but no bright radio sources are found in the cluster vicinity. The closest radio source with significant flux density is at away. The source has a 1 GHz flux density of 0.46 Jy. We also find no evidence of radio contamination in the low-frequency Planck bands. On the other hand, the measurement may also be increased by AGN contamination, from cluster members or foreground/background galaxies. Point source contamination is difficult to estimate owing to the XMM-Newton PSF. So, we estimate a maximum contribution to the X-ray luminosity from a central active galaxy of , assuming a point source model normalised to the central value of the X-ray surface brightness. The contribution to the gas mass, hence to , would be less, provided that the source is not hard enough to significantly affect . Nevertheless, only high-resolution X-ray imaging (e.g., from Chandra) can definitively establish whether X-ray AGNs at the cluster location affect our luminosity or mass measurement. A departure from the universal pressure profile would change the ratio. The density profile shown below does not show any indication of this effect; however, deep spatially resolved XMM-Newton and Chandra spectroscopic observations are needed to derive the radial pressure gradient from the core to . A final interesting possibility is that gas clumping could affect the measurements. A combination of X-ray and higher resolution SZ observations is required to assess this point.
4.3 Dynamical state and self-similarity of shape up to high z
The available information indicates that PLCK G266.627.3 may be particularly dynamically relaxed. The cluster image (Fig. 1, middle panel) does not show any sign of disturbance: the surface brightness is quite regular and quasi-azimuthally symmetric within . The offset between the X-ray surface brightness peak and the cluster brightest galaxy (Williamson et al., 2011, Fig.19) is less than .
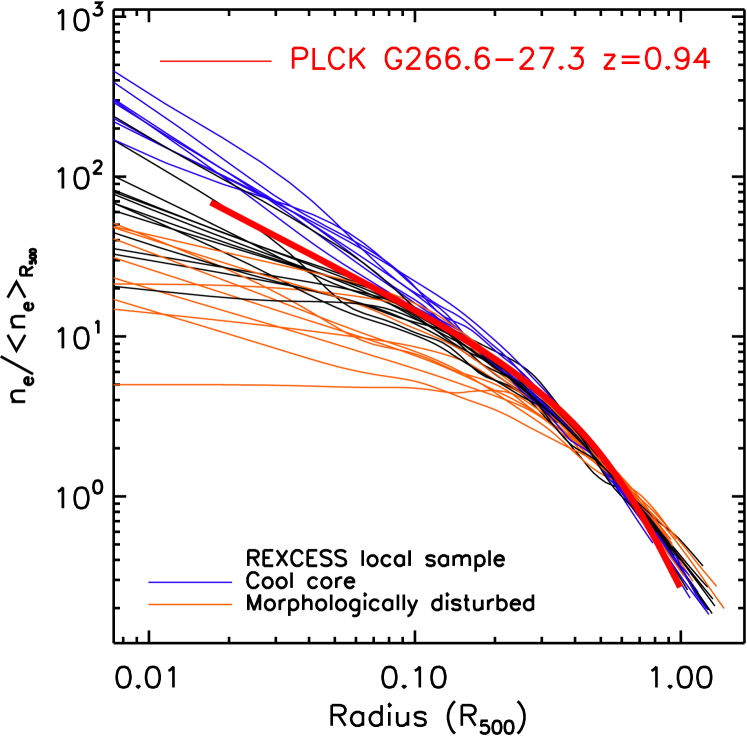
To further examine the dynamical state of the cluster, in Fig. 3 we compare its scaled density profile to those of clusters in the local representative X-ray-selected sample REXCESS (Böhringer et al., 2007; Croston et al., 2008). The radii are scaled by and the density by the mean within . As extensively discussed by Pratt et al. (2009) and Arnaud et al. (2010), morphologically disturbed (i.e., merging) systems have systematically shallower density profiles than more relaxed cool core objects. This is illustrated in Fig. 3, where we indicate the scaled density profiles of the more relaxed cool core and the dynamically active merging clusters. The scaled density profile of PLCK G266.627.3 lies between the two classes, but with an indication of being closer to the relaxed rather than the merging systems. It is thus possible that PLCK G266.627.3 is a cool core object at . Such objects are expected to be rare (e.g., Vikhlinin et al., 2007; Santos et al., 2010), and no cluster at this redshift has yet been found to contain a resolved central temperature drop that would confirm the presence of a cool core. A deep exposure at Chandra spatial resolution is needed to check this hypothesis.
It is worth emphasising the similarity beyond the core of the density profile of this cluster with respect to REXCESS systems. This is the first piece of evidence for a similarity of shape up to redshifts as high as .
5 Conclusion
PLCK G266.627.3 is the first blindly discovered Planck cluster of galaxies at . It has been confirmed by XMM-Newton in the framework of the on-going validation DDT observations. XMM-Newton data allowed us to measure the redshift with high accuracy () and estimate the cluster mass to be . This XMM-Newton confirmation and redshift estimate is a clear demonstration of the capability of Planck for detecting high-, high-mass clusters.
PLCK G266.627.3 is an exceptional system, both in terms of its luminosity and its estimated mass. Furthermore, unlike other high-redshift clusters, it is likely to be a relaxed system, potentially allowing accurate hydrostatic mass measurements. It is thus a perfect target for deep multi-wavelength follow-up to address such important cosmological issues as the evolution of dark matter profiles, the evolution of the mass- relation, gas clumping, and the bias between X-ray and lensing mass estimates at such high redshift.
Acknowledgements.
The Planck Collaboration thanks Norbert Schartel for his support of the validation process and for granting discretionary time for the observation of Planck cluster candidates. The present work is based on observations obtained with XMM-Newton, an ESA science mission with instruments and contributions directly funded by ESA Member States and the USA (NASA). This research has made use of the following databases: SIMBAD, operated at the CDS, Strasbourg, France; the NED database, which is operated by the Jet Propulsion Laboratory, California Institute of Technology, under contract with the National Aeronautics and Space Administration; BAX, which is operated by the Laboratoire d Astrophysique de Tarbes-Toulouse (LATT), under contract with the Centre National d Etudes Spatiales (CNES); and the SZ repository operated by IAS Data and Operation Center (IDOC) under contract with CNES. A description of the Planck Collaboration and a list of its members, indicating which technical or scientific activities they have been involved in, can be found at http://www.rssd.esa.int/Planck_Collaboration. The Planck Collaboration acknowledges the support of: ESA; CNES and CNRS/INSU-IN2P3-INP (France); ASI, CNR, and INAF (Italy); NASA and DoE (USA); STFC and UKSA (UK); CSIC, MICINN and JA (Spain); Tekes, AoF and CSC (Finland); DLR and MPG (Germany); CSA (Canada); DTU Space (Denmark); SER/SSO (Switzerland); RCN (Norway); SFI (Ireland); FCT/MCTES (Portugal); and DEISA (EU)References
- Allen et al. (2011) Allen, S. W., Evrard, A. E., & Mantz, A. B. 2011, ARA&A in press, arXiv:astro-ph/1103.4829
- Arnaud et al. (2010) Arnaud, M., Pratt, G. W., Piffaretti, R., et al. 2010, A&A, 517, A92
- Bock et al. (1999) Bock, D., Large, M. I., & Sadler, E. M. 1999, AJ, 117, 1578
- Böhringer et al. (2007) Böhringer, H., Schuecker, P., Pratt, G. W., et al. 2007, A&A, 469, 363
- Carlstrom et al. (2009) Carlstrom, J. E., Ade, P. A. R., Aird, K. A., et al. 2009, arXiv:0907.4445
- Carvalho et al. (2009) Carvalho, P., Rocha, G., & Hobson, M. P. 2009, MNRAS, 393, 681
- Carvalho et al. (2011) Carvalho, P., Rocha, G., Hobson, M. P., & Lasenby, A. 2011, to be submitted to MNRAS
- Condon et al. (1998) Condon, J. J., Cotton, W. D., Greisen, E. W., et al. 1998, AJ, 115, 1693
- Croston et al. (2006) Croston, J. H., Arnaud, M., Pointecouteau, E., & Pratt, G. W. 2006, A&A, 459, 1007
- Croston et al. (2008) Croston, J. H., Pratt, G. W., Böhringer, H., et al. 2008, A&A, 487, 431
- da Silva et al. (2004) da Silva, A. C., Kay, S. T., Liddle, A. R., & Thomas, P. A. 2004, MNRAS, 348, 1401
- Dickey & Lockman (1990) Dickey, J. M. & Lockman, F. J. 1990, ARA&A, 28, 215
- Edge et al. (2003) Edge, A. C., Ebeling, H., Bremer, M., et al. 2003, MNRAS, 339, 913
- Foley et al. (2011) Foley, R. J., Andersson, K., Bazin, G., et al. 2011, ApJ, 731, 86
- Gobat et al. (2011) Gobat, R., Daddi, E., Onodera, M., et al. 2011, A&A, 526, A133
- Henry et al. (2010) Henry, J. P., Salvato, M., Finoguenov, A., et al. 2010, ApJ, 725, 615
- Hurier et al. (2010) Hurier, G., Hildebrandt, S. R., & Macias-Perez, J. F. 2010, A&A submitted, arXiv:1007.1149
- Jee et al. (2009) Jee, M. J., Rosati, P., Ford, H. C., et al. 2009, ApJ, 704, 672
- Kravtsov et al. (2006) Kravtsov, A. V., Vikhlinin, A., & Nagai, D. 2006, ApJ, 650, 128
- Marriage et al. (2011) Marriage, T. A., Baptiste Juin, J., Lin, Y., et al. 2011, ApJ, 731, 100
- Melin et al. (2006) Melin, J., Bartlett, J. G., & Delabrouille, J. 2006, A&A, 459, 341
- Mennella et al. (2011) Mennella et al. 2011, Planck early results 03: First assessment of the Low Frequency Instrument in-flight performance (Submitted to A&A, [arXiv:astro-ph/1101.2038])
- Mortonson et al. (2011) Mortonson, M. J., Hu, W., & Huterer, D. 2011, Phys. Rev. D, 83, 023015
- Mullis et al. (2005) Mullis, C. R., Rosati, P., Lamer, G., et al. 2005, ApJ, 623, L85
- Piffaretti et al. (2010) Piffaretti, R., Arnaud, M., Pratt, G. W., Pointecouteau, E., & Melin, J. 2010, A&A submitted, arXiv:1007.1916
- Planck Collaboration (2011a) Planck Collaboration. 2011a, Planck early results 01: The Planck mission (Submitted to A&A, [arXiv:astro-ph/1101.2022])
- Planck Collaboration (2011b) Planck Collaboration. 2011b, Planck early results 08: The all-sky early Sunyaev-Zeldovich cluster sample (Submitted to A&A, [arXiv:astro-ph/1101.2024])
- Planck Collaboration (2011c) Planck Collaboration. 2011c, Planck early results 09: XMM-Newton follow-up for validation of Planck cluster candidates (Submitted to A&A, [arXiv:astro-ph/1101.2025])
- Planck HFI Core Team (2011) Planck HFI Core Team. 2011, Planck early results 04: First assessment of the High Frequency Instrument in-flight performance (Submitted to A&A, [arXiv:astro-ph/1101.2039])
- Pratt & Arnaud (2002) Pratt, G. W. & Arnaud, M. 2002, A&A, 394, 375
- Pratt et al. (2010) Pratt, G. W., Arnaud, M., Piffaretti, R., et al. 2010, A&A, 511, A85
- Pratt et al. (2007) Pratt, G. W., Böhringer, H., Croston, J. H., et al. 2007, A&A, 461, 71
- Pratt et al. (2009) Pratt, G. W., Croston, J. H., Arnaud, M., & Böhringer, H. 2009, A&A, 498, 361
- Santos et al. (2010) Santos, J. S., Tozzi, P., Rosati, P., & Böhringer, H. 2010, A&A, 521, A64
- Strüder et al. (2001) Strüder, L., Briel, U., Dennerl, K., et al. 2001, A&A, 365, L18
- Sunyaev & Zeldovich (1972) Sunyaev, R. A. & Zeldovich, Y. B. 1972, Comments on Astrophysics and Space Physics, 4, 173
- Turner et al. (2001) Turner, M. J. L., Abbey, A., Arnaud, M., et al. 2001, A&A, 365, L27
- Vikhlinin et al. (2007) Vikhlinin, A., Burenin, R., Forman, W. R., et al. 2007, in Heating versus Cooling in Galaxies and Clusters of Galaxies, ed. H. Böhringer, G. W. Pratt, A. Finoguenov, & P. Schuecker (Springer-Verlag Berlin Heidelberg), 48
- Williamson et al. (2011) Williamson, R., Benson, B. A., High, F. W., et al. 2011, ApJ submitted, ArXiv:1101.1290