V1898 Cygni††thanks: Based on observations collected at Catania Astrophysical Observatory (Italy) and TÜBİTAK National Observatory (Antalya, Turkey).: An interacting eclipsing binary in the vicinity of North America nebula.
Abstract
We present spectroscopic observations of the double-lined Algol type eclipsing binary V1898 Cyg. Analyses of the BV light curves and RVs led to determination of the fundamental stellar parameters of the V1898 Cyg’s components. The absolute parameters for the stars are derived as: M1=6.0540.037 M⊙, M2=1.1620.011 M⊙, R1=3.5260.009 R⊙, R2=2.6400.010 R⊙, T=18 000600 K, and T=6 200200 K. The residuals between the observed and computed times of mid-eclipses were analysed and a rate of the period change was obtained and a mass transfer rate of in a year is estimated.We have calculated the distance to the system of V1898 Cyg as 5015 pc using the infrared JHK magnitudes and bolometric corrections for the primary star. The components of the system’s proper motions present some indications about membership of the North America nebula.
stars: binaries: close \addkeyword binaries: eclipsing \addkeyword binaries: general \addkeyword binaries: spectroscopic \addkeyword stars: individual: V1898 Cyg
0.1 Introduction
V1898 Cyg (HD 200776, BD +45∘ 3384, 2MASS J21035377+4619499, HIP 103968, V=7m.81, (B-V)=+0m.01) was discovered to be single-lined spectroscopic binary by Abt et al. (1972). HD 200776 was included in the list of bright OB stars to be observed for determination of galactic rotational constants and other galactic parameters. Their spectroscopic observations yield that HD 200776 is a spectroscopic binary with an orbital period of 2.9258 days. They also calculated the preliminary elements and mass function for the system. McCrosky and Whitney (1982) searched for photometric variations some short-period spectroscopic binaries including HD 200776 given in the Seventh Catalogue of the Orbital Elements of Spectroscopic Binary System (Batten et al. 1978). They observed abrupt drops, with an amount of 0m.2-0m.4, in the brightness of the system which were inconsistent with the orbital period proposed by Abt et al (1972). Photometric observations in B and V-bandpass made by Halbedel (1985) revealed that HD 200776 is an eclipsing binary with both eclipses are nearly identical, in contrast to the spectroscopic observations. He proposed a new orbital period of 3.0239 days, 3 per cent longer than that given by Abt et al (1972). Caton and Smith (hereafter CS, 2005) published new light curve and times of mid-eclipses as well as a new orbital period of 1.5131273 days, nearly half that of given by Halbedel (1985). Soon later Dallaporta and Munari (hereafter DM, 2006) presented complete and accurate BV light curves of HD 200776 as well as three times for mid-primary eclipse. Fortunately the same comparison star was used in the photometric observations of Halbedel (1985) and DM. No further spectroscopic observations were made into this eclipsing-spectroscopic binary after Abt et al. (1972).
The main aims of this study are: (1)to detect some lines of the secondary component;(2)to reveal radial velocities for both components; (3) to solve the radial velocity curves for the primary and secondary components on the basis of new observations in order to reveal accurate masses and radii; and (4)to determine the rotational velocities of the components and compare with orbital synchronization.
0.2 Spectroscopic Observations
The spectra were obtained from several telescopes during the course of three years, beginning the year of 2007. Table 1 lists the full set of observations. The first set was observed with the échelle spectrograph (FRESCO) at the 91-cm telescope of Catania Astrophysical Observatory. Spectroscopic observations have been performed with the spectrograph is fed by the telescope through an optical fibre (–, 100 m core diameter) and is located, in a stable position, in the room below the dome level. Spectra were recorded on a CCD camera equipped with a thinned back–illuminated SITe CCD of 1k1k pixels (size 2424 m). The cross-dispersed échelle configuration yields a resolution of about 22 000, as deduced from the full width at half maximum of the lines of the Th–Ar calibration lamp. The spectra cover the wavelength range from 4300 to 6650 Å, split into 19 orders. In this spectral region, and in particular in the blue portion of the spectrum, there are several lines useful for the measure of radial velocity, as well as for spectral classification of the stars.
The system was also observed with the Turkish Faint Object Spectrograph Camera (TFOSC) attached to the 1.5 m RTT150 telescope on August 07-20, 2010 under good seeing conditions. Further details on the telescope and the spectrograph can be found at http://www.tug.tubitak.gov.tr. The wavelength coverage of each spectrum was 4100-9000 Å in 11 orders, with a resolving power of / 7 000 at 6563 Å.
The electronic bias was removed from all spectra and we used the crreject task of IRAF111IRAF is distributed by the National Optical Observatory, which is operated by the Association of the Universities for Research in Astronomy, inc. (AURA) under cooperative agreement with the National Science Foundation for cosmic ray removal. The échelle spectra were extracted and wavelength calibrated by using a Fe-Ar and Th-Ar lamp source with help of the IRAF echelle package. The stability of the instruments were checked by cross correlating the spectra of the standard star against each other using the fxcor task in IRAF. The standard deviation of the differences between the velocities measured using fxcor and the velocities in Nidever et al. (2002) was about 1.1 km s-1.
Twenty-eight spectra of V1898 Cyg were collected during the two different seasons. Typical exposure times for the V1898 Cyg spectroscopic observations were between 2400 and 2600 s for Catania telescope and 1200 s for RTT150 telescope. The signal-to-noise ratio () achieved was between 70 and 115, and 150 depending on atmospheric condition. Lyr (A0V), 59 Her (A3IV), Psc (F7V), HD 27962 (A2IV), and Her (B5IV) were observed during each run as radial velocity and/or rotational velocity templates. The average at continuum in the spectral region of interest was 150–200 for the standard stars.
| HJD | Phase | Star 1 | Star 2 | Remarks | ||||
|---|---|---|---|---|---|---|---|---|
| 2 400 000+ | Vp | O-C | Vs | O-C | ||||
| 54327.55412 | 0.5489 | 21.1 | 10.9 | 0.0 | -85.5 | 16.9 | -3.0 | a |
| 54328.50480 | 0.1772 | -38.1 | 3.6 | 6.9 | 255.3 | 11.1 | -7.2 | a |
| 54329.46135 | 0.8093 | 55.5 | 3.9 | -0.3 | -255.5 | 11.1 | 8.0 | a |
| 54330.47685 | 0.4805 | 1.2 | 11.1 | 3.5 | … | … | … | a |
| 54331.44914 | 0.1231 | -38.8 | 4.2 | -4.7 | 210.1 | 9.9 | 4.7 | a |
| 54335.45358 | 0.7695 | 56.7 | 3.3 | -2.5 | -285.8 | 4.3 | -4.8 | a |
| 54336.40281 | 0.3969 | -21.5 | 5.1 | 7.3 | 179.9 | 14.6 | 1.9 | a |
| 54337.46485 | 0.0988 | -21.1 | 6.6 | 6.5 | … | … | … | a |
| 54338.44704 | 0.7479 | 55.5 | 3.1 | -4.1 | -277.7 | 6.1 | 5.5 | a |
| 54360.40110 | 0.2571 | -44.4 | 5.1 | 6.3 | 288.6 | 7.2 | -3.2 | a |
| 54361.41090 | 0.9245 | 16.6 | 11.2 | -3.0 | -121.1 | 11.6 | 5.8 | a |
| 54362.55110 | 0.6780 | 55.5 | 7.7 | 1.4 | -258.6 | 10.9 | -4.3 | a |
| 54363.50010 | 0.3052 | -47.9 | 5.9 | -0.5 | 281.1 | 9.2 | 6.1 | a |
| 54364.50527 | 0.9695 | 18.0 | 9.1 | 3.1 | -63.7 | 18.5 | -13.4 | a |
| 54365.53939 | 0.6530 | 51.1 | 4.5 | 1.4 | -211.1 | 9.8 | 20.3 | a |
| 54366.54137 | 0.3152 | -33.5 | 4.1 | 12.6 | 270.9 | 10.1 | 2.6 | a |
| 55387.53130 | 0.0777 | -11.0 | 9.0 | 10.4 | 143.0 | 11.0 | 3.6 | b |
| 55390.46920 | 0.0193 | 13.0 | 8.0 | 15.2 | 77.0 | 20.0 | 37.8 | b |
| 55390.58090 | 0.0932 | -26.0 | 9.0 | 0.0 | 178.0 | 21.0 | 14.6 | b |
| 55391.50380 | 0.7031 | 59.0 | 2.0 | 1.8 | -276.0 | 8.0 | -5.2 | b |
| 55391.58150 | 0.7544 | 67.0 | 3.0 | 7.4 | -287.0 | 9.0 | -3.9 | b |
| 55392.41900 | 0.3079 | -43.0 | 3.0 | 4.1 | 265.0 | 9.0 | -8.3 | b |
| 55393.41980 | 0.9694 | 23.0 | 11.0 | 8.0 | -45.0 | 9.0 | 5.5 | b |
| 55394.57290 | 0.7314 | 44.0 | 3.0 | -15.2 | -274.0 | 6.0 | 7.2 | b |
| 55396.47080 | 0.9857 | 33.0 | 12.0 | 23.6 | -35.0 | 19.0 | -13.6 | b |
| 55397.38320 | 0.5887 | 25.0 | 7.0 | -8.6 | -156.0 | 11.0 | -8.3 | b |
| 55397.56950 | 0.7119 | 41.0 | 3.0 | -17.0 | -277.0 | 8.0 | -2.0 | b |
| 55398.39480 | 0.2573 | -52.0 | 2.0 | -1.4 | 302.0 | 8.0 | 10.2 | b |
-
Remarks:
(a) Based on Catania and (b) on TUG observations.
0.3 Spectroscopic analysis
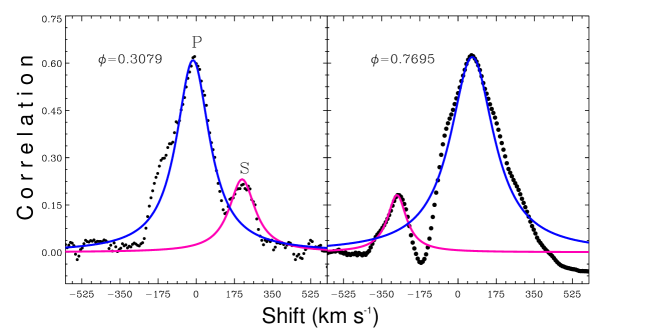
Double-lined spectroscopic binaries reveal two peaks, displacing back and forth, in the cross-correlation function (CCF) between variable and the radial velocity template spectrum as seen in Fig. 1. The location of the peaks allows to measure of the radial velocity of each component at the time of observation. The cross-correlation technique applied to digitized spectra is now one of the standard tools for the measurement of radial velocities in close binary systems.
The radial velocities of V1898 Cyg were obtained by cross–correlating of échelle orders of V1898 Cyg spectra with the spectra of the bright radial velocity standard stars Lyr (A0V), 59 Her (A3IV) and Psc (F7V) (Nordström et al., 2004). For this purpose the IRAF task fxcor was used.
Fig. 1 shows examples of CCFs of V1898 Cyg near the first and second quadrature. The two non-blended peaks correspond to each component of V1898 Cyg. We applied the cross-correlation technique to five wavelength regions with well-defined absorption lines of the primary and secondary components. These regions include the following lines: Si iii 4568 Å, Mg ii 4481 Å, He i 5016 Å, He i 4917 Å, He i 5876 Å. The stronger CCF peak corresponds to the more massive component that also has a larger contribution to the observed spectrum. To better evaluate the centroids of the peaks (i.e. the radial velocity difference between the target and the template), we adopted two separate Gaussian fits for the case of significant peak separation.
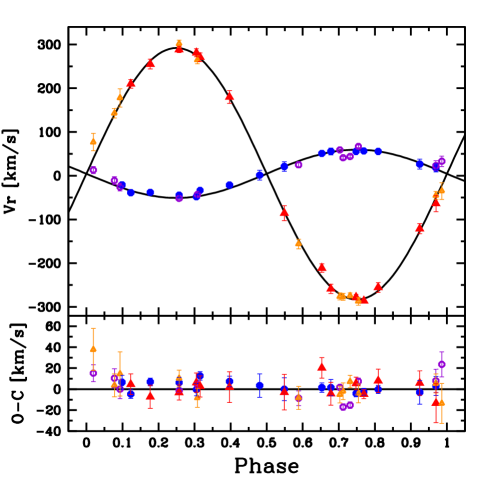
The radial velocity measurements, listed in Table 1 together with their standard errors, are weighted means of the individual values deduced from each order. The observational points and their error bars are displayed in Fig. 2 as a function of orbital phase as calculated by means of the linear part of the ephemeris given in Eq. 2. The radial velocities of the secondary component of V1898 Cyg are presented for the first time in this study. The simultaneous analysis both curves gives the semi-amplitude of the more massive, more luminous component to be K1=55.20.8 km s-1 and K2=287.62.1 km s-1 for the secondary component with a systemic velocity of 0.8 km s-1.
0.3.1 Spectral classification
The spectral types of the stars can be found either photometry or spectroscopy and/or both. The apparent visual magnitude and colours of V1898 Cyg were estimated by Hiltner (1956) as V=7m.81, B-V=0m.01, U-B=-0m.82. However the apparent magnitudes are given by Reed (2003) as 7m.0, 7m.80 and 7m.82 in the U, B and V passbands, respectively. On the other hand, The B-V colour of the system at outside of eclipse was determined as 0m.01 by Halbedel (1985). We computed the B-V colour of the system at the maxima as 0m.036 using the data given by Dallaporta and Munari (2006). The combined spectral types are given as B1 IVp by Abt et al. (1972) and B2 III by Kennedy and Buscombe (1974). The infrared magnitudes of the system are given by Cutri et al. (2003) as J=7m.697, H=7m.718 and K=7m.757. Unfortunately, intermediate- and narrow-band photometric measurements are not available for the system. Bessell et al.(1998) derive reddening-independent Q-parameter from theoretical colours as Q=(U-B)-0.71 (B-V). They also predict interstellar reddening for the main-sequence OB stars as E(B-V)=(B-V)-((U-B)-0.71(B-V))/3. Using the observed (U-B) and (B-V) colours by Hiltner (1956) we find E(B-V)=0m.28, while for Dallaporta and Munari (2006) estimate the reddening as 0m.31.
We computed the intrinsic colours of the primary component using the JHK magnitudes as and . V1898 Cyg locates between supergiants and dwarfs in the infrared (J-H)-(H-K)diagram (Tokunaga 2000). Using the the equations given by Straižys et al. (2008) we estimated interstellar reddening as and . Using the transformation equation given by Bessell et al.(1998)we find , in a very good agreement with that found by the UBV colours. Since the observed common colour index is 0m.036 one obtains an intrinsic B-V colour of -0m.25 which corresponds to a B1V star in the calibrations of Papaj et al. (1993).
We have used our spectra to determine the spectral type of the primary component of V1898 Cyg. We have followed the procedures of Hernández et al. (2004), choosing helium lines in the blue-wavelength region, where the contribution of the secondary component to the observed spectrum is almost negligible. From several spectra we measured of as Å, respectively. Then we used the -spectral type diagrams given by Hernández et al. (2004). The of the helium lines indicate that the spectral type of the primary component is which is in a agreement with that obtained from infrared photometry. The calibration of Papaj et al. (1993) gives an effective temperature of 18700 K and B-V of -0m.21 for a B2V star, 16800 K and -0m.19 for the same spectral type but for a giant star. Therefore, we estimated an effective temperature of K for the primary component of V1898 Cyg.
0.3.2 Reddening
The measurement of reddening is a key step in determining the distance of stars. V1898 Cyg locates in the direction of the NAP, in which reddening varies from one place to other. We estimated the reddening in the B-V colour as 0m.29 using the infrared colours. On the other hand we find .25 for a star of B2V and .23 for a star of B2III. The photometric and spectroscopic determinations of the interstellar reddening seem to be in a good agreement within error. Our spectra cover the interstellar Nai (5890 and 5896 Å) doublet, which is excellent estimator of the reddening as demonstrated by Munari & Zwitter (1997). They calibrated a tight relation linking the Na i D1 (5890 Å) equivalent widths with the E(B-V) reddening. On spectra obtained at quadratures, lines from both components are un-blended with the interstellar ones, which can therefore be accurately measured. We derive an equivalent width of 0.520.06 Å for Nai D1 line, which corresponds to E(B-V)= 0m.330.09. Since the star locates nearly at the galactic plane(=87\arcdeg.60, -0\arcdeg.34) and near the edge of North America nebula (NAN) such a reddening in the optical wavelengths is expected.
0.3.3 Rotational velocity
The width of the cross-correlation profile is a good tool for the measurement of (see, e.g., Queloz et al. 1998). The rotational velocities () of the two components were obtained by measuring the FWHM of the CCF peaks in nine high-S/N spectra of V1898 Cyg acquired close to the quadratures, where the spectral lines have the largest Doppler-shifts. In order to construct a calibration curve FWHM–, we have used an average spectrum of HD 27962, acquired with the same instrumentation. Since the rotational velocity of HD 27962 is very low but not zero ( 11 km s-1, e.g., Royer et al. (2002) and references therein), it could be considered as a useful template for A-type stars rotating faster than 10 km s-1. The spectrum of HD 27962 was synthetically broadened by convolution with rotational profiles of increasing in steps of 5 km s-1 and the cross-correlation with the original one was performed at each step. The FWHM of the CCF peak was measured and the FWHM- calibration was established. The values of the two components of V1898 Cyg were derived from the FWHM of their CCF peak and the aforementioned calibration relations, for a few wavelength regions and for the best spectra. This gave values of 1105 km s-1 for the primary star and 909 km s-1 for the secondary star.
| Minimum time | Epoch | O-C(I) | O-C(II) | O-C(III) | Ref. |
|---|---|---|---|---|---|
| (HJD-2 400 000) | |||||
| 45960.6758 | -3126 | -0.0371 | 0.0139 | 0.0004 | 1 |
| 45963.6986 | -3124 | -0.0406 | 0.0105 | -0.0030 | 1 |
| 46010.6101 | -3093 | -0.0355 | 0.0151 | 0.0018 | 1 |
| 46013.6351 | -3091 | -0.0367 | 0.0138 | 0.0006 | 1 |
| 50690.6948 | 0 | 0.0000 | 0.0010 | 0.0010 | 3 |
| 52169.7772 | 977.5 | 0.0174 | 0.0027 | 0.0014 | 3 |
| 52185.6636 | 988 | 0.0161 | 0.0013 | 0.0000 | 3 |
| 52895.3220 | 1457 | 0.0259 | 0.0036 | 0.0007 | 2 |
| 52901.3740 | 1461 | 0.0255 | 0.0031 | 0.0002 | 2 |
| 52928.6107 | 1479 | 0.0262 | 0.0035 | 0.0005 | 3 |
| 53207.7802 | 1663.5 | 0.0269 | 0.0013 | -0.0025 | 3 |
| 53226.6966 | 1676 | 0.0294 | 0.0036 | -0.0003 | 3 |
| 53246.3663 | 1689 | 0.0287 | 0.0027 | -0.0013 | 2 |
| 53270.5757 | 1705 | 0.0284 | 0.0021 | -0.0020 | 3 |
| 54443.2559 | 2480 | 0.0483 | 0.0096 | 0.0011 | 4 |
| 54443.2565 | 2480 | 0.0489 | 0.0102 | 0.0017 | 4 |
| 54691.4070 | 2644 | 0.0494 | 0.0080 | -0.0016 | 4 |
| 54691.4089 | 2644 | 0.0513 | 0.0099 | 0.0003 | 4 |
| 54691.4097 | 2644 | 0.0521 | 0.0107 | 0.0011 | 4 |
-
Ref:
(1) Halbedel (1985), (2) Dallaporta and Munari (2006), (3) Caton and Smith (2005), (4) Brát et al. (2008)
0.4 Times of minima and the orbital period
Times of mid-eclipses were published by Halbedal(1985), CS, DM and Brát et al. (2008). These times of eclipses were presented in Table 2. The O-C(I) residuals are computed using the light elements given below,
| (1) |
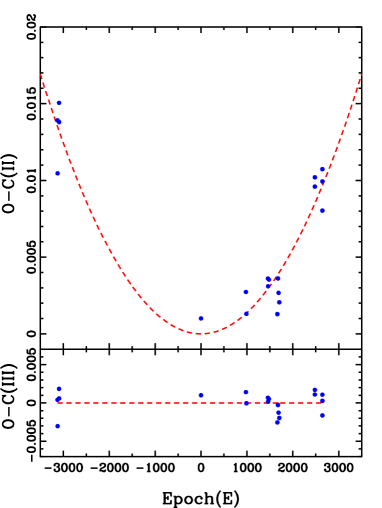
where the orbital period is adopted from DM. The behaviour of the deviations from the linear light elements O-C(II) with respect to the epoch numbers suggests an upward curved parabola. Therefore, a parabolic fit to the data gives,
| (2) |
The standard mean errors in the last digits are given in the parentheses. The coefficient of the quadratic term is positive which indicates that the orbital period of the system is increasing with the epoch number. Such a quadratic ephemeris appears to a very good representation of the orbital period change of V1898 Cyg, as well as other interacting Algols. This quadratic behaviour of the O-C(II) residuals, plotted in the upper panel of Fig.3, is an indication of the secular period increase for the system. In the bottom panel of Fig.3 the O-C(III) residuals with respect to ephemeris (2) are plotted, which illustrates a good agreement between the timings and new ephemeris. It is known that the classical Algols have an evolved less massive component which fills its Roche lobe and transfers its mass to the more massive primary star through Lagrangian L1 point of the system. The orbital period of the system is increasing at the average rate of which means that the orbital period was increased by about 0.38(0.04) seconds in the last 24 years. The sum of squares of residuals for the parabolic fit is d2. We limited times of mid-eclipses covering about 24 yrs. The time span of the observations is very short to reveal any abrubt period change caused by the fast mass transfer phenomenon. Of course the observations will be obtained in the coming years indicate some hints about the nature of orbital period change. Assuming a conservative mass transfer from the less massive component to the more massive primary star we estimate an amount of in a year.
0.5 Analysis of the light curves
Three light curves V1898 Cyg were obtained and the observational data were published. The first photometric observations obtained by Halbedel (1985) between July and November, 1985. The second photometric observations made by CS from August 22, 2001 to October 26, 2004. The star was observed by DM from July 22, 2003 to September 17, 2004. Only the V-band light curve and observational data of CS were published. However,the B and V light curves of DM were published. The V light curves obtained in two studies are asymmetric in shape, furthermore differ from each other. The brightness of the system shows a fast decrease from phase 0.75 up to external contact. However,the increase in brightness following the primary eclipse is not steeper.The distortion of the light curve preceding the primary eclipse is larger in the CS light curve. A remarkable change in the light curve is seen at the phase interval between 0.09 and 0.42. The total brightness of the system in the V-bandpass at this phase interval is greater by about 0m.03 in the CS light curve than that in DM’s. However, CS report that the brightness of their primary comparison star showed light variations during the observations. Moreover the depth of the secondary eclipse is larger by about 0m.007 in the light curve of CS than that of DM. We should note that there is also a slight asymmetry in both the DM’s B- and V-passband light curves. This feature is attributed to the transferring material from cool secondary to the high temperature primary star which occults a small area of the primary star just before the deeper eclipse.
Acerbi and Barani (2007) analysed the DM’s light curves. Since the spectroscopic mass-ratio was not available at that time they started to the analysis by deriving the photometric mass-ratio.Their preliminary analysis indicated that the mass-ratio for the system was about 0.30. Assuming an effective temperature of 20 183 K for the primary component and the secondary less massive star fills its corresponding Roche-lobe, i.e. semi-detached configuration, they arrived at a preliminary elements for the system. Their orbital parameters were: , and =0.2795 and T2=7 500 K. Since the light curves were asymmetric they reported that the agreement between the computed and observed light curves were not very satisfactory, the sum of squares of residuals was about 0.814.
In order to analyse the light curves we choose the Wilson–Devinney (W–D) code implemented into the PHOEBE package tool by Prsa & Zwitter (2005). Preliminary analysis indicates that the system is a classical Algol, the secondary component fills its corresponding Roche lobe. Therefore Mode–5 is applied. WD code is based on Roche geometry which is sensitive to the mass ratio which is taken from RV analysis as 0.1920.002. Gravity–darkening exponents = 1, = 0.32 and bolometric albedos =1, =0.5 were set, i.e. the more massive star has a radiative envelope while the less massive secondary convective atmosphere. We used the non-linear square-root limb–darkening and the bolometric limb-darkening coefficients from the tables Diaz-Cordoves, Claret, and Gimenez (1995) and van Hamme(1993).
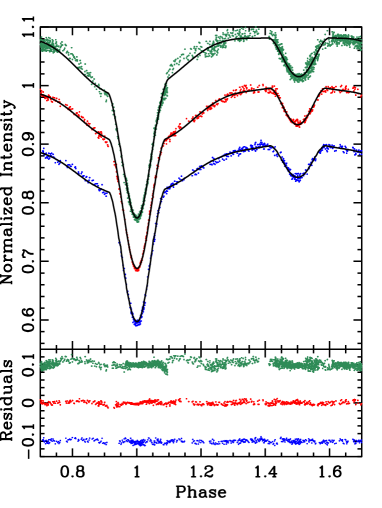
The orbital inclination (), effective temperature of the secondary star (T2), surface potential of the primary (), phase shift (), and fractional luminosity of the primary () were taken as adjustable parameters. The other parameters were fixed. The iterations were carried out automatically until convergence and a solution was defined as the set of parameters for which the differential corrections were smaller than the probable errors. The final results obtained by separate analysis of three light curves are listed in Table 3 and the computed light curves are shown as continuous lines in Fig. 4. The uncertainties assigned to the adjusted parameters are the internal errors provided directly by the WD code. As seen in Table 3 the sum of residuals-squares are 0.0109 and 0.0123 for the B- and V-bandpass light curves, indicating 75-times smaller than the analysis made by Acerbi and Barani (2007) of the same data. In the bottom panel of Fig.4 the residuals between observed and computed intensities are also plotted. The residuals reveal that the binary model may represent the observed DM’s light curves successfully. However, the computed light curve differs mostly from fourth contact to beginning of secondary eclipse in the CS light curve.
| Parameter | CS V | DM B | DM V |
|---|---|---|---|
| 74.200.02 | 73.050.03 | 73.030.03 | |
| (K) | 18 000[Fix] | ||
| (K) | 658265 | 620576 | 610950 |
| 3.08870.0085 | 3.28850.0116 | 3.27840.0103 | |
| 2.2122[Fix] | |||
| 0.1918[Fix] | |||
| 0.95630.0013 | 0.98010.0017 | 0.94900.0016 | |
| 0.35130.0013 | 0.32960.0013 | 0.32860.0012 | |
| 0.24640.0012 | 0.24640.0012 | 0.24640.0012 | |
| 0.00220.0001 | 0.00080.0001 | 0.00080.0001 | |
| 0.1196 | 0.0109 | 0.0123 | |
-
Ref:
: Relative volume radii, CS V: Caton and Smith’s (2005) V-band light curve, DM B and DM V: The B- and V-band light curves of Dallaporta and Munari (2006). The errors quoted for the adjustable parameters are the formal errors determined by the WD-code.
| Parameter | Primary | Secondary |
|---|---|---|
| Mass (M⊙) | 6.0540.037 | 1.1620.011 |
| Radius (R⊙) | 3.5260.009 | 2.6400.010 |
| (K) | 18 000 600 | 6 200200 |
| 3.0710.029 | 0.9570.085 | |
| () | 4.1250.002 | 3.6600.004 |
| Spectral Type | B2IV1 | G2III1 |
| (R⊙) | 10.7140.022 | |
| (∘) | 73.050.03 | |
| (pc) | 5015 | |
| (km s-1) | 1105 | 909 |
| (km s-1) | 112.80.3 | 84.50.4 |
| , , (mag)∗ | 7.6970.035, 7.7180.026, 7.7570.020 | |
| , (mas yr-1)∗∗ | 2.070.62, 0.810.53 | |
*2MASS All-Sky Point Source Catalogue (Cutri et al. 2003)
**Newly Reduced Hipparcos Catalogue (van Leeuwen 2007)
0.6 Discussion and conclusion
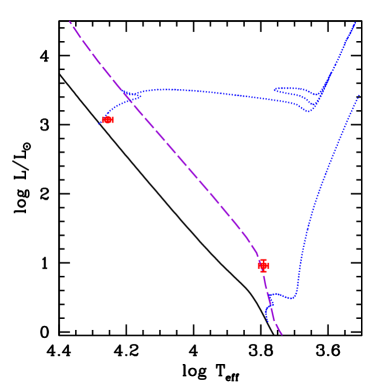
Since the sum-of-squares in the analysis of CS light curve is too large when compared to the DM’s light curves, and there is a doubt on the light constancy of their primary comparison we take weighted mean orbital parameters obtained by the analysis of the DM’s B and V light curves.The mean parameters obtained from the light curve analysis are: .050.02, =0.32910.0013, =0.24640.0012, T2=6 200200 K. The fractional radius of the secondary component exceeds its corresponding Roche lobe radius by about 4%. Combining the results obtained from RVs analysis we have derived the astrophysical parameters of the components and other properties listed in Table 4. The mass and radius of the massive primary star are derived with an accuracy of 0.6 and 1.4 per cent while for the less massive donor star 0.4 and 0.5 per cent. The observed and computed rotational velocities of the components are in good agreement, showing nearly synchronize rotation. In Fig. 5, we plot the location of V1898 Cyg stellar components in diagram. The evolutionary tracks for masses 6 and 1.16 M⊙ are also shown in this figure. For constructing the solar metallicity evolutionary tracks, we used the Cambridge version of the stars code which was originally developed by Eggleton (1971) and substantially updated by Eldridge & Tout (2004). The continuous and dashed lines from left to right corner show the zero-age and terminal-age main-sequences, respectively. While the primary star locates very close to the ZAMS the secondary, less massive star appears to be evolved up to the giant branch as is common in semi-detached Algol-type binaries. This appearance of the components in the HR diagram is common for the classical Algol-type binaries. The donor seems to higher temperature and luminosity, in which most of the atmospheric material has been transferred to its companion. Since the secondary component fills its Roche lobe it transfers its mass to the more massive component. Therefore the orbital period change is attributed to the mass transfer. However, the gainer is ascended up to higher effective temperature and luminosity. In addition, V1898 Cyg locates in the diagram between the specific angular momentum and mass-ratio where angular momentum decreases faster (see Ibanoglu et al. 2006). The average distance to the system was calculated to be 5015 pc. However, the average distance to the system is estimated to be 621 pc from the trigonometric parallax measured by the Hipparcos mission. The distance derived in this study is smaller by about 20 per cent, the most importantly it has very small uncertainty when compared with that measured by Hipparcos mission.
The North America (NGC 7000) and Pelican (IC 5070) nebulae (NAP) are known as the most nearby huge, extended HII regions where star formation with intermediate mass is still ongoing. The distance to this extended star-forming region has been estimated from 200 to 2000 pc (see for example, Bally and Reipurth, 2003). While Herbig (1958) estimates a distance of 500 pc, Laugalys and Straižys (2002) derived a distance to NAP 60050 pc. If the star is a member of NAP complex the distance to the star derived by us is in a better agreement with that of Herbig, but agrees with that proposed by Laugalys and Straižys (2002) within level. Recently, Straižys, Corbally and Laugalys (2008) listed OB stars in the vicinity of NAP, one of which is V1898 Cyg. The distance to the star estimated by us appears to confirm the membership of NAN. Proper motions for V1898 Cyg are given in the SIMBAD database as =2.070.62 mas yr-1 and =0.810.53 mas yr-1 with a space velocity of 45.3 km s-1. We selected about 20 stars in the vicinity of V1898 Cyg listed by Laugalys and Straižys (2002) for comparison their mean proper motions with the variable. The velocities of the stars vary from 45 to kms-1, and the mean proper motions are: , mas yr-1. It seems that one can not definitely classify which stars are actually belong to the NAP and which are not.
Acknowledgments
We thank Prof. G. Strazzulla, director of the Catania Astrophysical Observatory, and Dr. G. Leto, responsible for the M. G. Fracastoro observing station for their warm hospitality and allowance of telescope time for the observations. We also thank to TÜBİTAK National Observatory (TUG) for a partial support in using RTT150 with project numbers 10ARTT150-483-0 and 09BRTT150-468-0. This research has been also supported by TÜBİTAK under project number 109T708 and INAF and Italian MIUR. This research has been made use of the ADS and CDS databases, operated at the CDS, Strasbourg, France and ULAKBİM Süreli Yayınlar Kataloǧu. The authors thank to the anonymous referee for his/her valuable comments.
References
- Baldwin et al. (1991) Abt H. A., Levy S. G., Gandet T. L., 1972, AJ, 77, 138
- Baldwin et al. (1991) Acerbi F., Barani C., 2007, OEJV, 77, 1
- Baldwin et al. (1991) Bally J., Reipurth B., 2003, AJ, 126, 893
- Baldwin et al. (1991) Batten A. H., Fletcher J. M., Mann P. J., 1978, PDAO, 15, 121
- Baldwin et al. (1991) Bessell M. S., Castelli F., Plez B., 1998, A&A, 337, 321
- Baldwin et al. (1991) Brát L., et al., 2008, OEJV, 94, 1
- Baldwin et al. (1991) Caton D. B., Smith A. B., 2005, IBVS, 5699/76(CS)
- Baldwin et al. (1991) Cutri R. M., et al., 2003, The IRSA 2MASS All-Sky Point Source Catalog, NASA/IPAC Infrared Science Archive. http://irsa.ipac.caltech.edu/applications/Gator/
- Baldwin et al. (1991) Dallaporta S., Munari U., 2006, IBVS, 5714, 1 (DM)
- Baldwin et al. (1991) Diaz-Cordoves J., Claret A., Gimenez A., 1995, A&AS, 110, 329
- Baldwin et al. (1991) Eggleton, P. P., 1971, MNRAS, 151, 351
- Baldwin et al. (1991) Eldridge J. J., Tout C. A., 2004, MNRAS, 348, 201
- Baldwin et al. (1991) Halbedel E. M., 1985, IBVS, 2663, 1
- Baldwin et al. (1991) Herbig G. H., 1958, ApJ, 128, 259
- Baldwin et al. (1991) Hernández J., Calvet N., Briceño C., Hartmann L., Berlind P., 2004, AJ, 127, 1682
- Baldwin et al. (1991) Hiltner W. A., 1956, ApJS, 2, 389
- Baldwin et al. (1991) Ibanoǧlu C., Soydugan F., Soydugan E., Dervişoǧlu A., 2006, MNRAS, 373, 435
- Baldwin et al. (1991) Kennedy P. M., Buscombe W., 1974, ”MK spectral classifications, published since Jaschek’s La Plata Catalogue”, Northwestern University
- Baldwin et al. (1991) Laugalys V., Straižys V., 2002, BaltA, 11, 205
- Baldwin et al. (1991) McCrosky R. E., Whitney C. A., 1982, IBVS, 2186, 1
- Baldwin et al. (1991) Munari U., Zwitter T., 1997, A&A, 318, 269
- Baldwin et al. (1991) Nidever D. L., Marcy G. W., Butler R. P., Fischer D. A., Vogt S. S., 2002, ApJS, 141, 503
- Baldwin et al. (1991) Nordström B., Mayor M., Holmberg J., Pont F., Jorgensen B. R., Olsen E. H., Udry S., Mowlavi N., 2004, A&A, 418, 989
- Baldwin et al. (1991) Papaj J., Krelowski J., Wegner W., 1993, A&A, 273, 575
- Baldwin et al. (1991) Prša A., Zwitter T., 2005, ApJ, 628, 426
- Baldwin et al. (1991) Reed B. C., 2003, AJ, 125, 2531
- Baldwin et al. (1991) Royer F., Grenier S., Baylac M.-O., Gómez A. E., Zorec J., 2002, A&A, 393, 897
- Baldwin et al. (1991) Straižys V., Corbally C. J., Laugalys V., 2008, BaltA, 17, 125
- Baldwin et al. (1991) Queloz D., Allain S., Mermilliod J.-C., Bouvier J., Mayor M., 1998, A&A, 335, 183
- Baldwin et al. (1991) Tokunaga A. T., 2000, in Cox A. N., ed., Allen’s Astrophysical Quantities, 4th edn. Springer-Verlag, Berlin , p. 143
- Baldwin et al. (1991) van Hamme W., 1993, AJ, 106, 2096
- Baldwin et al. (1991) van Leeuwen F., 2007, A&A, 474, 653