Previous address: ]Department of Physics, University of Basel, Switzerland; Now at II. Physikalisches Institut, Justus-Liebig-Universität Giessen, and GSI Helmholtzzentrum für Schwerionenforschung GmbH, Darmstadt, Germany Present address: ]Institut für Kernphysik, Technische Universität Darmstadt, Germany Present address: ]Instituto de Fisica Corpuscular (IFIC), E-46071 Valencia, Spain Previous address: ]University of Lodz, Division of Nuclear Physics, Lodz, Poland Present address: ]ExtreMe Matter Institute EMMI, GSI Helmholtzzentrum für Schwerionenforschung GmbH, Darmstadt, Germany Present address: ]University of Notre Dame, 225 Nieuwland Science Hall, Indiana, USA
Cross sections for proton-induced reactions on Pd isotopes
at energies relevant for the process
Abstract
Proton-activation reactions on natural and enriched palladium samples were investigated via the activation technique in the energy range of =2.75 MeV to 9 MeV, close to the upper end of the respective Gamow window of the process. We have determined cross sections for 102Pd103Ag, 104Pd105Ag, and 105Pd105Ag, as well as partial cross sections of 104Pd104Agg, 105Pd106Agm, 106Pd106Agm, and 110Pd110Agm with uncertainties between 3% and 15% for constraining theoretical Hauser-Feshbach rates and for direct use in -process calculations.
pacs:
25.40.-h, 26.30.Ef, 27.60.+j, 97.60.BwI Introduction
Astrophysical models can explain the origin of most nuclei beyond the iron group as a combination of processes involving neutron captures on long ( process) or short ( process) time scales Burbidge et al. (1957); Langanke and Wiescher (2001). However, 32 proton-rich stable isotopes between 74Se and 196Hg cannot be formed by these neutron capture reactions because they are either shielded by stable isotopes from the -process decay chains or lie outside the -process reaction sequence. These isotopes are attributed to a so-called ” process”, and are 10 to 100 times less abundant than the neighboring and nuclei.
The astrophysical details of the process are still under discussion and it is conceivable that several different nucleosynthesis processes and sites may conspire to produce all of the nuclei. The currently favored astrophysical site is explosive burning in core collapse supernovae, where a shock front heats the O/Ne shell of the progenitor star to temperatures of 2–3 GK, causing photodisintegration of pre-existing seed nuclei Woosley and Howard (1978, 1990); Rayet et al. (1995); Rauscher et al. (2002). The seed nuclei are partly already present in the proto-stellar cloud from which the star formed and are partly created in the weak process during hydrostatic burning preceding the explosion. The very rare nuclei 138La and 180Tam cannot be made in this manner but rather originate from neutrino-induced reactions ( process Woosley et al. (1990); Heger et al. (2005)).
Such a synthesis of proton-rich nuclei by sequences of photodissociations and decays is also termed ” process” Woosley and Howard (1978); Rauscher et al. (2002). The reaction sequences start with () reactions at stability, producing proton-richer, unstable nuclei which, in turn, are further disintegrated. When () and () reactions become comparable to or faster than neutron emission within an isotopic chain, the reaction path is deflected and feeds chains with lower charge number . The decrease in temperature at later stages of the process leads to freeze-out via neutron captures and decays, resulting in the typical -process abundance pattern with maxima at 92Mo (=50) and 144Sm (=82).
Calculations based on the process concept can produce the bulk of the nuclei Rayet et al. (1995, 1990); Rauscher et al. (2002). However, the most abundant isotopes, 92,94Mo and 96,98Ru, as well as the whole region 124 are notoriously underproduced. Additionally, the mass region 150165 also seems underproduced in modern, self-consistent models Rauscher et al. (1995, 2002). It is not yet clear whether the observed underproductions are due to deficiencies in the astrophysical modeling or in the nuclear physics input. The lack of seed nuclei for the production of the light nuclei indicates the former for the lighter mass region but reliable nuclear physics input is important in both regions. Alternatives to the core-collapse supernova scenario (e.g., explosion of a mass-accreting white dwarf Howard et al. (1991) or sub-Chandrasekhar mass white dwarf Goriely et al. (2002), rapid proton captures in X-ray bursts Schatz et al. (1998, 2001) and in the process Fröhlich et al. (2006)) still suffer from insufficient modeling, constraints from meteoritic data Dauphas et al. (2003), and their uncertain contribution to the total galactic nucleosynthesis. In any case, reliable reaction rates are instrumental for developing a consistent -process picture.
From the mere size of the nuclear reaction network for the process, which includes about 1800 isotopes and more than ten thousand reactions mostly with unstable nuclei, it becomes obvious that the vast majority of reaction rates has to be determined theoretically.
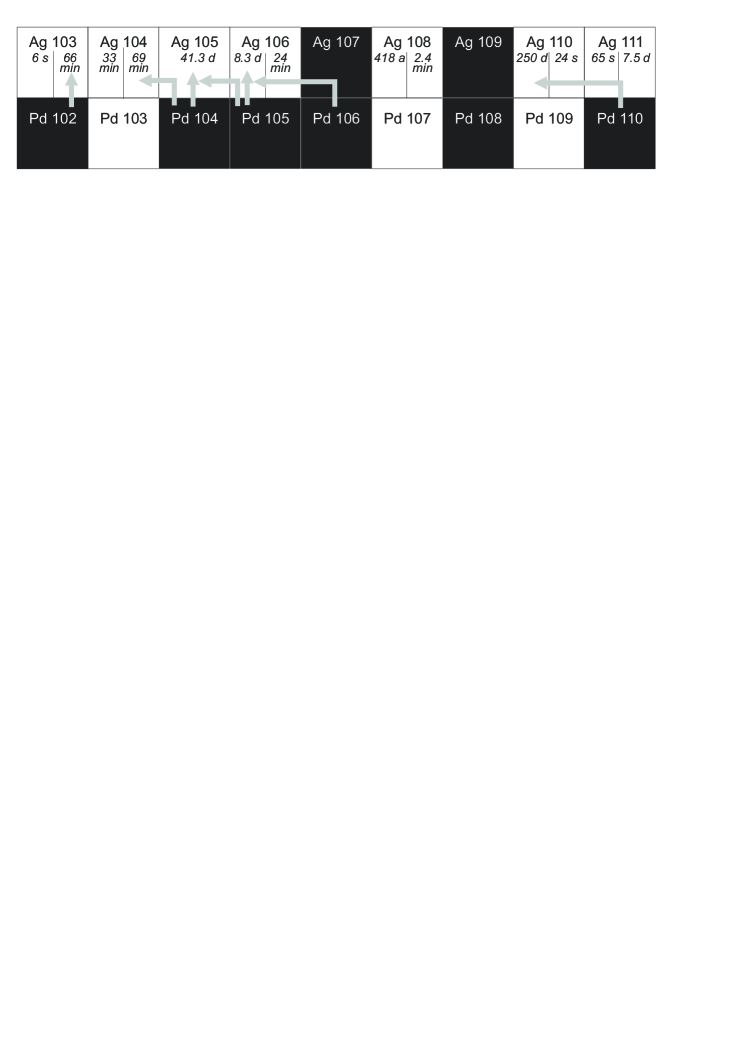
The experimental database for the process is – despite many efforts in the last years – still very limited, because measurements of the small cross sections of charged-particle reactions below the Coulomb barrier represent a continuing experimental challenge. In this work we present the results of () and () reaction studies on several Pd isotopes (as indicated in Fig. 1) close to the astrophysically relevant energies of the process Rauscher (2010).
The importance of the measured () reactions for the process is twofold. Firstly, theoretical predictions for their cross sections can be tested in order to improve the nuclear reaction modeling for the process. Secondly, reaction rates derived from the measurements can directly be included in reaction networks for nucleosynthesis.
The deflections in the -process path are governed by () reactions in the lighter mass range Rauscher (2006). Although the () rate will dominate over () in the process, it has been shown that it is always more advantageous to measure the capture rate and derive its inverse rate by application of detailed balance Kiss et al. (2008); Rauscher et al. (2009). This is because the reaction rate has to include the thermal population of excited target states in the astrophysical plasma which leads to cross section modifications relative to the cross section of the reaction proceeding only via the ground state of a target nucleus. Since only the latter can be studied in the laboratory it is desirable to measure in the direction of least alteration due to stellar plasma effects. The stellar enhancement factor is defined as the ratio of the stellar rate , including reactions from thermally populated states of the target nucleus, and the laboratory rate with reactions proceeding only from the ground state of the target nucleus Iliadis (2007). For the process, the SEF is always smaller for capture than for photodisintegration Utsunomiya et al. (2006); Rauscher et al. (2009).
The importance of () reactions for the lower mass range of nuclei has been pointed out in Rapp et al. (2006). For proton-rich nuclei, () reactions have a positive reaction value and are in general less affected by stellar plasma effects than () reactions. However, it was pointed out recently that the stellar cross section modification can be suppressed by the Coulomb barrier and that the SEF may be lower for some () reactions than for their () counterpart Kiss et al. (2008); Rauscher et al. (2009). The reaction 105Pd()105Ag is such a case among the reactions presented here. Its SEFs are only in the relevant plasma temperature range of GK, compared to SEFs of for its inverse reaction. For the other () reactions presented in this work, we could only determine partial cross sections to the ground or isomeric state. These cannot be directly converted to astrophysical reaction rates but can be used – with the aid of theoretical calculations – to test the description of the proton optical potential, which is also essential in the prediction of the capture and photodisintegration rates.
II Experimental technique
All cross section measurements have been carried out at the cyclotron and Van de Graaff accelerator of Physikalisch-Technische Bundesanstalt (PTB) in Braunschweig/ Germany Brede et al. (1980) with the activation technique by irradiation of thin sample layers and subsequent counting of the induced activity. The Van de Graaff accelerator was used for energies up to 3.5 MeV, above that energy up to 9.0 MeV the cyclotron was used. The astrophysically relevant energy ranges for the measured reactions at temperatures of 2 and 3 GK are listed in Table 1. In most of the measurements, our data reaches into the energy window relevant in the process.
| Reaction | Lower end | Upper end | Measured | |
| (GK) | (MeV) | (MeV) | (MeV) | |
| 102Pd | 2 (3) | 1.64 (2.04) | 3.30 (4.29) | 2.686.85 |
| 104Pd | 2 (3) | 1.67 (2.13) | 3.40 (4.45) | 2.695.04 |
| 105Pd | 2 (3) | 1.51 (1.74) | 2.81 (3.90) | 2.715.04 |
| 104Pd | 2 (3) | 5.07 (5.07) | 5.70 (6.07) | 5.808.82 |
| 105Pd | 2 (3) | 3.87 (4.24) | 5.50 (5.98) | 2.695.04 |
| 106Pd | 2 (3) | 3.75 (3.76) | 4.35 (4.69) | 3.184.91 |
| 110Pd | 2 (3) | 1.71 (1.80) | 2.92 (3.74) | 3.438.81 |
II.1 Sample preparation
Samples of natural composition were prepared by sputtering 400 nm thick layers of Pd metal onto 1 mm thick Al disks 35 mm in diameter. Enriched 104Pd and 105Pd samples (from STB Isotopes, Germany, Table 2) were first produced by electrodeposition of a PdCl2 solution on tantalum backings (see Trautmann and Folger (1989) for a sketch of the electrolysis cell), but these layers did not properly adhere to the backings. Instead, the samples were made by careful and uniform deposition of 100 l of the PdCl2 solution within the area of the beam spot (12 mm in diameter) and subsequent drying.
The thicknesses of the Pd samples were determined by X-Ray fluorescence (XRF) by irradiation of the samples with the bremsstrahlung spectrum of a rhodium anode. The induced characteristic Pd X-rays were analyzed by reflection on a LiF crystal. This setup was calibrated relative to a blank sample and to six Pd reference samples (50 - 500 g) prepared from a standard solution.
The natural samples were between 420 and 520 nm in thickness, corresponding to a Pd mass of (395490) g or (2.93.6)1018 atoms/cm2. The enriched samples were about twice as thick and contained (680850) g or (3.44.2)1018 atoms/cm2 of 104Pd or 105Pd.
| Natural sample | Enriched sample | ||
|---|---|---|---|
| 104Pd | 105Pd | ||
| 102Pd | 1.02 (1) | 0.10 (2) | 0.01 (2) |
| 104Pd | 11.14 (8) | 97.0 (1) | 0.32 (10) |
| 105Pd | 22.33 (8) | 2.30 (5) | 94.50 (5) |
| 106Pd | 27.33 (3) | 0.45 (5) | 4.59 (5) |
| 108Pd | 26.46 (9) | 0.10 (2) | 0.46 (2) |
| 110Pd | 11.72 (9) | 0.05 | 0.13 |
II.2 Experimental setup
The samples were irradiated in an activation chamber, which was designed as a Faraday cup (Fig. 2). The charge deposited on the sample was recorded in short time steps by a current integrator for off-line correction of beam fluctuations (which turned out to be negligible in the end).
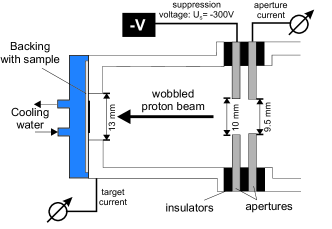
The proton beam was wobbled across the chamber aperture indicated in Fig. 2 for homogeneous illumination of the Pd samples. The aperture was slightly smaller than the negatively charged diaphragm (US=300 V) for suppression of secondary electrons. The samples with the Pd layers were water-cooled from the outside. For each energy step the proton-beam spot was adjusted by means of a quartz window to ensure that the sample was completely illuminated. The beam energy was defined within an uncertainty of 25 keV by means of the field calibration of two analyzing magnets as well as by a time-of-flight measurement of the particle velocity Böttger (2002). At energies below 3.5 MeV the Van de Graaff accelerator was used, where the uncertainty of the beam energy calibration was less than 3 keV.
For each activation the effective proton-energy was determined according to Eq. 4.99 in Iliadis (2007),
| (1) |
where is the target thickness (energy loss) calculated with the Monte Carlo program SRIM 2003 Ziegler and Biersack (2003), the respective center-of-mass energy, and , the measured cross sections of two neighboring points. As can be seen from Eq. 1 the error bars of become asymmetric, with the smaller component in positive direction due to the correction factor in brackets.
The samples were activated at 16 different proton energies between 2.75 MeV and 9.00 MeV switching between short-time activations (up to 7200 s for the 65.7 min ground-state in 103Ag) and long-time activations (up to 36000 s at 2.75 MeV). The average beam current was 10 A for the natural samples and 5 A for the enriched samples.
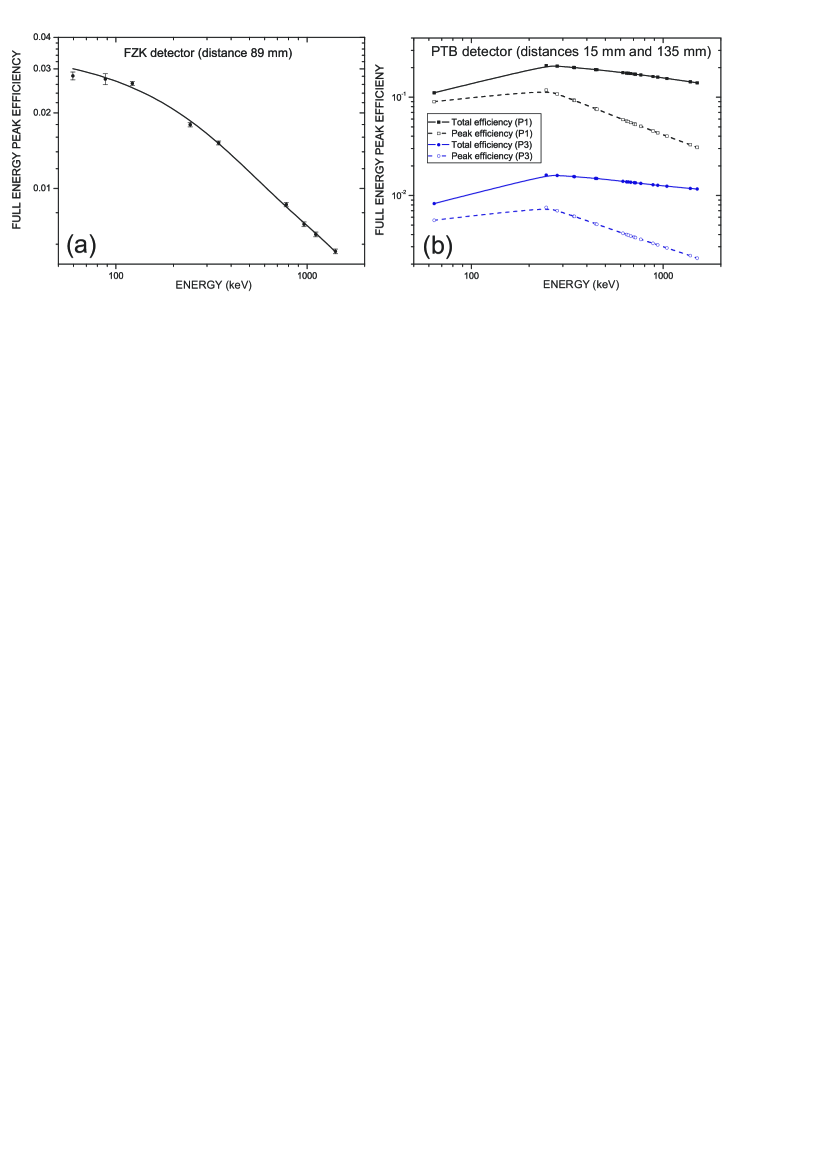
The produced activity was measured off-line with two different HPGe detectors (efficiency curves in Fig. 3), which were shielded from room background by 10 cm lead. The efficiencies shown in Fig. 3 were determined with an uncertainty of 2% by a set of calibrated reference sources. Apart from the 64 keV transition in 105Ag, which is very close to the calibration point at 60 keV measured with an 241Am source, all analyzed -ray lines are in the well-defined part of the efficiency curves above 100 keV (Table 3).
III Data analysis
The total amount of activated nuclei at the end of the irradiation can be deduced from the number of events in a particular -ray line (Table 3) registered in the HPGe detector during the measuring time Beer and Käppeler (1980):
| (2) |
The factor corresponds to the waiting time between irradiation and activity measurement. The factors and account for the HPGe efficiency and the relative intensity per decay (Table 3) of the respective transition, and is the correction factor for coincidence summing.
| Isotope | t1/2 | γ | γ |
|---|---|---|---|
| (keV) | (%) | ||
| 103Agg+m | 65.7 (7) m | 118.7 | 31.2 (7) |
| 148.2 | 28.3 (5) | ||
| 243.9 | 8.5 (5) | ||
| 266.9 | 13.4 (4) | ||
| 1273.8 | 9.4 (3) | ||
| 104Agg | 69.2 (7) m | 740.5 | 7.2 (9)111New intensities, see Table 5. |
| 758.7 | 6.4 (8)111New intensities, see Table 5. | ||
| 767.6 | 65.7 (21) | ||
| 942.6 | 25.0 (23)111New intensities, see Table 5. | ||
| 1625.8 | 5.1 (7)111New intensities, see Table 5. | ||
| 105Agg | 41.29 (7) d | 64.0 | 10.5 (10) |
| 280.4 | 30.2 (17) | ||
| 344.5 | 41.4 (6) | ||
| 443.4 | 10.5 (5) | ||
| 106Agm | 8.28 (2) d | 451.0 | 28.2 (7) |
| 717.2 | 28.9 (8) | ||
| 748.4 | 20.6 (6) | ||
| 1045.8 | 29.6 (10) | ||
| 110Agm | 249.76 (4) d | 657.8 | 94.3 (3) |
| 763.9 | 22.62 (21) | ||
| 884.7 | 72.7 (4) | ||
| 937.5 | 34.2 (6) |
Throughout the activations the proton flux was recorded in time steps of 1 min, but time variations were found to be negligible. Therefore, the correction for the decay during activation, , could be calculated by the expression for constant flux, . Any -ray self-absorption is negligible due to the thin Pd layers. The cross section (in barn) at the respective proton energy can then be calculated via
| (3) |
is the abundance of the respective Pd isotope (Table 2), the collected proton charge during the activation time , and the decay constant. is the area density of the Pd samples in cm-2.
III.1 Coincidence-summing corrections
Coincidence summing occurs when two or more rays are recorded within the resolving time of the detector Debertin and Helmer (1989). The induced activities were measured with two different HPGe detectors (labelled ”FZK detector” and ”PTB detector”, Fig. 3). The FZK detector is a -type coaxial detector with a thin carbon window and a crystal volume of 370 cm3 corresponding to a relative efficiency of 100%. The PTB detector is a -type coaxial detector with an aluminium window and a crystal volume of 300 cm3 corresponding to a relative efficiency of 70 %. All efficiencies are given with respect to 3” 3” NaI(Tl) detectors.
Because the FZK detector was only used for measurements at a distance of 89 mm, the summing corrections are low and were estimated with one sample measured also at a larger distance of 164 mm. The respective results were in perfect agreement with the calculated summing corrections. For the PTB detector, which was used at two distances (P1= 15 mm and P3= 135 mm) total and peak efficiencies were available from previous experiments (Fig. 3) and could be used for the calculation of coincidence summing corrections. In this work, summing corrections are significant only for measurements with the PTB detector at the short distance P1, which had to be used for the runs at the lowest energies.
III.2 Uncertainties
The systematic and statistical uncertainties from these measurements are summarized in Table 4. The energy loss of the proton beam in the Pd layer was calculated with SRIM 2003 Ziegler and Biersack (2003) using the optional tables for range and stopping power. The samples thickness of typically 460 nm corresponds to an average energy loss between 30 keV at 2.5 MeV and 15 keV at 9 MeV proton energy. The respective uncertainty of the proton energy is 25 keV for the cyclotron and 3 keV for the Van de Graaff. As shown in Eq. 1 the error bars of are asymmetric, with the smaller component in positive direction. The uncertainty in the collection of the proton beam current was determined to be 1%.
| Source of uncertainty | 102Pd() | 104Pd() | 104Pd() | 105Pd() | 105Pd() | 106Pd() | 110Pd() |
|---|---|---|---|---|---|---|---|
| Ag | Agg | 105Ag | Agm | Ag | Agm | 110Agm | |
| Isotopic abundance | 0.98 | 0.72 (0.10) | 0.36 (0.05) | 0.11 | 0.77 | ||
| Detector efficiency | 2.0 | ||||||
| Beam current integration | 1.0 | ||||||
| Sample mass (XRF) | 1.5 | ||||||
| -ray intensity | 1.8–5.9 | 3.2–4.3 | 1.5–9.5 | 2.5–3.4 | 1.5–9.5 | 2.5–3.4 | 0.3–1.8 |
| Statistical error | 2.5–15 | 0.3–0.6 | 0.2–7.7 | 3.0–19 | 0.2–3.6 | 3.0–12 | 0.7–14 |
| Total uncertainty | 4.1–16 | 4.8–5.1 | 3.0–13 | 4.7–19 | 3.0–11.0 | 4.7–13 | 2.7–14 |
The emission probabilities of the transitions in the decay of 104Agg exhibit rather large uncertainties (see Table 3). Some of these uncertainties could be reduced by factors of 3 by normalization to the strongest transition at 767.6 keV. The previous and improved intensities are compared in Table 5
| γ (keV) | Blachot (2007) | (new) |
|---|---|---|
| 740.5 | 7.2 (9) | 7.19 (31) |
| 758.7 | 6.4 (8) | 6.62 (26) |
| 767.6 | 65.7 (21) | 65.7 (21) |
| 942.6 | 25.0 (23) | 23.69 (83) |
| 1625.8 | 5.1 (7) | 5.25 (19) |
At the lower part of the investigated energy range the total uncertainties are dominated by the poor counting statistics, except for cases with a favorable half-life, which could be counted for longer times (e.g. 105Ag). The systematic uncertainties are composed of the contributions from the detection efficiencies (2%), the XRF measurement of the sample mass (1.5%), the integrated proton charge (1%), the -ray intensities (Table 3), and the isotopic abundances (Table 2) De Laeter et al. (2003).
IV Results
In the following, we present our results for each of the reactions individually and compare them to literature data and to published predictions of the NON-SMOKER code Rauscher and Thielemann (2000, 2001). As already explained in Sec. I, and reactions and their inverses are directly important in the process. However, they occur at lower reaction energies than were accessible experimentally. Nevertheless, the data may be compared to theoretical predictions to pinpoint possible systematic problems in the predictions or their input data which also may play a role at lower energy. In this respect, and reactions contribute different types of information for the treatment of the optical potentials and strengths. On one hand, the () reactions are most sensitive to the proton strength functions, and thus to the proton optical potential, across almost the total range of measured energies, provided that the averaged neutron widths are dominating the total reaction width. This is the case for energies well above the threshold. A few hundreds of keV above the threshold, neutron widths may be comparable to and proton widths and the cross section will be sensitive to variations in either of them. On the other hand, depending on the target nucleus, proton capture is more sensitive to the strengths at higher energies whereas it has a higher sensitivity to the proton optical potential at low energies, where the averaged proton widths become smaller than the averaged widths. Therefore, an interpretation of possible deviations of theory from experiment has to consider the relative importance of the different nuclear properties at each energy.
The total cross sections for 102Pd()103Ag, 104Pd105Ag, and 105Pd()105Ag have been measured in the proton energy range between 2.75 and 9.00 MeV. These results could be complemented by the partial cross sections for 104Pd()104Agg, 105Pd()106Agm, 106Pd()106Agm, and 110Pd()110Agm.
IV.1 102Pd()103Ag
The total proton capture cross section of 102Pd was determined via the five transitions at 118.7, 148.2, 243.9, 266.9, and 1273.8 keV. The half-life of 103Ag was also checked and yielded 68.2 2.4 min, slightly longer than but still consistent with the 65.7 0.7 min given in de Frenne and Jacobs (2001). The cross sections (derived as weighted averages from all five transitions) are listed in Table 6 together with the respective factors.
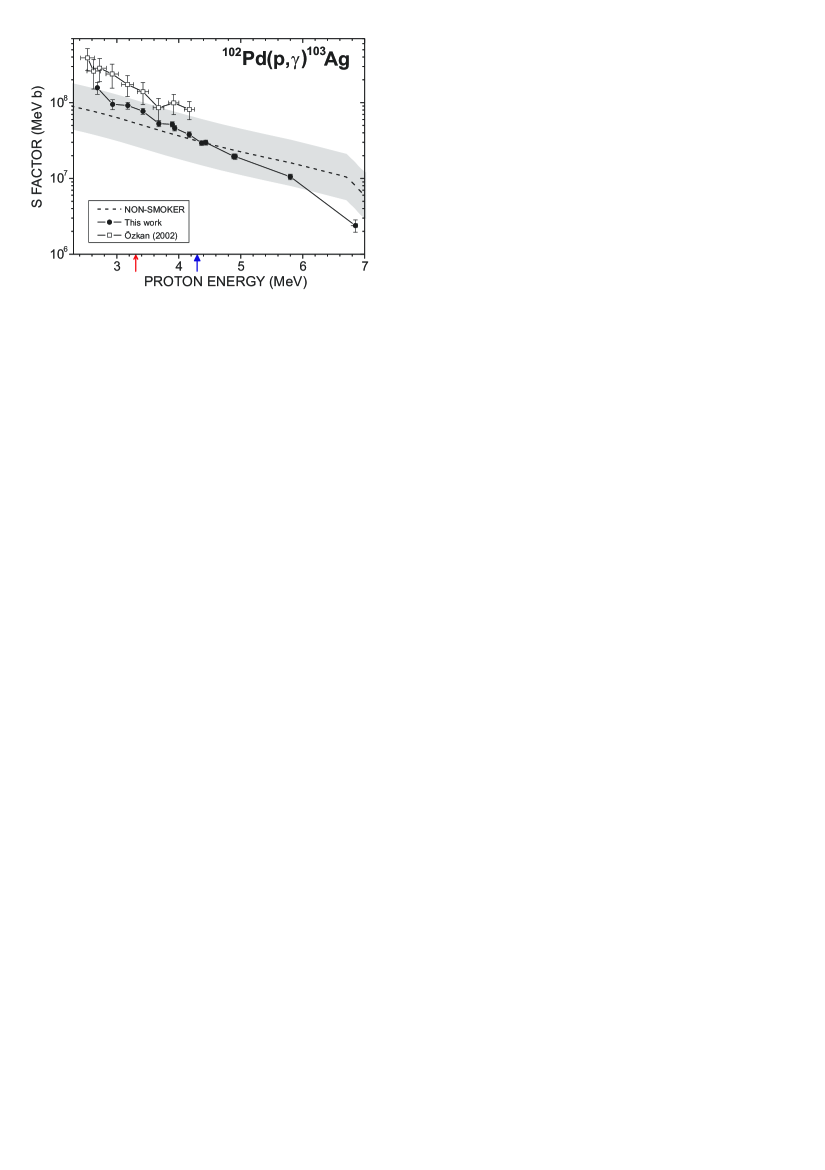
The present results are compared in Fig. 4 with the previous data of Özkan et al. Özkan et al. (2002) and with NON-SMOKER predictions Rauscher and Thielemann (2000, 2001). The typical factor-of-two uncertainty of this prediction for proton-capture reactions is indicated by the gray band. Within these limits there is rather good agreement with this measurement although the NON-SMOKER values show a somewhat different energy dependence.
The present result are about a factor of three lower than the experimental data of Özkan et al. Özkan et al. (2002). These authors used enriched 102Pd samples with an area density of 2 mg/cm2, three times thicker than in this work. This explains the larger energy spread of the data points (60-90 keV) but does not explain the discrepancy between both measurements.
We have to distinguish three different regions in the energy range studied here. At the lower end up to an energy of about 4.5 MeV the cross section predictions are mostly sensitive to the predicted averaged proton width. Above that energy, the proton width becomes larger than the width and consequently the sensitivity to the latter dominates. The data point at the highest energy is closely above the threshold and the neutron width will have an additional impact there. It can be seen that the energy dependence of the cross section is slightly different in the three different regimes (this is more pronounced in the data) because it is given by the energy dependence of different nuclear properties. Since the proton widths are most important at -process energies, we focus on the lowest energies. The data is higher than the prediction at these energies but it is difficult to identify a trend because of the increasing impact of the width towards higher energy. The experimental results lie within the expected theoretical uncertainty of a factor of two and are compatible with the assumption that the theoretical proton widths just have to be scaled by a constant factor.
| Cross section | factor | |
|---|---|---|
| (MeV) | (mbarn) | (107 MeV b) |
| 2.685 | 0.0580.010 | 15.72.8 |
| 2.932 | 0.1050.016 | 9.501.4 |
| 3.178 | 0.2660.028 | 9.160.95 |
| 3.422 | 0.5220.046 | 7.690.68 |
| 3.679 | 0.7970.070 | 5.290.47 |
| 3.894 | 1.430.11 | 5.190.41 |
| 3.934 | 1.420.12 | 4.620.37 |
| 4.169 | 2.120.18 | 3.800.32 |
| 4.369 | 2.600.18 | 2.930.20 |
| 4.435 | 3.060.23 | 2.980.22 |
| 4.889 | 5.080.38 | 1.960.15 |
| 4.912 | 5.260.43 | 1.940.16 |
| 5.800 | 12.31.0 | 1.050.09 |
| 6.851 | 10.62.0 | 0.240.04 |
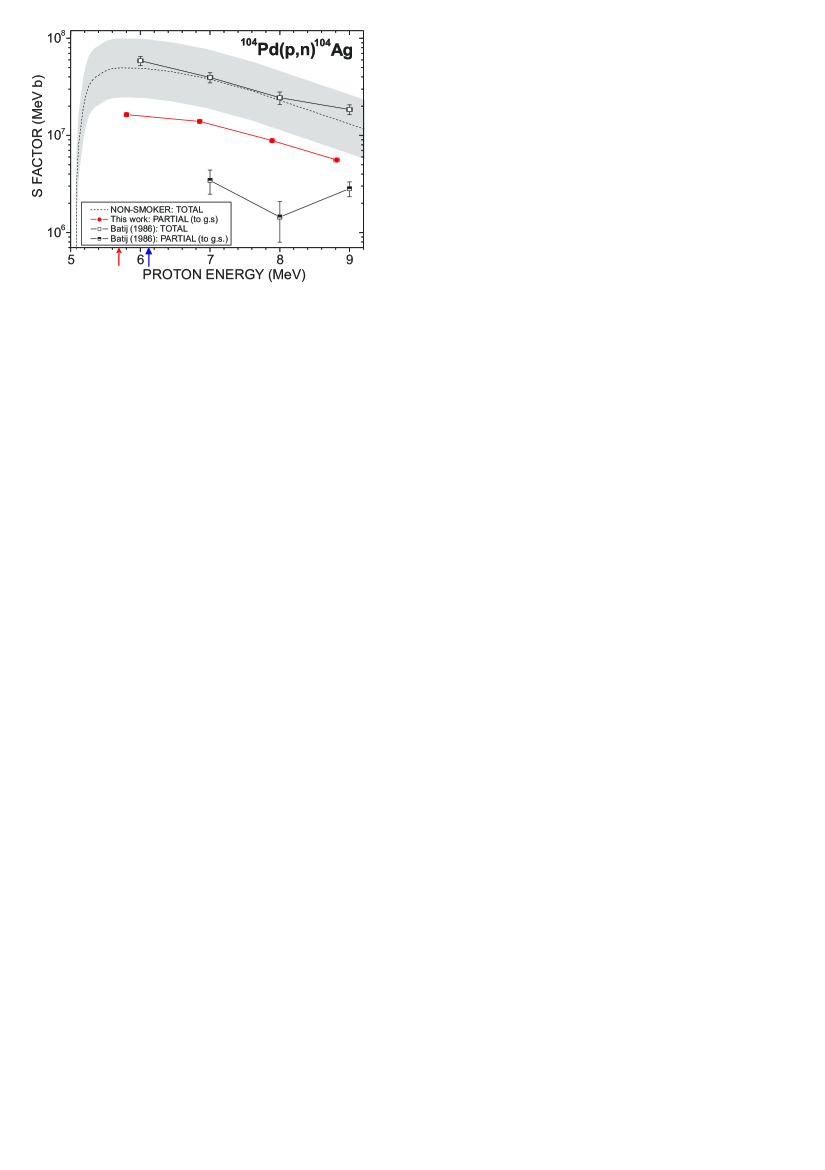
IV.2 104Pd()104Agg
The 104Pd()104Ag reaction channel opens at = 5.11 MeV. The 5+ ground state (= 69.2 min) and the 2+ isomeric state (= 33.5 min) of 104Ag are decaying both via decay and electron capture (EC) and are not directly connected by internal decay. The shorter half-life of the isomer made it difficult to derive the isomeric cross section. Therefore, only the cross section to the ground-state was determined after an appropriate waiting time. To avoid interferences, the analysis was limited to those transitions, where feeding from the isomer is excluded or negligibly weak, i.e. the lines at 740.5, 758.7, 767.6, 942.6, and 1625.8 keV. The weighted cross sections and the factors are summarized in Table 7.
The comparison in Fig. 5 shows significant discrepancies with the partial cross sections reported by Batij et al. Batij et al. (1986). Since NON-SMOKER results are not available for the partial cross section, the total cross section is plotted instead. In spite of the puzzling partial cross sections, the total cross sections of Ref. Batij et al. (1986) are in good agreement with the theoretical result, confirming the averaged proton widths obtained by using the optical potential of Lejeune (1980) for this energy range. The present (partial) cross section exhibits the same trend as the NON-SMOKER curve.
Following the EXFOR database Experimental Nuclear Reaction Data EXFOR (2009), the data from Bitao et al. Bitao et al. (1998) is listed as the ratio of isomeric to ground state cross section, . These ratios were deduced via the transitions at 556, 768, and 1239 keV occurring in the decay of the isomer as well as of the ground state. Using our experimental data and the total cross section from Ref. Batij et al. (1986), we also deduced the ratio , yielding values between 3.7 for 5.802 MeV and 2.8 for 8.815 MeV, in clear disagreement with the values of =0.0310.132 for energies between 6.31 and 8.99 MeV given in Bitao et al. (1998). Unfortunately, these authors do not give any information on how their ratios were calculated nor on the cross section data used.
| Cross section | factor | |
|---|---|---|
| (MeV) | (mbarn) | (107 MeV b) |
| 5.802 | 19.21.0 | 1.640.08 |
| 6.852 | 62.13.0 | 1.400.07 |
| 7.892 | 111.35.4 | 0.880.04 |
| 8.815 | 149.97.4 | 0.560.03 |
IV.3 104Pd()105Ag and 105Pd()105Ag
IV.3.1 Cross sections measured with natural samples
Because the 104Pd()105Ag and 105Pd()105Ag reactions are leading to the same product nucleus, only the sum of the two cross sections can be determined above the () threshold at 2.15 MeV. This composite cross section
| (4) |
was determined using the transitions at 64.0, 280.4, 344.5, and 443.4 keV. The 7.23 min isomer in 105Ag could not be resolved due to its short half-life, but this state decays by 99.66% via internal transitions. Therefore, the 0.34% electron capture branch has a negligible effect on the total cross section. The results are shown in Table 8.
| Measured data (104Pd() + 105Pd()) | ||
|---|---|---|
| factor | ||
| (MeV) | (mbarn) | (108 MeV b) |
| 2.687 | 0.0730.005 | 1.960.14 |
| 2.933 | 0.1850.013 | 1.670.12 |
| 3.178 | 0.470.03 | 1.610.11 |
| 3.424 | 0.920.07 | 1.350.10 |
| 3.444 | 1.110.08 | 1.520.12 |
| 3.679 | 1.960.14 | 1.300.09 |
| 3.894 | 3.690.24 | 1.340.09 |
| 3.934 | 3.820.27 | 1.240.09 |
| 4.170 | 6.470.43 | 1.160.08 |
| 4.436 | 8.490.60 | 0.950.07 |
| 4.890 | 20.51.5 | 0.790.06 |
| 4.912 | 21.61.6 | 0.800.06 |
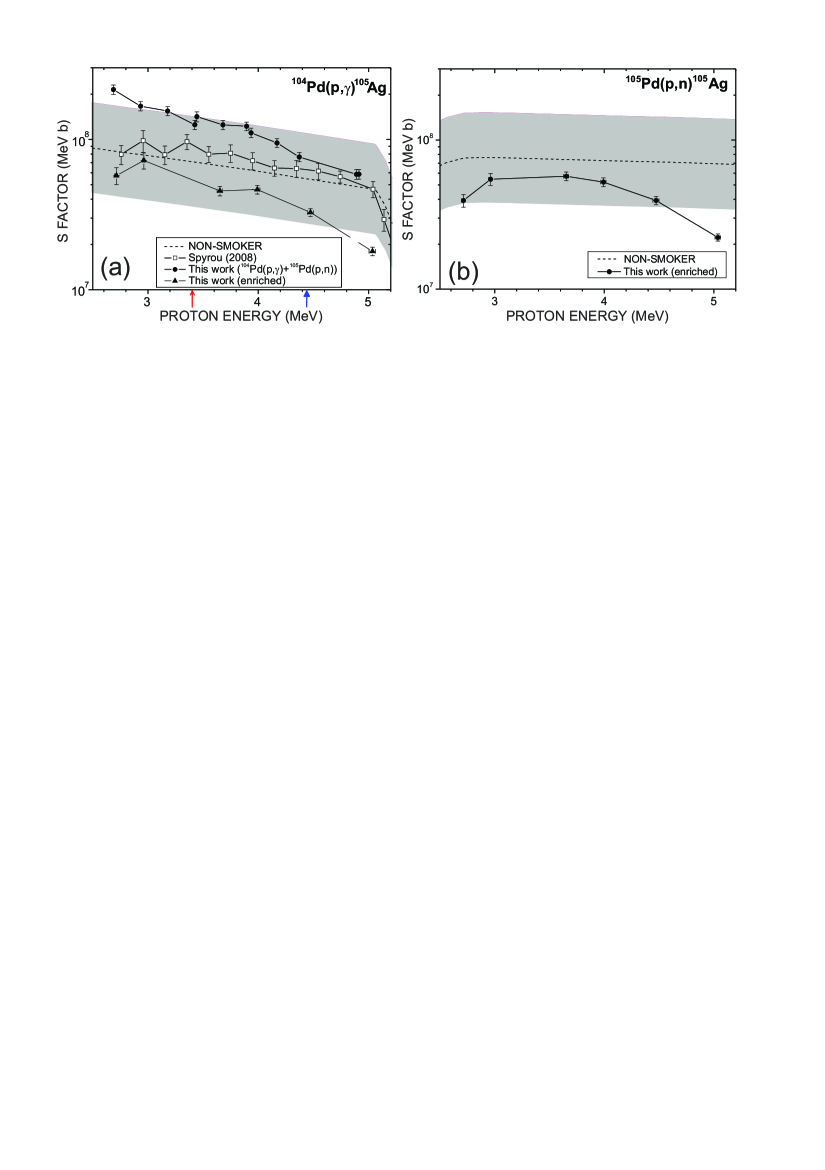
IV.3.2 104Pd()105Ag measured with enriched samples
The total 104Pd()105Ag cross section was measured additionally with enriched 104Pd samples (Table 9). In Fig. 6 our results are compared to the values of Ref. Spyrou et al. (2008) which are in very good agreement with the NON-SMOKER predictions. Our results are slightly lower, but follow the theoretical and experimental energy trend and – with exception of the highest data point– reproduce the theoretical values within the factor of two error band.
| Cross section | factor | |
|---|---|---|
| (MeV) | (mbarn) | (107 MeV b) |
| 2.714 | 0.0240.003 | 5.750.74 |
| 2.963 | 0.0910.011 | 7.240.89 |
| 3.653 | 0.6340.047 | 4.540.34 |
| 3.991 | 1.6540.124 | 4.640.32 |
| 4.473 | 3.6400.214 | 3.270.19 |
| 5.035 | 6.1040.394 | 1.800.12 |
IV.3.3 105Pd()105Ag measured with enriched samples
The 105Pd()105Ag reaction channel opens at 2.15 MeV. The total cross section could also be measured from enriched 105Pd samples via the above mentioned transitions (Table 10). Fig. 6 shows these results, which are again slightly lower than the NON-SMOKER prediction. With exception of the highest data point our results can reproduce the theoretical values within the factor of two region of uncertainty. Unfortunately there is no other data available for comparison.
| Cross section | factor | |
|---|---|---|
| (MeV) | (mbarn) | (107 MeV b) |
| 2.714 | 0.0170.002 | 3.930.38 |
| 2.961 | 0.0680.006 | 5.470.50 |
| 3.651 | 0.7940.052 | 5.720.37 |
| 3.991 | 1.8610.122 | 5.220.34 |
| 4.473 | 4.3830.279 | 3.930.25 |
| 5.038 | 7.5710.410 | 2.220.12 |
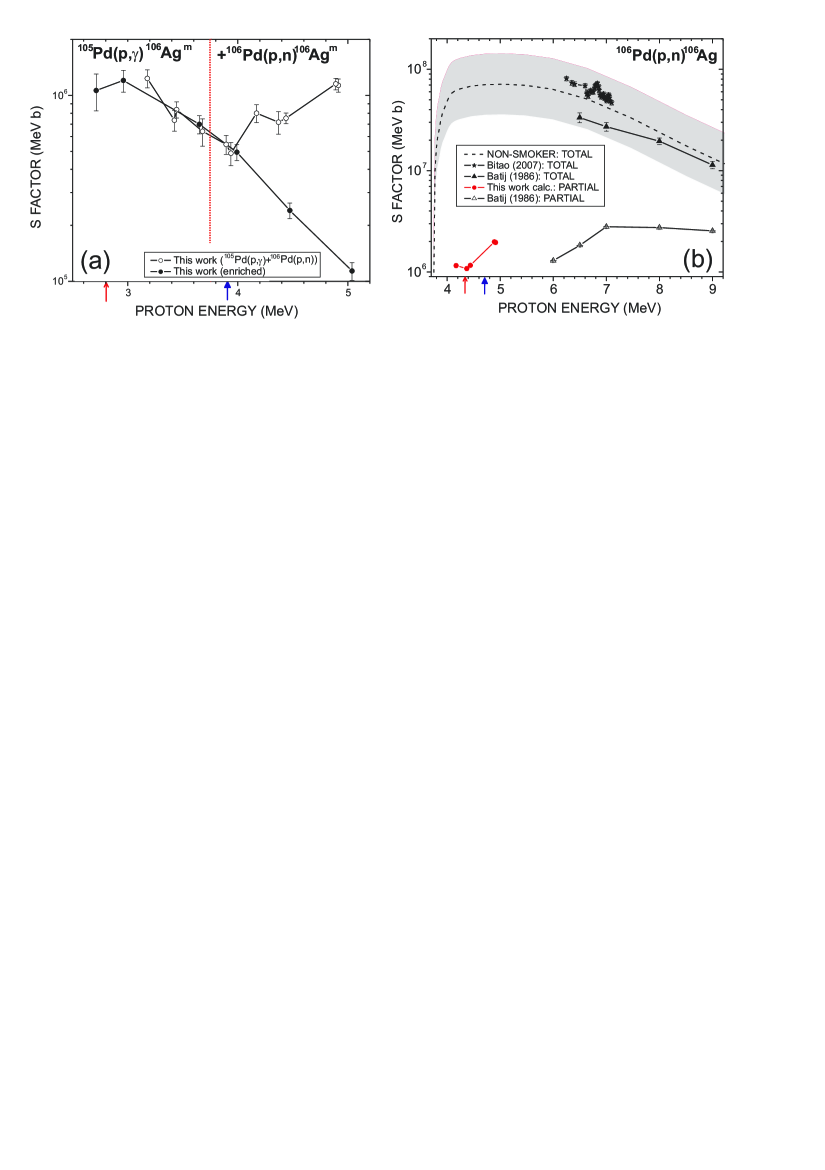
IV.4 105Pd()106Agm and 106Pd()106Agm
The partial cross section to the ground state in 106Ag was not accessible by the activations because of its short half-life of 23.96 min. The EC decay of the 6+ isomeric state with d to 106Pd could be followed via the transitions at 451.0, 717.2, 748.4, and 1045.8 keV. Measurements have been performed with natural and with enriched samples (Table 2).
IV.4.1 Cross sections measured with natural samples
Above the threshold of the 106Pd() reaction at 3.78 MeV the measured cross section represents the composite of the partial cross sections for 105Pd()106Agm and 106Pd()106Agm, similar to the previous case. The results are listed in Table 11 and shown in Fig. 7.
| Measured data (105Pd()+106Pd()) | ||
| factor | ||
| (MeV) | (barn) | (106 MeV b) |
| 3.178 | 3.60.4 | 1.2330.138 |
| 3.424 | 5.00.6 | 0.7350.093 |
| 3.444 | 6.10.6 | 0.8380.084 |
| 3.679 | 9.61.6 | 0.6400.107 |
| 3.894 | 15.01.8 | 0.5460.064 |
| 3.937 | 15.12.1 | 0.4880.069 |
| 4.170 | 44.64.9 | 0.8020.088 |
| 4.370 | 63.68.8 | 0.7180.100 |
| 4.438 | 77.85.2 | 0.7530.050 |
| 4.890 | 29922 | 1.1520.083 |
| 4.913 | 30725 | 1.1330.092 |
IV.4.2 105Pd()106Agm measured with enriched samples
The 105Pd()106Agm cross section was also measured with enriched 105Pd samples between =2.7 and 5.0 MeV. The resulting factor (Table 12) is shown in Fig. 7 and agrees well with the data from the natural samples below the 106Pd() threshold.
The results obtained with the enriched samples could be used to decompose the cross section data in Table 11 to derive the cross section for the competing 106Pd()106Agm channel (Table 13). Our deduced results are compared in Fig. 7 with experimental data of Batij et al. Batij et al. (1986), which are reported at slightly higher energies. The results of Ref. Batij et al. (1986) for the total cross section are higher than the values of Bitao et al. Bi-Tao et al. (2007).
| Cross section | factor | |
|---|---|---|
| (MeV) | (barn) | (106 MeV b) |
| 2.714 | 0.440.10 | 1.0630.238 |
| 2.961 | 1.500.20 | 1.2020.163 |
| 3.462 | 3.990.65 | 0.5180.084 |
| 3.651 | 9.681.08 | 0.6990.078 |
| 3.991 | 17.61.7 | 0.4950.049 |
| 4.473 | 26.82.6 | 0.2400.023 |
| 5.038 | 38.74.2 | 0.1140.012 |
| Cross section | factor | |
|---|---|---|
| (MeV) | (barn) | (106 MeV b) |
| 4.170 | 63.97.0 | 1.150.13 |
| 4.370 | 95.413.3 | 1.080.15 |
| 4.438 | 1218 | 1.170.08 |
| 4.890 | 51437 | 1.980.14 |
| 4.913 | 52843 | 1.950.16 |
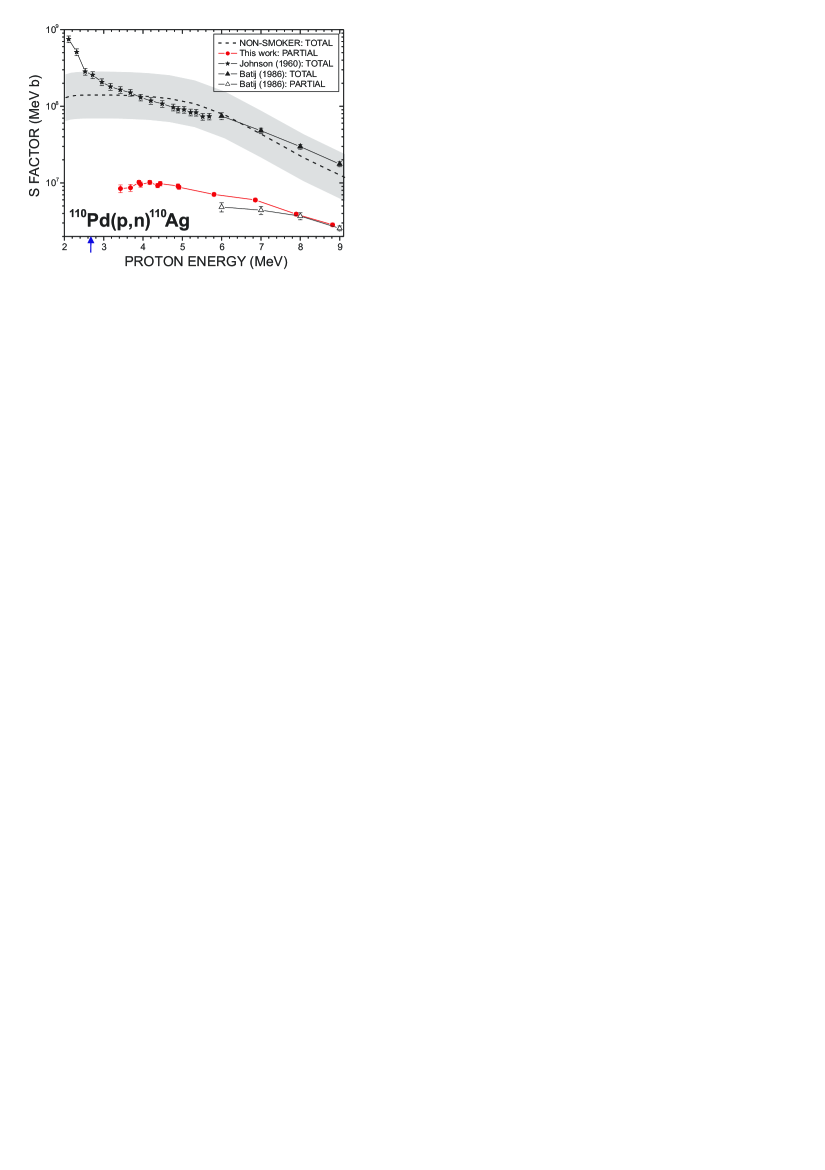
IV.5 110Pd110Agm
Activation of 110Pd provided only the partial () cross section to the isomeric state in 110Ag, which was measured via the -lines at 657.8, 763.9, 884.7 and 937.5 keV in the decay of 110Agm. The ground state of 110Ag is too short-lived for the technique used in this work ( s), and the NON-SMOKER calculation for the competing 110Pd() channel predicts a 1000 times lower cross section. Moreover, such events are difficult to detect because the strongest transition at 342.1 keV interferes with the strong 344.5 keV transition in 105Ag (=41.29 d).
The results for the cross section and the factor are summarized in Table 14. The comparison in Fig. 8 shows fair agreement (within ) with the measurement of Batij et al. Batij et al. (1986) between 6 and 9 MeV. The total data of Batij et al. Batij et al. (1986) and Johnson et al. Johnson et al. (1960) are included for illustrating the measured energy trends with respect to the NON-SMOKER prediction. While the present results for the partial data follow the predicted slope, the total factor of Johnson et al. exhibit increasing deviations toward lower energies.
| Cross section | factor | |
|---|---|---|
| (MeV) | (mbarn) | (106 MeV b) |
| 3.426 | 0.0580.007 | 8.450.98 |
| 3.682 | 0.1310.014 | 8.660.93 |
| 3.898 | 0.2820.016 | 10.20.58 |
| 3.937 | 0.2930.023 | 9.530.75 |
| 4.172 | 0.5660.035 | 10.20.63 |
| 4.372 | 0.8190.052 | 9.230.59 |
| 4.439 | 1.010.07 | 9.770.67 |
| 4.892 | 2.360.14 | 9.100.55 |
| 4.916 | 2.380.13 | 8.770.50 |
| 5.805 | 8.290.38 | 7.080.33 |
| 6.856 | 26.71.2 | 5.990.26 |
| 7.896 | 49.12.1 | 3.900.17 |
| 8.820 | 76.22.7 | 2.840.10 |
V Summary
Extensive investigations of proton-induced reactions on Pd isotopes have been performed by means of the activation technique. The proton energy range between 2.7 and 8.8 MeV was chosen to cover relevant parts of the Gamow windows of the process. Total cross sections are reported for 102Pd()103Ag, 104Pd()105Ag, and 105Pd()105Ag. In addition, partial cross sections were determined for the reactions 104Pd()104Agg, 105Pd106Agm, 106Pd()106Agm, and 110Pd()110Agm. Compared to previous experimental data the present results for 102Pd)103Ag are three times lower than reported by Özkan et al. Özkan et al. (2002), whereas fair agreement was found with the 104Pd(105Ag data of Spyrou et al. Spyrou et al. (2008). For the partial cross sections measured in this work we find only in the case of 110Pd110Agm a reasonable agreement with measured data of Batij et al. Batij et al. (1986).
With respect to theory, the NON-SMOKER predictions Rauscher and Thielemann (2000, 2001) for 102Pd(), 104Pd, and 105Pd() were confirmed. These results confirm also the overall good agreement of NON-SMOKER calculations for proton-induced reactions of isotopes between 70Ge and 209Bi in the energy range of the Gamow window of the process. From the 34 measured reactions so far, only 98Ru, 114,116,119Sn, and 115In do not agree with NON-SMOKER within the factor of two uncertainty. In the cases of 98Ru and 115In this seems to be solely due to experimental problems. For reactions many more data are available within the Gamow window (datasets for 80 isotopes). A systematic comparison has not yet been carried out, but will be done in the -process database of the ”Karlsruhe Astrophysical Database of Nucleosynthesis in Stars” project Szücs et al. (2011).
The new reaction code SMARAGD Rauscher (2011) will be used for future predictions of astrophysical reaction rates. For the reactions investigated here, the predictions of the current version SMARAGD v0.8.1s with standard settings are identical to the shown NON-SMOKER results.
Acknowledgements.
We thank the operating team O. Döhr, H. Eggestein, T. Heldt, and M. Hoffmann for providing excellent beams at the PTB accelerators and W. Mannhardt for providing a second HPGe at the PTB. I.D. acknowledges the help of M. Guttmann (Institut für Materialforschung, IMF) und A. Görtzen (Institut für Nukleare Entsorgung, INE), both from Forschungszentrum Karlsruhe (now Karlsruhe Institute of Technology, KIT), with an electrolytic cell. I.D. is funded by the Helmholtz association via the Young Investigators project VH-NG-627. This work was partially supported by the Swiss National Science Foundation (grant 2000-113984/1). TR is supported by the European Commission within the FP7 ENSAR/THEXO project.References
- Burbidge et al. (1957) E. Burbidge, G. Burbidge, W. Fowler, and F. Hoyle, Rev. Mod. Phys. 29, 547 (1957).
- Langanke and Wiescher (2001) K. Langanke and M. Wiescher, Rep. Prog. Phys. 64, 1657 (2001).
- Woosley and Howard (1978) S. Woosley and W. Howard, Astrophys. J. Suppl. 36, 285 (1978).
- Woosley and Howard (1990) S. Woosley and W. Howard, Astrophys. J. 354, L21 (1990).
- Rayet et al. (1995) M. Rayet, M. Arnould, M. Hashimoto, N. Prantzos, and K. Nomoto, Astron. Astrophys. 298, 517 (1995).
- Rauscher et al. (2002) T. Rauscher, A. Heger, R. Hoffman, and S. Woosley, Astrophys. J. 576, 323 (2002).
- Woosley et al. (1990) S. Woosley, D. Hartmann, R. Hoffman, and W. Haxton, Astrophys. J. 356, 272 (1990).
- Heger et al. (2005) A. Heger, E. Kolbe, W. C. Haxton, K. Langanke, G. Martínez-Pinedo, and S. E. Woosley, Phys. Lett. B 606, 258 (2005).
- Rayet et al. (1990) M. Rayet, N. Prantzos, and M. Arnould, Astron. Astrophys. 227, 271 (1990).
- Rauscher et al. (1995) T. Rauscher, F.-K. Thielemann, and H. Oberhummer, Astrophys. J. 451, L37 (1995).
- Howard et al. (1991) W. Howard, B. Meyer, and S. Woosley, Astrophys. J. 373, L5 (1991).
- Goriely et al. (2002) S. Goriely, J. José, M. Hernanz, M. Rayet, and M. Arnould, Astron. Astrophys. 383, L27 (2002).
- Schatz et al. (1998) H. Schatz, A. Aprahamian, J. Görres, M. Wiescher, T. Rauscher, J. Rembges, F.-K. Thielemann, B. Pfeiffer, P. Möller, H. Herndl, et al., Phys. Rep. 294, 167 (1998).
- Schatz et al. (2001) H. Schatz, A. Aprahamian, V. Barnard, L. Bildsten, A. Cumming, M. Ouellette, T. Rauscher, F.-K. Thielemann, and M. Wiescher, Phys. Rev. Lett. 86, 3471 (2001).
- Fröhlich et al. (2006) C. Fröhlich, G. Martínez-Pinedo, M. Liebendörfer, F.-K. Thielemann, E. Bravo, W. R. Hix, K. Langanke, and N. T. Zinner, Phys. Rev. Lett. 96, 142502 (2006).
- Dauphas et al. (2003) N. Dauphas, T. Rauscher, B. Marty, and L. Reisberg, Nucl. Phys. A719, 287c (2003).
- Rauscher (2010) T. Rauscher, Phys. Rev. C 81, 045807 (2010).
- Rauscher (2006) T. Rauscher, Phys. Rev. C 73, 015804 (2006).
- Kiss et al. (2008) G. G. Kiss, T. Rauscher, G. Gyürky, A. Simon, Z. Fülöp, and E. Somorjai, Phys. Rev. Lett. 101, 191101 (2008).
- Rauscher et al. (2009) T. Rauscher, G. G. Kiss, G. Gyürky, A. Simon, Z. Fülöp, and E. Somorjai, Phys. Rev. C 80, 035801 (2009).
- Iliadis (2007) C. Iliadis, Nuclear Physics of Stars (Wiley-VCH Verlag GmbH & Co. KGaA, Weinheim/ Germany, 2007).
- Utsunomiya et al. (2006) H. Utsunomiya, P. Mohr, A. Zilges, and M. Rayet, Nucl. Phys. A777, 459 (2006).
- Rapp et al. (2006) W. Rapp, J. Görres, M. Wiescher, H. Schatz, and F. Käppeler, Ap. J. 653, 474 (2006).
- Brede et al. (1980) H. J. Brede, M. Cosack, G. Dietze, H. Gumpert, S. Guldbakke, R. Jahr, M. Kutscha, D. Schlegel-Bickmann, and H. Schölermann, Nucl. Instr. Meth. 169, 349 (1980).
- Trautmann and Folger (1989) N. Trautmann and H. Folger, Nucl. Instr. Meth. A 282, 102 (1989).
- De Laeter et al. (2003) J. De Laeter, J. Böhlke, P. de Bievre, H. Hidaka, H. Peiser, K. Rosman, and P. Taylor, Pure and Appl. Chem. 75, 683 (2003).
- Böttger (2002) R. Böttger, private communication (2002).
- Ziegler and Biersack (2003) J. Ziegler and J. Biersack, ”The stopping and range of ions in matter”, SRIM-2003.26, http://www.srim.com (2003).
- Beer and Käppeler (1980) H. Beer and F. Käppeler, Phys. Rev. C 21, 534 (1980).
- de Frenne and Jacobs (2001) D. de Frenne and E. Jacobs, Nucl. Data Sheets 93, 447 (2001).
- Blachot (2007) J. Blachot, Nucl. Data Sheets 108, 2035 (2007).
- de Frenne and Jacobs (2005) D. de Frenne and E. Jacobs, Nucl. Data Sheets 105, 775 (2005).
- de Frenne and Negret (2008) D. de Frenne and A. Negret, Nucl. Data Sheets 109, 943 (2008).
- de Frenne and Jacobs (2000) D. de Frenne and E. Jacobs, Nucl. Data Sheets 89, 481 (2000).
- Debertin and Helmer (1989) K. Debertin and R. Helmer, Gamma- and X-Ray Spectrometry With Semiconductor Detectors (North Holland, ISBN 0444871071, 1989).
- Rauscher and Thielemann (2000) T. Rauscher and F.-K. Thielemann, At. Data Nucl. Data Tables 75, 1 (2000).
- Rauscher and Thielemann (2001) T. Rauscher and F.-K. Thielemann, At. Data Nucl. Data Tables 79, 47 (2001).
- Özkan et al. (2002) N. Özkan, A. Murphy, R. Boyd, A. Cole, M. Famiano, R. Güray, M. Howard, L. Sahin, J. Zach, R. deHaan, et al., Nucl. Phys. A 710, 469 (2002).
- Batij et al. (1986) V. Batij, E. Skakun, J. Rakivnenko, and O. Rastrepin, Proc. 36th Conference on Nucl. Spectr. and Nucl. Struc., Kharkov, USSR p. 280 (1986).
- Lejeune (1980) A. Lejeune, Phys. Rev. C 21, 1107 (1980).
- Experimental Nuclear Reaction Data EXFOR (2009) Experimental Nuclear Reaction Data EXFOR, Online: http://www-nds.iaea.org/exfor/exfor.htm (2009).
- Bitao et al. (1998) H. Bitao, P. Zarubin, and U. Juralev, Eur. Phys. J. A 2, 143 (1998).
- Spyrou et al. (2008) A. Spyrou, A. Lagoyannis, P. Demetriou, S. Harissopulos, and H. Becker, Phys. Rev. C 77, 065801 (2008).
- Bi-Tao et al. (2007) H. Bi-Tao, P. Zarubin, and U. Juralev, Chinese Physics 16, 989 (2007).
- Johnson et al. (1960) C. Johnson, A. Galonsky, and C. Inskeep, Oak Ridge National Laboratory Reports ORNL-2910 p. 25 (1960).
- Szücs et al. (2011) T. Szücs, I. Dillmann, R. Plag, and Z. Fülöp, 11th Symposium on Nuclei in the Cosmos, Proceedings of Science, PoS(NIC XI)247 (2011); Online: www.kadonis.org.
- Rauscher (2011) T. Rauscher, Int. J. Mod. Phys. E 20, 1071 (2011).