Gas Giant Formation with Small Cores Triggered by Envelope Pollution by Icy Planetesimals
Abstract
We have investigated how envelope pollution by icy planetesimals affects the critical core mass for gas giant formation and the gas accretion time-scales. In the core-accretion model, runaway gas accretion is triggered after a core reaches a critical core mass. All the previous studies on the core-accretion model assumed that the envelope has the solar composition uniformly. In fact, the envelope is likely polluted by evaporated materials of icy planetesimals because icy planetesimals going through the envelope experience mass loss via strong ablation and most of their masses are deposited in the deep envelope. In this paper, we have demonstrated that envelope pollution in general lowers the critical core masses and hastens gas accretion on to the protoplanet because of the increase in the molecular weight and reduction of adiabatic temperature gradient. Widely- and highly-polluted envelopes allow smaller cores to form massive envelopes before disc dissipation. Our results suggest that envelope pollution in the course of planetary accretion has the potential to trigger gas giant formation with small cores. We propose that it is necessary to take into account envelope pollution by icy planetesimals when we discuss gas giant formation based on the core-accretion model.
keywords:
accretion, accretion discs – planets and satellites: formation.1 Introduction
More than 540 exoplanets have been discovered so far111http://www.exoplanet.eu. Dedicated planet surveys have revealed the diversity of giant planets outside the Solar System. Many Sun-like stars are known to harbor close-in giant planets called hot-Jupiters, in contrast to our Sun. Recently, direct imaging has shed light on the existence of distant extrasolar giant planets such as HR8799b, c, d, e (Marois et al., 2008, 2010), Fomalhaut b (Kalas et al., 2008), and Beta Pic b (Lagrange et al., 2009). A large number of exoplanets enable us to consider planet formation around various types of star through a statistical approach, which is often called population synthesis. In the population synthesis, planetary systems are built by putting together pieces of formation processes (e.g., solid and gas accretion, planetary migration and so on) in a Monte-Carlo way. Nowadays several groups have worked on the population synthesis independently (e.g. Ida & Lin, 2008; Alibert, Mordasini, & Benz, 2011; Kennedy & Kenyon, 2008; Miguel, Guilera, & Brunini, 2011). Those population-synthesis studies succeed in reproducing the planetary mass-period distribution of detected extrasolar giant planets. This indicates that our basic picture of planetary formation is supported by observed exoplanets. On the other hand, it is also true that different population syntheses based on different assumptions as to planetary accretion and disc properties reproduce the same observed distribution. This highlights the need to understand underlying formation processes of giant planets more exactly.
The core-accretion model is one of the promising models for giant planet formation (e.g. Mizuno, 1980; Bodenheimer & Pollack, 1986; Pollack et al., 1996). In this model, once a core reaches a critical core mass through planetesimal accretion, runaway gas accretion is triggered and the envelope mass increases rapidly. The typical value of the critical core mass is thought of as being (Pollack et al., 1996; Fortier, Benvenuto, & Brunini, 2007, 2009) to form a massive envelope within the disc lifetime suggested by observations (Haisch, Lada, & Lada, 2001; Hernández et al., 2007). This is, however, incompatible with the inferred mass of Jupiter’s core of (Saumon & Guillot, 2004). The critical core mass depends on planetesimal accretion rate and opacities in the envelope (Mizuno, 1980; Ikoma, Nakazawa, & Emori, 2000; Rafikov, 2006). Fast accretion of planetesimals leads to form gas giants with large cores. Although slow rates of planetesimal accretion lead to smaller critical cores of , gas accretion on to small cores tends to be long. Reduction of grain opacities in the envelope can not only lower critical core masses but also hasten gas accretion on to the protoplanet (Ikoma, Nakazawa, & Emori, 2000; Hubickyj, Bodenheimer, & Lissauer, 2005; Papaloizou & Nelson, 2005; Hori & Ikoma, 2010). For example, Hori & Ikoma (2010) showed that core masses needed to form massive envelopes before disc dissipation are as small as in the extreme case of grain-free envelopes. In fact, recent calculations on the dynamical behaviour of dust grains in the accreting envelope demonstrate that grain opacities in the envelope can be reduced to be on average 1% or less of those in the protoplanetary disc (Podolak, 2003; Movshovitz & Podolak, 2008; Movshovitz et al., 2010). The reason is that small grains initially suspended in the outer envelope quickly grow large in size and then settle down into the deep envelope where temperature is high enough so that grains evaporate. Their results support that reduction of grain opacities can be a feasible idea that relaxes the problem of the formation of gas giants with small cores.
Another factor that affects the critical core mass is considered in this paper. All the previous studies assumed that the composition of gas is solar throughout the envelope. In fact, the envelope is likely to be polluted by evaporated materials of icy planetesimals. Once a protoplanet grows up to be Mars-size, it becomes difficult for the protoplanet to capture planetesimals because the protoplanet enhances their random velocities through gravitational scatterings by itself. On the other hand, disruptive collisions between planetesimals with high relative velocities take place frequently and yield a large number of 10 to 100 m-sized fragments unless the planetesimals are larger than 100 km (Inaba, Wetherill, & Ikoma, 2003; Kobayashi et al., 2010). The protoplanet can capture such small-sized fragments because of the enhanced collisional cross-section between the envelope and those fragments due to gas drag (Inaba & Ikoma, 2003; Benvenuto & Brunini, 2008). The fragments going through the envelope experience both melting and evaporation and lose most of their masses in the deep envelope before reaching the core (Pollack et al., 1986; Podolak, Pollack, & Reynolds, 1988). As a result, envelope pollution by evaporated materials of icy planetesimals occurs inevitably in the course of planetary accretion. In addition, evaporation (or erosion) of the core itself is also expected to occur, as pointed out by Lissauer et al. (1995). This fact motivates us to consider giant planet formation taking into account the effects of the heavy-element enrichment in the envelope.
Approximate solutions for the critical core mass analytically derived by previous studies tell that envelope pollution has significant impacts on the critical core mass:
-
(a)
Wholly-radiative envelopes (Stevenson, 1982):
(1) -
(b)
Wholly convective envelopes (Wuchterl, 1993):
(2)
where is the critical core mass, the molecular weight, the Rosseland mean opacity, the planetesimal accretion rate, and the adiabatic exponent. The subscript ”out” means the value at the outer edge of the envelope. The envelope pollution causes increase in and reduction of (or reduction of ). The reduction of comes from dissociations of several kinds of molecules. The two formulae indicate that both effects reduce the critical core mass. This is because those effects lead to reduction of the local pressure gradient that supports the gravity. On the other hand, the envelope pollution also causes rise in gas opacities as a negative effect. The rise in gas opacities, mainly that absorbs infrared radiation, increases the critical core mass by increasing the temperature gradient that results in an increase in the pressure gradient.
In this study, we show that envelope pollution by icy planetesimals lowers critical core masses in most cases and hastens gas accretion on to the protoplanet despite the rise in gas opacities. We present numerical procedures in Section 2, including our modelling for envelope pollution by icy planetesimals. Results of critical core masses and gas accretion time-scales are shown in Section 3 and Section 4, respectively. Discussions and conclusion are in the last two sections.
2 Numerical Procedure
2.1 Structure and Evolution of the Envelope
We suppose a spherically-symmetric protoplanet that consists of a gaseous envelope and a rigid core with a constant density of . The envelope is assumed to be in hydrostatic equilibrium. Its structure is simulated with a set of the following basic equations (e.g. Kippenhahn & Weigert, 1994) that includes the equation of hydrostatic equilibrium,
| (3) |
the equation of mass conservation,
| (4) |
the equation of heat transfer,
| (5) |
and the equation of energy conservation,
| (6) |
where is the mass interior to radius , the pressure, the temperature, the density, the specific entropy, the energy flux crossing at a sphere of radius , , the gravitational constant, the specific energy generation by planetesimal accretion, and the time.
The dominant mechanism of heat transfer is chosen by the Schwartzschild criterion for convective instability:
| (7) |
where is the adiabatic temperature gradient and the radiative temperature gradient given by
| (8) |
where is the velocity of light, the radiation density constant, and the Rosseland mean opacity. Opacities both of dust grains and gas and the equation of state for gaseous components that we use are mentioned in Section 2.2.
The boundary conditions are given at the core surface and the outer edge of the envelope as follows:
| (9) |
and
| (10) |
where and are the core mass and density, respectively, the luminosity at the core surface, the protoplanet’s total mass, and and are the density and temperature of the disc gas, respectively. The total mass of the planet, , is the mass of gas contained inside the outer edge of the envelope, which is defined by the smaller of the Bondi radius () and the Hill radius ():
| (11) |
where is the sound velocity, the semimajor axis of the protoplanet, and the mass of the central star. In this paper, we use , unless otherwise noted.
We assume that the energy release by planetesimals occurs in a narrow region on top of the core (i.e., ). This assumption seems to be incompatible with the situation that planetesimals evaporate and deposit their kinetic energy before reaching the core. However, such simplification affects the results little, because the energy deposition of planetesimals occurs mostly in the deep, convective envelope, the structure of which is insensitive to where energy deposition occurs inside itself. On the other hand, we neglect the effect of sinking of dissolved materials of icy planetesimals in this study. Gravitational potential energy released by sinking of ablated materials makes a contribution to slow down gas accretion on to a proto-gas giant as pointed out by Pollack et al. (1996). Whether the energy release by sinking of ablated materials occurs effectively in a wide region where planetesimals slow down via ablation is important for formation time-scales of gas giants. It will be considered in future calculations based on trajectories of planetesimals through a protoplanet’s envelope.
2.2 Envelope Pollution by Icy Planetesimals
In this study, we consider that the envelope consists of two components, materials of disc gas (component A) and those of icy planetesimals (component B). The chemical compositions of component A and B are assumed to be solar and comet-Halley-like, respectively. The mass fractions of hydrogen, helium, and the others in the solar abundances are , respectively (Lodders, Plame, & Gail, 2009), while those in comet Halley are (Mumma, Weissman, & Stern, 1993).
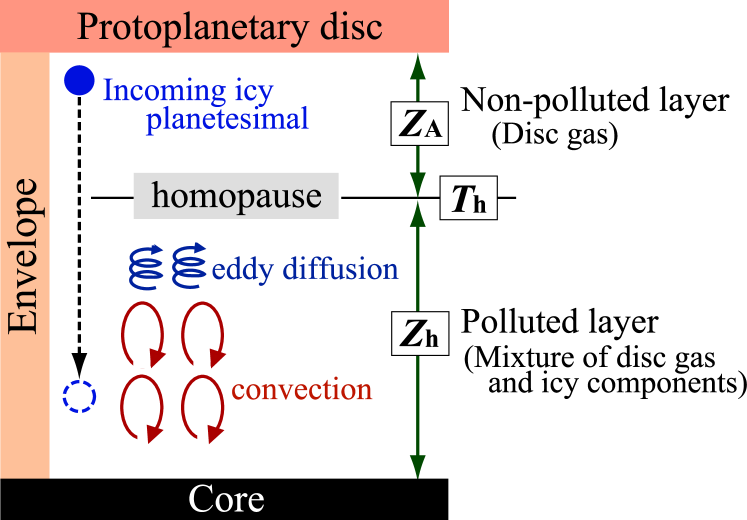
We consider that the envelope has two-layer structure (see Figure 1). The upper layer consists only of component A because disc gas flows into the outer part of the envelope. The lower layer consists of component B in addition to A. The reason is as follows. While going through the envelope, planetesimals experience mass loss via strong ablation. Most of their masses are deposited in the deep envelope (Pollack et al., 1986; Podolak, Pollack, & Reynolds, 1988). In the lower envelope, convection occurs because of molecular dissociation and high gas opacity due to the bound-free absorption of hydrogen. The evaporated materials are thus stirred effectively by convection, so that the chemical composition becomes uniform in the lower layer of the envelope. Such a boundary between convective and radiative regions (i.e., ”tropopause”) corresponds typically to a temperature of .
However, the boundary is likely to be above the tropopause. Even in radiative regions, eddy diffusion carries the evaporated materials of icy planetesimals upward like in the homosphere extending above the tropopause on the present Earth (e.g. Chamberlain & Hunten, 1987). Also, pollution occurs even in the upper envelope because the temperature there is enough to evaporate ice. While only a small fraction of the mass of planetesimals evaporates in the upper envelope (Podolak, Pollack, & Reynolds, 1988), the envelope is itself tenuous in such a region, so that the upper envelope can be also enriched in heavy elements. Thus, we regard the boundary between the two layers as a free parameter in this study. To do so, we introduce ”homopause temperature”, ; the values of that we use in this study are .
Thermodynamic quantities of the envelope gas are calculated under the assumption of chemical equilibrium. Although chemical equilibrium may not be achieved in the region of low temperature because chemical reactions proceed slowly, this problem is beyond the scope of this paper. The following 13 constituents are considered, namely, , , , , , , , , , , , , and . Thermodynamic quantities are calculated from the thermodynamic potentials. The relevant physical quantities are given in NIST-JANAF thermochemical tables (Chase, 1998; Ott & Boerio-Goates, 2000).
We determine the mass fractions of carbon () and oxygen () in the lower envelope in such a manner that the sum of the two fractions is equal to and the ratio is conserved:
| (12) |
where is the mixing ratio of component B. The mass fractions of hydrogen and helium in the mixture are described by as well:
| (13) |
The ratio of to is , while that of to is . In this study, we deal with , which is equivalent to , as a free parameter for simplicity because the actual value of depends on various processes such as ablation efficiency of icy planetesimals and their entry velocities and should be determined in a complicated manner.
The gas opacity is derived from opacity tables with different values of and given by J. Ferguson (Alexander & Ferguson, 1994). Their calculations include other heavy elements besides . All the elements except and are assumed to be in the solar abundances. This is reasonable because the abundances of heavy elements in comet Halley are known to be similar to the solar abundances (Mumma, Weissman, & Stern, 1993). The opacity tables of Alexander & Ferguson (1994) are provided as a function of , where is the density in and the temperature in million K. If exceeds the available range of the opacity tables, namely, , we calculate the gas opacity by extrapolating the tabular data. Even if the values at are used for without extrapolation, no significant difference in the critical core mass is found.
The Rosseland mean opacity of dust grains is calculated from the monochromatic opacities of dust grains in protoplanetary discs presented by Semenov et al. (2003). The dust constituents, their evaporation temperatures, and the size distribution of the dust grains used in Semenov et al. (2003) are the same as those in Pollack et al. (1994), while their optical constants refer to Henning & Stognienko (1996). The difference between the grain opacities is nevertheless small (Semenov et al., 2003). We introduce a factor, , that represents reduction or enhancement of the grain opacity, namely, grain opacities being times opacities of grains in disc gas. The reasons why we introduce the factor are as follows. When icy planetesimals go through the upper envelope, if undifferentiated like comet Halley (e.g. Mumma, Weissman, & Stern, 1993), they release dust grains embedded in a matrix of ice upon evaporation. The deposited grains raise the grain opacities in the upper envelope. On the other hand, opacities of dust grains in the envelope may be reduced due to their coagulation and settling as described in Introduction (Podolak, 2003; Movshovitz & Podolak, 2008; Movshovitz et al., 2010). In this study, the total opacity is expressed by
| (14) |
where is the Rosseland mean opacity of gas and is that of dust grains in protoplanetary discs.
3 Critical Core Masses
| Parameter | Value | |
|---|---|---|
| homopause temperature, | 300, 500, 1000, 2000K | |
| mass fraction of heavy elements | ||
| in the lower layer, | ||
| grain-depletion factor, | ||
| luminosity, |
Critical core masses are found in the same way as Mizuno (1980). For a set of four parameters listed in Table 1, we determine the static structure of the envelope (i.e., ) to find the core mass for a given protoplanetary total mass, . We increase and repeat the same procedure until the core mass reaches a first maximum, which is the critical core mass. In this section, we demonstrate how envelope pollution affects the critical core mass (). Our results show that the heavy-element enrichment, in general, lowers and this behaviour of holds good for any choice of four parameters.
3.1 Effects of Envelope Pollution by Icy Planetesimals
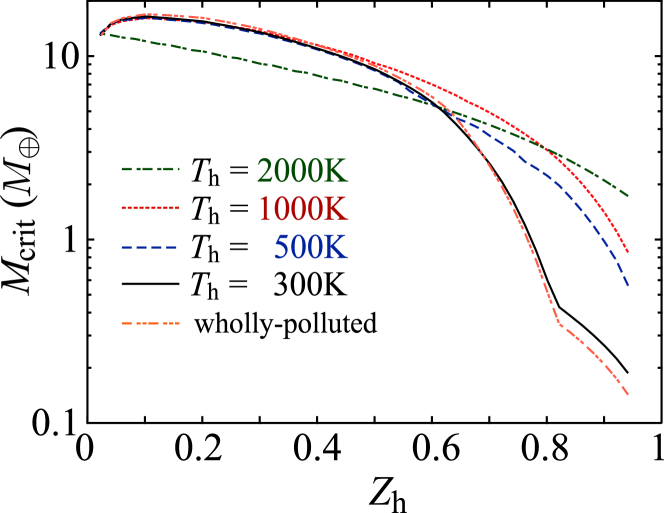
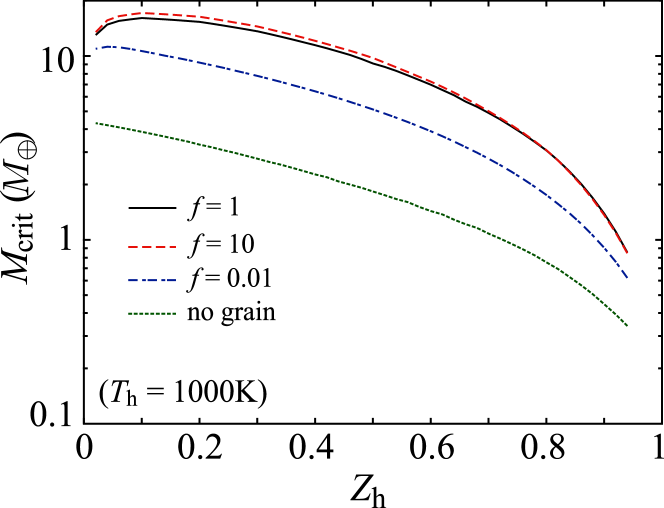
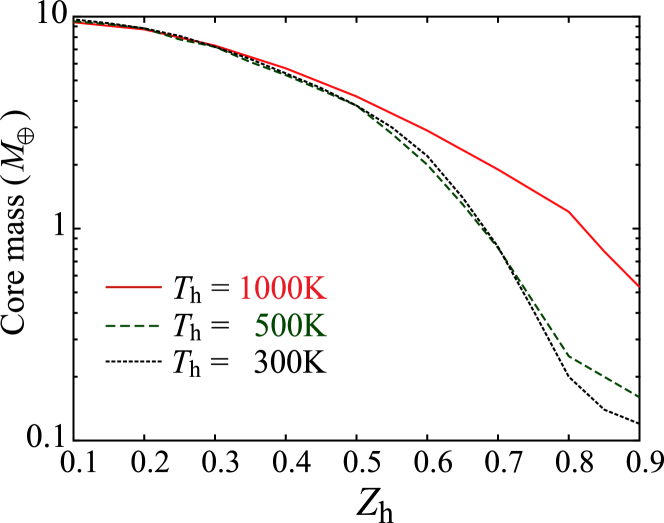
Figure 2 shows as a function of the mass fraction of heavy elements in the lower envelope, , for four different homopause temperatures, . The solid, dashed, dotted, and dot-dashed curves correspond to
, respectively. We also examine the wholly polluted envelope as an extreme case, which is shown by the double dot-dashed curve. In all the calculations shown in Figure 2, we assume and .
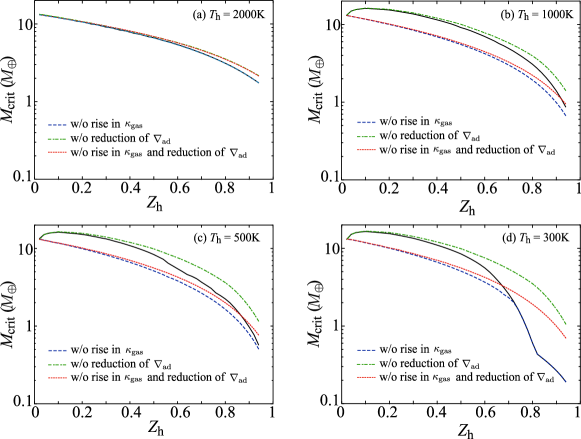
As found in Fig. 2, except for small increases for , the heavy-element enrichment lowers for any . In particular, the reduction in is significant for high . In Fig.2, one notices that depends on and in complicated manners. There are three factors to change as described in Introduction. To see how each effect contributes to change , we have done the following sensitivity tests; the results are presented in Fig.3. The solid curves correspond to the results shown in Fig.2. Other three curves represent the results for cases where one or two out of the three factors are artificially excluded.
-
•
The dashed curves: We have used with the solar abundances throughout the envelope instead of including the rise in . The difference between the solid and the dashed curves represents the increment of caused by the rise in .
-
•
The dot-dashed curves: We have used with the solar abundances throughout the envelope to exclude the effect of reduction of . The difference between the solid and the dot-dashed curves represents the decrement of due to reduction of .
-
•
The dotted curves: We have used both and with the solar abundances throughout the envelope to extract only the effect of the increase in . The difference between the values of for and the dotted curves shows the decrement of due to the increase in .
First, in the case of , the increase in is the most important for lowering , as shown in Fig.3a. The lower envelope () is fully convective (see Fig.4), so that the rise in has no influence on the change in . That is why the heavy-element enrichment in the region of always decreases with increasing . As for all the other cases, increases at first and decreases beyond . When , the increase in and reduction of are inefficient in lowering as shown in Fig.3b-3d, so that the rise in raises .
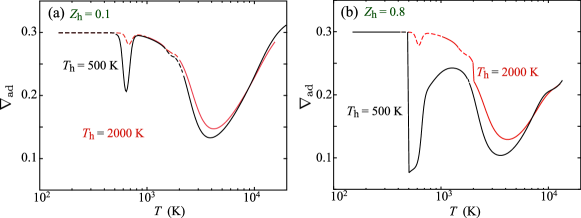
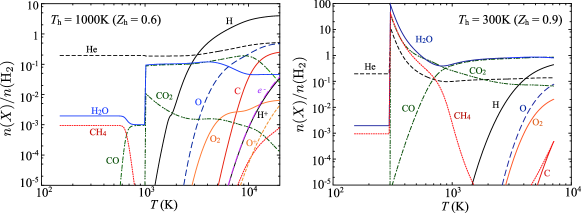
For low and relatively high , reduction of is the most effective in lowering , as shown in Fig.3d. To understand this behaviour, we present profiles of in the envelope when for in Fig.4: (left panel) and (right panel). The other cases are not presented here because the results for are quite similar to those for , respectively. Convective and radiative regions are indicated by the solid and the dashed lines in Fig.4, respectively. Two deep valleys of are seen around and above in Fig.3. Especially, for 500-900K is much smaller in the case of than in the case of . Such small is responsible for the small value of .
The reason for the decrease in is that several chemical reactions occur in that temperature range. We present the number density of each chemical species, , relative to that of molecular hydrogen, , for two typical cases in Fig.5: and K (left panel) and and K (right panel). Note that a sudden change in the slope at of the solid line in Fig. 3d appears because one of major molecules, , is replaced with at as shown in Fig.5b. In the regime of , there occur the abrupt decreases in and , which are stable chemical species at low temperatures, and the sharp increases in and . Those chemical reactions have great impacts on reduction of . Above , dissociations of several kinds of molecules such as , , and take place and reduce . As a result, the envelope is rich in , , and above .
3.2 Dependence on grain opacity
We considered only the case of in Section 3.1. The upper layer of the envelope may, however, be grain-rich or grain-poor, as described in Section 2. We consider both grain-rich () and grain-poor () envelopes in this subsection. The upper layer (i.e., ) is convectively stable in most cases. Thus, it is to be verified that the spatial distribution of added dust grains in that layer is homogeneous; nevertheless, we adopt a constant value of throughout the upper layer for simplicity.
The behaviours of for with respect to four different are shown in Fig.6. The solid curve is the same as that in Fig.2b. The dashed, dot-dashed, and dotted curves correspond to , respectively. Results for hardly differ from that for . In all the calculations, is assumed.
As shown in Fig. 6, increases as a whole (i.e., for any ), as increases. This is because dust grains are the dominant opacity source in the upper layer. The increase in is found to level off around . This is because the part of the envelope where the grain opacity dominates becomes convective; on the other hand, the slight increase for is due to increase in gas opacity in a relatively high-temperature, radiative region in the layer where the gas opacity dominates. We have also investigated the behaviour of for different and confirmed that both cases of grain-rich and grain-poor envelopes show trends similar to that for .
3.3 Dependence on luminosity
| 0.1 | ||||
|---|---|---|---|---|
| 0.3 | ||||
| 0.6 | ||||
| 0.9 |
We assumed in all the calculations shown above. The dependence of on is qualitatively the same as that in the case of solar-composition envelopes (Ikoma, Nakazawa, & Emori, 2000). Here we quantify the dependence for polluted envelopes. We calculate for three different values of , , and . Those values are chosen based on accretion rates of planetesimals that formation theory predicts (Pollack et al., 1996; Fortier, Benvenuto, & Brunini, 2009). The results are listed in Table 2, where . Table 2 shows that the decreasing trend of with is the same, irrespective of . We also have found that this is true for other .
3.4 Dependence on semimajor axis
We discussed at the present location of Jupiter in the previous subsections. In this subsection, we consider at two different semimajor axes, 1AU and 10AU. The choice of the two values is based on recent theories of the snow line in protoplanetary discs. Many relevant studies suggest that the snow line moves and reaches (Sasselov & Lecar, 2000; Davis, 2005; Garaud and Lin, 2007; Min et al., 2011). We thus adopt 1AU as the innermost orbit of the protoplanet that can experience envelope pollution by icy planetesimals. The disc density () and temperature (), namely, the outer boundary conditions, are taken as mentioned in Section 2.
The sensitivity of to the outer boundary conditions was already investigated in detail (Mizuno, 1980; Stevenson, 1982; Wuchterl, 1993; Ikoma, Emori, & Nakazawa, 2001; Rafikov, 2006): It is known that for wholly radiative envelopes is almost independent of the outer boundary conditions, while for fully convective envelopes depends significantly on them. Polluted envelopes tend to be convective, especially near the central star. The critical disc density above which the envelope is wholly convective is given by equation (13) of Ikoma, Emori, & Nakazawa (2001):
| (15) |
where is the evaporation temperature of grains, is the grain opacity near , and the subscript ”MMSN” means that the quantity takes the value of the MMSN model (Hayashi, 1981). Based on the fact that for and for other at , is satisfied for all the models of and . In fact, the outer envelope becomes fully convective in the cases of and . It is, thus, worth knowing the impact of outer boundary conditions on in the case of polluted envelopes.
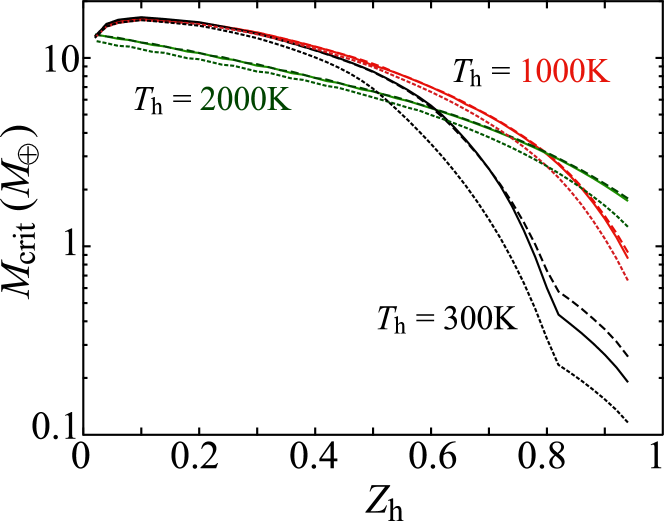
Figure 7 shows as a function of at (solid line), (dotted one) and (dashed one) for , and ; the values of the other parameters are the same as in Fig.2. The trend of is the same for all the cases. The impact of outer boundary conditions is small at ; differs at most by a factor of 2 even for and .
4 Gas Accretion Time-scale
As mentioned in Introduction, gas accretion is slower for smaller core mass, if the other parameters being the same. We need to check the time-scale for gas accretion in addition to the critical core mass. In this section, we demonstrate that envelope pollution by planetesimals can also hasten the gas accretion on to a protoplanet. We adopt the growth time of the envelope, , defined in Ikoma, Nakazawa, & Emori (2000) as the typical time-scale of gas accretion on to the protoplanet (see also Ikoma & Genda (2006); Hori & Ikoma (2010)). We consider the protoplanet with a given core mass. We simulate accumulation of disc gas after the core growth stops. Both and in those simulations are assumed to be constant in time. We discuss the validity of this assumption in Section 5.
Figure 8 shows as a function of the core mass for , , and (solid lines). For comparison, we plot the results for envelopes with the solar abundances: (dashed line) and grain-free () envelopes (dotted one). This figure demonstrates that envelope pollution by icy planetesimals accelerates gas accretion on to the protoplanet significantly. The acceleration is more effective compared to that by reduction of grain opacities in the envelope. We do not suppose reduction of grain opacities in the upper envelope in those simulations. In addition to envelope pollution, if we take into account reduction of grain opacities, it gives positive feedback to shorten (see Table 3).
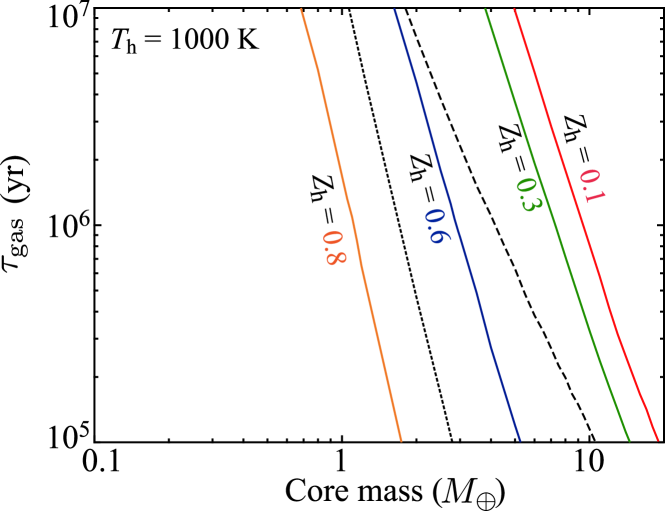
Gas giant formation must be finished before disc gas disappears. The disc lifetime is believed to be 1-10 Myrs based on the disc frequency estimated from near-IR excess (-band) observations of stars in young clusters (Haisch, Lada, & Lada, 2001; Hernández et al., 2007). We now consider the core masses with as allowable for gas giant formation. Minimum core masses () that satisfy the criterion () are listed in Table 3 for and . We cannot simulate quasi-static evolution of the protoplanet’s envelope with smaller cores than because of numerical difficulty. In such a case, we show in Table 3. In Fig.9, we also plot as a function of for three , (solid), (dashed), and (dotted). The behaviours of with respect of are quite similar to those of . We find that envelope pollution has contributions to hasten in the similar manner to the lowering of . Our results suggest that envelope pollution by icy planetesimals has the potential to make gas giant formation with small cores possible; for example, gas giants with cores smaller than can capture disc gas by 1Myr when for or when for .
5 Discussions
| = 0.1 | = 0.3 | = 0.5 | = 0.9 | ||
|---|---|---|---|---|---|
| 300 | |||||
| 500 | |||||
| 1000 | |||||
5.1 Dilution during runaway gas accretion
We assumed that both and are constant with time. This may be oversimplification and questionable, especially in the phase of runaway gas accretion. When the critical core mass is attained, the accretion rate of disc gas is much higher than that of planetesimals. In an extreme case where the unpolluted outer envelope never exchanges material with the polluted lower envelope, the gas accretion results in increasing the mass only of the upper envelope. The lower envelope behaves like a part of the “core”. In this case, the envelope pollution does not resolve the problem of the slow formation of gas giants with small cores.
In the other extreme case where the inner and outer envelopes exchange material instantaneously between each other via eddy diffusion, accreting fresh disc gas dilutes the polluted lower envelope, which results in decelerating the disc-gas accretion. On the other hand, the dilution is inevitably accompanied by mass growth of the envelope, which accelerates the disc-gas accretion.
Unfortunately, it is uncertain whether or not mixing occurs effectively, as follows. A characteristic time-scale of eddy diffusion, , is given by
| (16) |
where is the pressure scale-height and is the coefficient of eddy diffusion. Estimated values of are listed in Table 4, where we have used our numerical values of at the tropopause when . We have adopted which correspond to values for the present Jupiter and Saturn (e.g. Chamberlain & Hunten, 1987), although for protoplanetary envelopes is uncertain. The lower and upper values of at each and in Table 4 are of K and that of K, respectively. As seen in this table, ranges widely from to . Since time-scales of gas accretion of interest are – years (which correspond to the observed disc lifetime), we can derive no definite conclusion as to whether dilution occurs or not, because of the uncertainty of . Mixing in accreting protoplanetary envelopes is found to be an important issue with gas giant formation.
| 0.1 | - | - |
|---|---|---|
| 0.3 | - | - |
| 0.6 | - | - |
| 0.8 | - | - |
5.2 Non-ideality of envelope gas
In this study, we considered the envelope gas as ideal. In the case of the envelope with the solar abundances, we find that non-ideal effects cause less than change in the critical core mass. This paper aims to point out the importance to incorporate the effects of heavy-element enrichments in simulations of the structure and evolution of protoplanetary envelopes and to sort out what has a great impact on the critical core mass. Including the effects of non-ideality of gas is a future study. We found that reactions between molecular compounds play a important role in determining the critical core mass. Thus, we need thermodynamic quantities of non-ideal mixture of at least H, He, C, and O.
5.3 Dynamical stability
We should also pay attention to the dynamical stability of the envelope. Tajima & Nakagawa (1997) found that the envelope with solar abundances is stable dynamically throughout quasi-static evolution up to Jupiter’s mass. However, it is not obvious whether the envelope polluted by heavy elements is stable or not. In this study, reduction of due to molecular dissociations is one of important effects to lower and shorten . Vibrational instability due to molecular dissociation may excite nonlinear hydrodynamical waves by -mechanism because of reduction of and the rise in (Wuchterl, 1991). Nonlinear hydrodynamical waves may cause dynamical expansion of the envelope and the ejection of a large part of the envelope. Thus, the dynamical stability of the polluted envelope should be also investigated in the future.
5.4 Implication for Jupiter and Saturn
It is worth while to consider the origin of Jupiter and Saturn from the viewpoint of core masses. Interior modellings of the two planets suggest that Jupiter’s core is smaller than , while Saturn’s core is larger than (Saumon & Guillot, 2004; Nettelmann et al., 2008). Militzer et al. (2008) reported that Jupiter may possess a massive core of , but their interior modellings with rigid rotation are inconsistent with the observed value of the 4th-order gravitational moment, . In addition, Fortney & Nettelmann (2010) pointed out that the mass fraction of helium used by Militzer et al. (2008) is responsible for a massive core of Jupiter. Although the exact mass of Jupiter’s core is still an open question, the core mass of Jupiter suggested by interior modellings is, on average, smaller than that of Saturn.
In this study, we demonstrated that envelope pollution by icy planetesimals enables formation of gas giants with small cores, which seems compatible with recent modellings of Jupiter. If so, how about the origin of Saturn that is inferred to have a large core? The large core inside Saturn may reflect the history of high accretion rates of planetesimals. A variety of ideas for high accretion rates have been investigated so far — e.g., the influence of growing proto-Jupiter and the other protoplanets (Guilera, Brunini, & Benvenuto, 2010), Type I migration of protoplanets (Alibert et al., 2005), high stellar metallicity and a large initial disc mass (Thommes & Murray, 2006), high initial surface density of solid materials (Dodson-Robinson et al., 2008; Rafikov, 2011). However, high accretion rates of planetesimals could have a risk of forming Saturn with a small core. This is because a large amount of small-sized fragments are produced in the Saturn’s region due to frequent high-velocity collisions of planetesimals, so that the envelope should be polluted heavily by icy planetesimals. Thus, we require to revisit accretion rates of planetesimals on to proto-Saturn, for example, in the case where Jupiter first emerges and other planetary cores still continue to grow. This is because planetary accretion proceeds more rapidly in the inner regions, so that proto-Jupiter may have formed a small core first and triggered runaway gas accretion due to envelope pollution by icy planetesimals.
As one alternative idea for a large core of Saturn, Li, Agnor, & Lin (2010) suggested that Saturn might have experienced an impact of a (proto-) gas giant and then merged. It is still an open question whether such an impact on Saturn happened in reality in a multiple-protoplanet system. Direct N-body simulations of competitive core growth beyond the snow line will give an answer to this problem.
We should also comment on another possibility that the disc instability scenario may be able to explain gas giants with small cores. The disc instability scenario is usually a single-stage model in which a massive protoplanetary disc, typically , becomes gravitationally unstable and rapidly collapses to form a proto-gas giant planet (e.g. Cameron, 1978; Boss, 2006; Mayer et al., 2007; Durisen et al., 2007; Boley, 2009; Inutsuka, Machida, & Matsumoto, 2010). Recent works on the disc instability scenario showed that a gaseous clump is able to capture planetesimals in the course of its rapid contraction, assuming concurrent formation of large-sized planetesimals (Helled, Podolak, & Kovetz, 2008; Helled & Schubert, 2008, 2009) or a gaseous clump is formed in a dense region where solid materials (1-10) are collected aerodynamically by spiral arms (Boley, Helled, & Payne, 2011). In those scenarios, grains that grow to typically can settle down toward the centre against the stirring of convective motion and form a relatively small core. Also the disc instability scenario is faced with the problem of Saturn formation, although Jupiter with a small core could be formed by the disc instability. One possibility to form a large core of Saturn is that the existence of Jupiter influences the distribution of planetesimals near Jupiter’s region and enhances the core growth of Saturn. As mentioned in the above paragraph, this situation is the almost same as the envisioned picture of the Saturn formation in the core-accretion model taking account into envelope pollution. More recently, Nayakshin (2010) has proposed another idea of gas giant formation with large cores by the disc instability: Grain sedimentations inside a large gaseous clump yield a large core and trigger rapid gas accretion on to the core. When the clump migrates into a few AU from a parent star, it experiences tidal disruption and evaporation due to stellar irradiation. It is peeled off the outer metal-poor envelope of the clump and then results in a Saturn-like planet. In the future, further detailed studies will verify his idea.
5.5 The amount of heavy elements in envelopes of extrasolar gas giants
Recent measurements of the mass and radius of transiting extrasolar gas giants (EGG) allow us to constrain planetary composition (e.g. Guillot, 2008). Those internal structures showed a variety of the total amount of heavy elements contained in transiting EGGs, including cores. Although it is not clear whether such a diversity of the amount of heavy elements in EGGs reflects a diversity of their core masses, core masses of EGGs are a key test to verify how efficiently our idea of envelope pollution works in reality. Further transit observations of EGGs and our comprehensive understanding of interior structures of EGGs will help us to reveal formation of giant planets.
5.6 Implication for Uranus and Neptune
Finally, we consider an implication of interior structures of Uranus and Neptune. Envelope pollution by icy planetesimals (and erosion of their icy shells) may be in good agreement with interior modellings of the present Uranus and Neptune. The envelopes enriched by volatile molecules such as and have been proposed in order to reproduce their observed gravitational moments ( and ), which are poorly constrained (Podolak, Weizman, & Marley, 1995; Marley, Gómez, & Podolak, 1995). Many recent works on interior modellings of Uranus and Neptune also suggested that they may have the envelopes into which ”ices” are mixed instead of traditional three-layer models, that is density-stratified interiors (Podolak, Podolak, & Marley, 2000; Helled et al., 2011). On the other hand, the fact that the present Uranus and Neptune have non-axisymmetric, non-dipolar magnetic fields may favour the existence of stably-stratified fluid layers beneath the outer thin shell that drives dynamo action (Stanley & Bloxham, 2004, 2006). In addition, the compositional stratification in the interior may be responsible for extremely low-luminous Uranus (Podolak, Hubbard, & Stevenson, 1991; Hubbard, Podolak, & Stevenson, 1995). It is still unclear whether the H/He envelopes are gradually-mixed with ices toward the centres or not. In any case, both Uranus and Neptune are likely to possess the outer polluted envelopes from the viewpoint of the gravitational harmonics and thermal evolution. Their polluted envelopes may be consistent with the picture of envelope pollution by incoming icy planetesimals, although we cannot rule out the another possibility for Uranus that a giant impact on a primitive Uranus results in the polluted envelope because the current Uranus has the extreme axial tilt (Korycansky et al., 1990; Slattery, Benz, & Cameron, 1992).
6 Summary and Conclusions
We have investigated how envelope pollution by incoming icy planetesimals affects critical core masses () and growth time-scales of the envelope (). We considered that the envelope has two-layer structure: the upper layer with the solar abundances (non-polluted layer) and the lower one with mixture of solar and comet-Halley-like compositions (polluted layer). We introduced two key parameters, the mass fraction of the heavy elements in the lower envelope () and the homopause temperature () which defines the boundary between the two layers. The main results that we obtained in this study are summarized as follows.
-
(1)
Critical core masses:
Envelope pollution by icy planetesimals lowers for any choice of values of and most of the range of (Fig.2). Widely-polluted (low ) and highly-polluted (high ) envelopes lessen remarkably. The increases in the molecular weight () and reduction of adiabatic temperature gradient () are responsible for the lowering of (Fig. 3). In particular, remarkable reduction of due to chemical reactions for 400-900K and molecule dissociations for 2000K (Figs. 4 and 5). Such behaviour of is the same for any choices of other parameters, the grain opacities (Fig. 6), the luminosity (Table 2), and the semimajor axes (Fig. 7). -
(2)
Growth time-scales of the envelope:
We have simulated the growth of the protoplanetary envelope after the core growth stops. Our simulations demonstrate that the envelope pollution can also hasten gas accretion on to the protoplanet (Fig.8), which implies that envelope pollution may enable gas giant formation with small cores (Fig. 9 and Table 3).
To confirm that our idea really works, further studies will be required: (i) chemical evolution in the polluted envelope coupled with eddy diffusion and inflow of disc gas, (ii) dynamical stability of the polluted envelope, (iii) competitive core growth (planetary accretion) beyond the snow line in a multiple-protoplanet system, (iv) the efficiency in mass deposits of icy planetesimals based on their trajectories and sizes in the envelope, (v) envelope pollution due to erosion of a core itself, and (vi) chemical equilibria of non-ideal gases in the polluted envelope. However, it is quite certain that envelope pollution by planetesimals occurs and affects the formation process of gas giants. We claim that it is necessary to take into account envelope pollution when we discuss gas giant formation based on the-core accretion model.
7 Acknowledgements
We thank S. Ida for fruitful discussion and several supports. We appreciate that J. Ferguson calculated and sent the gas opacity data on his request. We also thank T. Guillot and M. Podolak for their critical comments in the early phase of this study and an anonymous referee for the useful comments on this manuscript. Y.H. is supported by Grant-in-Aid for JSPS Fellows (No.21009495) from the Ministry of Education, Culture, Sports, Science and Technology (MEXT) of Japan.
References
- Alexander & Ferguson (1994) Alexander D. R., Ferguson J. W., 1994, ApJ, 437, 879
- Alibert et al. (2005) Alibert Y., Mordasini C., Benz W., Winisdoerffer C., 2005, A&A, 434, 343
- Alibert, Mordasini, & Benz (2011) Alibert Y., Mordasini C., Benz W., 2011, A&A, 526, A63
- Benvenuto & Brunini (2008) Benvenuto O. G., Brunini A., 2008, Icar, 195, 882
- Bodenheimer & Pollack (1986) Bodenheimer P., Pollack J. B., 1986, Icar, 67, 391
- Boley (2009) Boley A. C., 2009, ApJ, 695, L53
- Boley, Helled, & Payne (2011) Boley A. C., Helled R., Payne M. J., 2011, arXiv, arXiv:1104.0939
- Boss (2006) Boss A. P., 2006, ApJ, 637, L137
- Cameron (1978) Cameron A. G. W., 1978, M&P, 18, 5
- Chamberlain & Hunten (1987) Chamberlain, J. W., Hunten, D. M., 1987, International Geophysics Series, Vol. 36. Academic Press Inc., Orlando, FL, USA.
- Chase (1998) Chase, Jr., M. W., 1998, Journal of Physical and Chemical Reference Data. Monograph No.9., The American Chemical Society and the American Institute of Physics for the National Institute of Standards and Technology.
- Davis (2005) Davis, S. S., 2005, ApJ, 620, 994
- Dodson-Robinson et al. (2008) Dodson-Robinson, S. E., Bodenheimer, P., Laughlin, G., Willacy, K., Turner, N. J., Beichman, C. A., 2008, ApJ, 688, L99
- Durisen et al. (2007) Durisen R. H., Boss A. P., Mayer L., Nelson A. F., Quinn T., Rice W. K. M., 2007, prpl.conf, 607
- Fortier, Benvenuto, & Brunini (2007) Fortier A., Benvenuto O. G., Brunini A., 2007, A&A, 473, 311
- Fortier, Benvenuto, & Brunini (2009) Fortier A., Benvenuto O. G., Brunini A., 2009, A&A, 500, 1249
- Fortney & Nettelmann (2010) Fortney J. J., Nettelmann N., 2010, SSRv, 152, 423
- Garaud and Lin (2007) Garaud, P., Lin, D. N. C., 2007, ApJ, 654, 606
- Guilera, Brunini, & Benvenuto (2010) Guilera O. M., Brunini A., Benvenuto O. G., 2010, A&A, 521, A50
- Guillot (2008) Guillot T., 2008, PhST, 130, 014023
- Haisch, Lada, & Lada (2001) Haisch K. E., Jr., Lada E. A., Lada C. J., 2001, ApJ, 553, L153
- Hayashi (1981) Hayashi C., 1981, PThPS, 70, 35
- Helled, Podolak, & Kovetz (2008) Helled R., Podolak M., Kovetz A., 2008, Icar, 195, 863
- Helled & Schubert (2008) Helled R., Schubert G., 2008, Icar, 198, 156
- Helled & Schubert (2009) Helled R., Schubert G., 2009, ApJ, 697, 1256
- Helled et al. (2011) Helled R., Anderson J. D., Podolak M., Schubert G., 2011, ApJ, 726, 15
- Henning & Stognienko (1996) Henning, T., Stognienko, R., 1996, A&A, 311, 291
- Hernández et al. (2007) Hernández J., et al., 2007, ApJ, 662, 1067
- Hubbard, Podolak, & Stevenson (1995) Hubbard, W. B., Podolak, M., & Stevenson, D. J. 1995, The Interior of Neptune. Neptune and Triton, 109
- Hubickyj, Bodenheimer, & Lissauer (2005) Hubickyj O., Bodenheimer P., Lissauer J. J., 2005, Icar, 179, 415
- Hori & Ikoma (2010) Hori, Y., Ikoma, M., 2010, ApJ, 714, 1343
- Ida & Lin (2008) Ida S., Lin D. N. C., 2008, ApJ, 673, 487
- Ikoma, Nakazawa, & Emori (2000) Ikoma M., Nakazawa K., Emori H., 2000, ApJ, 537, 1013
- Ikoma, Emori, & Nakazawa (2001) Ikoma M., Emori H., Nakazawa K., 2001, ApJ, 553, 999
- Ikoma & Genda (2006) Ikoma M., Genda H., 2006, ApJ, 648, 696
- Inaba & Ikoma (2003) Inaba S., Ikoma M., 2003, A&A, 410, 711
- Inaba, Wetherill, & Ikoma (2003) Inaba S., Wetherill G. W., Ikoma M., 2003, Icar, 166, 46
- Inutsuka, Machida, & Matsumoto (2010) Inutsuka S.-i., Machida M. N., Matsumoto T., 2010, ApJ, 718, L58
- Kalas et al. (2008) Kalas P., et al., 2008, Sci, 322, 1345
- Kennedy & Kenyon (2008) Kennedy G. M., Kenyon S. J., 2008, ApJ, 673, 502
- Kippenhahn & Weigert (1994) Kippenhahn, R., Weigert, A., 1994, Stellar Structure and Evolution, Springer-Verlag Berlin Heidelberg New York. Astronomy and Astrophysics Library
- Kobayashi et al. (2010) Kobayashi H., Tanaka H., Krivov A. V., Inaba S., 2010, Icar, 209, 836
- Korycansky et al. (1990) Korycansky D. G., Bodenheimer P., Cassen P., Pollack J. B., 1990, Icar, 84, 528
- Lagrange et al. (2009) Lagrange A.-M., et al., 2009, A&A, 493, L21
- Li, Agnor, & Lin (2010) Li S. L., Agnor C. B., Lin D. N. C., 2010, ApJ, 720, 1161
- Lissauer et al. (1995) Lissauer, J. J., Pollack, J. B., Wetherill, G. W., Stevenson, D. J., 1995, Formation of the Neptune system. Neptune and Triton, 37
- Lodders, Plame, & Gail (2009) Lodders K., Plame H., Gail H.-P., 2009, LanB, 44
- Marley, Gómez, & Podolak (1995) Marley M. S., Gómez P., Podolak M., 1995, JGR, 100, 23349
- Marois et al. (2008) Marois C., Macintosh B., Barman T., Zuckerman B., Song I., Patience J., Lafrenière D., Doyon R., 2008, Sci, 322, 1348
- Marois et al. (2010) Marois C., Zuckerman B., Konopacky Q. M., Macintosh B., Barman T., 2010, Natur, 468, 1080
- Min et al. (2011) Min M., Dullemond C. P., Kama M., Dominik C., 2011, Icar, 212, 416
- Mayer et al. (2007) Mayer, L., Lufkin, G., Quinn, T., Wadsley, J., 2007, ApJ, 661, L77
- Miguel, Guilera, & Brunini (2011) Miguel Y., Guilera O. M., Brunini A., 2011, MNRAS, 412, 2113
- Militzer et al. (2008) Militzer, B., Hubbard, W. B., Vorberger, J., Tamblyn, I., Bonev, S. A., 2008, ApJ, 688, L45
- Mizuno (1980) Mizuno H., 1980, PThPh, 64, 544
- Movshovitz & Podolak (2008) Movshovitz N., Podolak M., 2008, Icar, 194, 3
- Movshovitz et al. (2010) Movshovitz N., Bodenheimer P., Podolak M., Lissauer J. J., 2010, Icar, 209, 616
- Mumma, Weissman, & Stern (1993) Mumma M. J., Weissman P. R., Stern S. A., 1993, prpl.conf, 1177
- Nayakshin (2010) Nayakshin S., 2010, MNRAS, 408, L36
- Nettelmann et al. (2008) Nettelmann, N., Holst, B., Kietzmann, A., French, M., Redmer, R., Blaschke, D., 2008, ApJ, 1217
- Ott & Boerio-Goates (2000) Ott, J.B., Boerio-Goates, J., 2000, Chemical Thermodynamics: Principles and Applications. Academic Press, London, UK.
- Papaloizou & Nelson (2005) Papaloizou, J. C. B., Nelson, R. P., 2005, A&A, 433, 247
- Podolak (2003) Podolak, M., 2003, Icar, 165, 428
- Podolak, Hubbard, & Stevenson (1991) Podolak M., Hubbard W. B., Stevenson D. J., 1991, Models of Uranus’ interior and magnetic field. Uranus, 29
- Podolak, Podolak, & Marley (2000) Podolak M., Podolak J. I., Marley M. S., 2000, P&SS, 48, 143
- Podolak, Pollack, & Reynolds (1988) Podolak M., Pollack J. B., Reynolds R. T., 1988, Icar, 73, 163
- Podolak, Weizman, & Marley (1995) Podolak M., Weizman A., Marley M., 1995, P&SS, 43, 1517
- Pollack et al. (1986) Pollack J. B., Podolak M., Bodenheimer P., Christofferson B., 1986, Icar, 67, 409
- Pollack et al. (1994) Pollack J. B., Hollenbach D., Beckwith S., Simonelli D. P., Roush T., Fong W., 1994, ApJ, 421, 615
- Pollack et al. (1996) Pollack J. B., Hubickyj O., Bodenheimer P., Lissauer J. J., Podolak M., Greenzweig Y., 1996, Icar, 124, 62
- Rafikov (2006) Rafikov, R. R., 2006, ApJ, 648, 666
- Rafikov (2011) Rafikov R. R., 2011, ApJ, 727, 86
- Sasselov & Lecar (2000) Sasselov, D. D., Lecar, M., 2000, ApJ, 528, 995
- Saumon & Guillot (2004) Saumon, D., Guillot, T., 2004, ApJ, 609, 1170
- Semenov et al. (2003) Semenov, D., Henning, T., Helling, C., Ilgner, M., Sedlmayr, E., 2003, A&A, 410, 611
- Slattery, Benz, & Cameron (1992) Slattery W. L., Benz W., Cameron A. G. W., 1992, Icar, 99, 167
- Stanley & Bloxham (2004) Stanley S., Bloxham J., 2004, Natur, 428, 151
- Stanley & Bloxham (2006) Stanley S., Bloxham J., 2006, Icar, 184, 556
- Stevenson (1982) Stevenson D. J., 1982, P&SS, 30, 755
- Tajima & Nakagawa (1997) Tajima, N., Nakagawa, Y., 1997, Icar, 126, 282
- Thommes & Murray (2006) Thommes E. W., Murray N., 2006, ApJ, 644, 1214
- Wuchterl (1991) Wuchterl, G., 1991, Icar, 91, 53
- Wuchterl (1993) Wuchterl, G., 1993, Icar, 106