Modeling the hard TeV spectra of blazars 1ES 0229+200 and 3C 66A with an internal absorption scenario
Abstract
We study the applicability of the idea of internal absorption of -rays produced through synchrotron radiation of ultrarelativistic protons in highly magnetized blobs to 1ES 0229+200 and 3C 66A, the two TeV blazars which show unusually hard intrinsic -ray spectra after being corrected for the intergalactic absorption. We show that for certain combinations of reasonable model parameters, even with quite modest energy requirements, the scenario allows a self-consistent explanation of the non-thermal emission of these objects in the keV, GeV, and TeV energy bands.
1 Introduction
Over the last few years a number of active galactic nuclei (AGN) with redshifts have been detected in the very high energy (VHE; GeV) regime111See http://tevcat.uchicago.edu/ for an updated list of VHE -ray sources. The detection of VHE -rays from such distant objects implies serious constraints on the intensity and spectral shape of the extragalactic background light (EBL). Traveling over cosmological distances, high energy -rays are significantly absorbed due to effective interactions with photons of the EBL (Nikishov, 1962; Gould & Schréder, 1967). The level of attenuation depends strongly on the intensity, spectral shape and redshift-dependence of the EBL. While robust EBL lower limits can be obtained from galaxy counts (Madau & Pozzetti, 2000), the derivation of the EBL properties based on direct measurements is quite difficult because of dominant foregrounds (see for a review Hauser & Dwek, 2001; Hauser et al., 1998). In this regard, the theoretical modeling of the processes which generate the EBL (see e.g. Primack et al., 2008; Kneiske & Dole, 2010; Franceschini et al., 2008; Dominguez et al., 2010) is an important aspect of the activity in EBL studies.
The mean free path of -rays due to interactions with EBL strongly depends on energy. Therefore the intergalactic absorption leads not only to attenuation of the absolute fluxes, but also to significant changes in the spectral shape of -rays. The proper understanding of this spectral deformation is crucial for the correct interpretation of the VHE data from distant AGN. It is important to note that because of strong Doppler boosting of the non-thermal emission () the -ray emission from the brightest blazars can remain detectable even after severe intergalactic absorption.
Thus the mere attenuation of the -ray emission is not enough to derive robust constraints on the EBL models. The distortion of the initial spectral shape of -rays contains more information. Since in the effective absorption regime the optical depth , even a slight change of the EBL intensity can lead to a strong change of the energy-dependent spectral deformation factor . This allows quite meaningful upper limits on the EBL in the relevant energy bands, based on the condition that the intrinsic spectrum of -rays should have a decent form, e.g. be not much harder than . On the other hand, the absorption-corrected VHE spectra of some AGN with in some cases appear very hard, even for very a low EBL flux, with a power-law photon index () quite close to the hardest conventional value of (Aharonian et al., 2006, 2007; Franceschini et al., 2008). In the case of slightly higher fluxes of the EBL, the reconstructed spectra would get even harder, with .
Although currently there is a general consensus in the community that the EBL intensity should be quite close to the robust lower limits derived from galaxy counts, the possibility of slightly higher fluxes of the EBL cannot yet be excluded. In particular, using Spitzer data and a profile fitting of the faint fringes of galaxies, Levenson & Wright (2008) claimed a new fiducial value for the contribution of galaxies to the EBL at of , which exceeds by a factor of the flux of the EBL suggested by Franceschini et al. (2008). Following Levenson & Wright (2008), Krennrich et al. (2008) indicated that for this flux of EBL the initial (absorption corrected) VHE spectra of distant blazars 1ES 0229+200, 1ES 1218+30.4 and 1ES 1101-232 (located at redshifts , and , respectively) would have a photon index . This result would challenge the conventional models for VHE production in AGN.
Generally, the X- and -ray non-thermal emission of blazars is interpreted as a sum of synchrotron and inverse Compton (IC) components of radiation from relativistic electrons, in the framework of the so-called synchrotron self-Compton (SSC) or external Compton (EC) scenarios. In the case of radiatively efficient models, i.e. assuming a radiatively cooled particle distribution, the IC spectrum in the Thomson limit is expected to be steeper than the power-law distribution with photon index . This limit does not depend on the electron initial (injection) spectrum and can be achieved, for example, in the case of a mono-energetic injection. At higher energies, the -ray spectrum becomes steeper due to the Klein-Nishina effect. We note however, that typically the spectra obtained in the frameworks of SSC scenario are steeper, with photon indices . Therefore, the spectrum with photon index is often referred to as the hardest spectrum allowed by standard blazar models. However, in the expense of radiation efficiency it is possible to produce harder VHE spectra still within the SSC framework, for example assuming a high lower-energy cutoff in the electron spectrum (Katarzyński et al., 2006). The postulation of such a cutoff in the electron spectrum implies very low efficiency of radiative cooling which, in turn, increases the requirements for the energy in accelerated electrons and at the same time requires very small magnetic fields. Thus, in such scenarios we face a significant (by orders of magnitude) deviation from equipartition, (see e.g. Tavecchio et al., 2009).
Alternatively, Aharonian et al. (2008) have suggested a scenario for the formation of VHE spectra of almost arbitrary hardness by involving additional absorption of VHE -rays interacting with dense radiation fields in the vicinity of the -ray production region. The key element in this scenario is the presence of a dense photon field with a narrow energy distribution or with a sharp low energy cut-off around . In this case, -rays are attenuated more effectively at energies than at energies , and therefore, for large optical depths (), the emerging spectrum in the VHE band should gradually harden towards higher energies (for detail, see Aharonian et al., 2008).
While the absorption of high energy -rays in the inner parts of AGN jets is generally possible, or even unavoidable in some cases (McBreen, 1979; Liu & Bai, 2006; Reimer, 2007; Sitarek & Bednarek, 2008; Liu et al., 2008; Bai et al., 2009; Tavecchio & Mazin, 2009), the detailed modeling of this process requires additional assumptions concerning the presence of low-frequency radiation fields, the location and size of the -ray production region, the Doppler factor of the jet, etc. We note that currently there is no observational evidence excluding the photon field properties required by Aharonian et al. (2008), also in the case of BL Lacs. Remarkably, the internal absorption hypothesis provides an alternative explanation for the non-thermal X-ray emission, namely as synchrotron radiation of secondary (pair-produced) electrons (Aharonian et al., 2008), which suggests a possible solution to the problem of low acceleration efficiency in leptonic models of high energy emission of blazars (Costamante et al., 2009).
In the original paper, Aharonian et al. (2008) presented a general description of the scenario with calculations of model SEDs, but the obtained spectra were not compared with available data. In the present paper, we discuss the multiwavelength properties of the radiation in the internal absorption scenario, and apply the model to the data of two distant AGN, namely 1ES 0229+200 () and 3C 66A (estimated at ), detected in TeV band (Aharonian et al., 2007; Aliu et al., 2009; Acciari et al., 2009; Reyes et al., 2009). Here we adopt the proton synchrotron radiation as the source of primary -rays, and consider the absorption due to - pair production both in the -ray production region and in the surroundings. The synchrotron radiation of secondary pairs gives rise to an additional lower energy non-thermal component. The latter can be calculated self-consistently and depends on the primary -ray spectrum, the target photon field and the relativistic motion of the -ray production region.
2 Model description
.
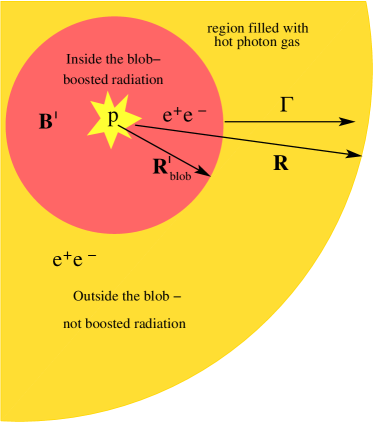
A sketch of the model adopted in this paper is shown in Fig. 1, and the main ingredients of the model are described in the figure caption.
2.1 Primary -rays
The primary -rays are produced through synchrotron radiation of protons. Generally, in such a scenario the energy is stored in the magnetic field and episodically can be transferred to protons of extremely high energies forming a non-thermal population of particles (see for details Aharonian, 2000). The energy released in non-thermal protons can be expressed through the strength of the magnetic field and the source radius :
| (1) |
where is the fraction of the blob magnetic energy transferred to accelerated protons (all physical quantities in the blob rest frame are primed).
The proton synchrotron model for blazars works in the case of extremely effective acceleration of protons with an energy spectrum which continues up to ultra high energies, being limited either by the confinement in the accelerator (so-called “Hillas criterion”):
| (2) |
or by synchrotron losses:
| (3) |
The synchrotron cooling time of protons
| (4) |
is comparable to the proton confinement time assuming Bohm-type diffusion
| (5) |
where is the ratio of the proton diffusion coefficient to the Bohm one. We note that the confinement time cannot be shorter than light crossing time
| (6) |
Given the identical dependencies of times described by Eqs.(4)-(5) on proton energy, the cooling regime is defined by the following parameter:
| (7) |
implying fast cooling for and slow cooling for . In the case of slow cooling only a fraction of the proton non-thermal energy will be emitted through the synchrotron channel.
In the blob frame the synchrotron emission is expected to be isotropic with spectral energy distribution (SED) extending up to the energy
| (8) |
if the proton maximum energy is given by Eq.() the Hillas criterion Eq.(2), i.e. . In the case of large production region (i.e. ), the location of the SED maximum is determined by synchrotron losses and is expected to occur at
| (9) |
In the laboratory frame the proton emission of such a blob is characterized by luminosity of
| (10) |
where is Doppler boosting factor, with typical variability time-scale of
| (11) |
Formally, the VHE spectrum of the boosted proton synchrotron may extend up to
| (12) |
However, we note that the actual shape of the spectrum close to the cutoff may be rather smooth, with a significant fraction of particles above the formal cutoff energy (e.g. for non-relativistic diffusive shock acceleration; see Zirakashvili & Aharonian, 2007). This effect may significantly relax the constraints imposed by Eq.(12), given the quadratic dependence of the synchrotron photon energy on the energy of the parent particle.
For model calculations, in this paper we assume the spectrum of non-thermal protons to be a power law with exponential cutoff (), with the cutoff energy defined according to Eq.(3), i.e. we assume a very high acceleration efficiency. We consider two cases for the proton power-law index : (i) the conventional value close to , and(ii) a very hard case with index , as predicted by the converter mechanism (Derishev et al., 2003). The emission is assumed to be produced in the slow cooling regime. This approximation is valid for time intervals shorter than the variability time scale defined by Eq.(11). Under this assumption, the VHE emission component is characterized by a photon index in the case (i); and by the hardest possible photon index for the synchrotron radiation –namely – in the case of the converter mechanism (ii). We note that the latter case involves VHE spectra harder than conventionally accepted, but this case can be realized only in the slow cooling regime. Otherwise (i.e. in the fast cooling regime), the cooling mechanism should modify the proton distribution resulting in VHE spectra with photon index close to for dominant synchrotron cooling; or close to for dominant adiabatic losses.
2.2 Internal absorption
There are several possible sources of UV and soft X-ray emission close to the base of the jet relate e.g. to accretion disk or corona. This emission may be reprocessed by matter surrounding the jet. This leads to the formation of the so-called Broad Line Regions (BLRs), which are characterized, in the case of powerful blazars, by a size of cm and luminosities of (see e.g. Tavecchio & Ghisellini, 2008). Such dense photon fields imply significant absorption, at least if the production region is located close to the jet base. The optical depth is estimated as:
| (13) |
where is the Thomson cross-section, is the -ray travel distance in the photon field and is the density of target photons. Since the size of the region filled by target-photons is larger than the travel distance , the lower limit on the luminosity of the photon field, for the given optical depth , is estimated as:
| (14) |
where is the maximum opacity which occurs for the -ray of energy . In general, the photon field required for the internal absorption scenario has a low luminosity and may be undetectable (it is not Doppler boosted!). In order to get an arbitrary hard spectrum after internal absorption, we assume the target photon field to be a gray body, i.e. a diluted Planckian distribution, characterized by the temperature and the dilution coefficient .
2.3 Secondary emission
The energy of the absorbed -ray is transferred to an electron-positron pair. Since the internal absorption scenario requires large optical depths , a significant fraction of energy given by Eq.(1) goes to secondary electrons. The observational appearance of these secondaries depends strongly on the site of their production. Namely, if the pair is created outside the blob, emission of these electrons will not be boosted and thus remain undetectable. On the other hand, if the electrons are produced in the blob, they will be isotropized and emit synchrotron radiation due to the strong magnetic field in the blob. This radiation component can be detected because of strong Doppler boosting.
In the blob reference frame, the target photon field is strongly anisotropic. Thus, the optical depth in the blob depends on the direction of the -ray with respect to bulk velocity. Since we assume the blob to be homogeneous, we introduce the optical depth , averaged over the -ray directions (in the blob rest frame)222 In our calculations the averaged optical depth is defined as ., to characterize the absorption in the blob. The corresponding values are shown in Table 1.
It is possible to estimate the optical depth in the blob since basically all the emission is focused towards the direction of the proper motion. Indeed, the optical depth for a -ray propagating in the direction of the proper motion will be
| (15) |
where is blob bulk Lorentz factor (for detail see e.g. Begelman et al., 2008). Thus, a simple relation333This relation was used to derive the sizes of the blob listed in Table 1. between size of the BLR region, size of the blob, maximum optical depth , blob optical depth and bulk Lorentz factor can be written as
| (16) |
This ratio indicates that in the case of a compact region filled with photon gas, cm, the optical depth in the blob is quite high:
| (17) |
The injection spectrum of secondary electrons depends on the photon index of primary -rays, target photon field, bulk Lorentz factor of the blob and the internal optical depth. If the target photon field is characterized by a peak energy , then the maximum injection rate in the blob occurs at energy
| (18) |
However, we have to note that depending on the slope of the primary -ray spectrum, this value can change significantly. Since the synchrotron cooling time of these electrons,
| (19) |
is very short (compared to both the typical time scales for the system and the Compton cooling time of electrons),
| (20) |
the entire absorbed energy will be immediately released by secondary electrons through the synchrotron channel.
In the case of large internal absorption or high bulk Lorentz factor, the secondary synchrotron component has a broad distribution centered at
| (21) |
The variability time-scale of the synchrotron radiation of secondary pairs is determined by the change of the injection, i.e. by the change of primary -ray component. In the case of small internal opacity and assuming that protons are distributed over the energy interval between and with -type spectrum, the luminosity of the secondary synchrotron radiation is estimated as
| (22) |
In the framework of the discussed model an important relation can be established between the slopes of the intrinsic -ray spectrum and the highest energy part of the secondary synchrotron components. This part of the synchrotron spectrum is produced by electron-positron pairs which are created significantly above the threshold of the interaction, thus it is possible to use the asymptotic limit of the cross section. Since one of the secondary electrons receives almost the all parent -ray energy, the cross section can be approximated as
| (23) |
Then, the spectrum of the secondary pairs, which is determined by the intrinsic spectrum of VHE -rays, is:
| (24) |
In particular, if the intrinsic -ray spectrum is a power law in this energy band, with a photon index , then, since the dominant cooling mechanism is synchrotron radiation, the energy distribution of the secondary leptons is a power law with the index and the high energy part of the synchrotron spectrum is described by a power law with photon index . We note that even for a very hard intrinsic -ray spectrum of , the synchrotron emission of secondary pairs will be characterized by a photon index . Such behavior is expected at energies
| (25) |
For numerical calculations, we assumed the blob to be homogeneous. The pair production kernel, i.e. the energy distribution of secondary electrons produced by a -ray of a certain energy, was calculated using anisotropic differential pair production cross section convolved with boosted Planckian distribution and averaged over the initial -ray direction. The injection rate of electrons was calculated by convolving the pair production kernel with proton synchrotron spectrum multiplied by the factor . The energy distribution of electrons was calculated using the approximation of continuous losses accounting for dominant synchrotron losses only. The secondary synchrotron emission was calculated using the obtained distribution of electrons. The variability properties of this radiation component are related to the variability of the intrinsic -rays as well as to the to the change of their absorption rate.
3 Broadband spectra of 1ES 0229+200 and 3C 66A
To demonstrate the potential of the proposed model for the explanation of very hard intrinsic -ray spectra, we focused on two distant objects, namely 1ES 0229+200 () and 3C 66A (, though this value is debated, see e.g. Abdo et al., 2011). These two BLLacs have different -ray properties. In particular, 1ES 0229+200 shows VHE -ray emission without significant flux or spectral changes between two HESS measurements separated by one year (Aharonian et al., 2007). Moreover, Fermi LAT was not able to detect GeV emission from the direction of 1ES 0229+200. In the SED plot, the upper limit of the GeV flux appears below the TeV flux corrected for intergalactic absorption.
The blazar 3C 66A shows a variable VHE signal, as seen with VERITAS (Acciari et al., 2009; Abdo et al., 2011), with a Crab flux flaring episode. Fermi LAT collaboration reported a significant GeV -ray excess from the source. Moreover, an increase of the GeV flux simultaneously with the VHE flare was observed (Abdo et al., 2011). Importantly, the GeV flux level exceeds significantly the de-absorbed VHE flux, thus a smooth connection of these two radiation components with a single emission seems difficult to achieve, for the assumed redshift z=0.444.
To study the impact of EBL on the VHE spectra, we corrected the reported -ray spectra for intergalactic absorption using two versions of the EBL model by Franceschini et al. (2008): (i) as in the original paper (F1.0) and (ii) scaled up by a factor of 1.6 (F1.6). The latter case was considered in order to satisfy the lower limits claimed by Levenson & Wright (2008). This simple treatment of the EBL and the related calculations of intergalactic absorption allows us to ignore many details of different EBL models, and focus on the main objective of this paper, namely the explanation of hard intrinsic -ray spectra in blazars. Note that the two EBL templates used here cover a broad range of different realizations of the EBL described by recent theoretical or phenomenological models, at least as long as it concerns the calculated optical depths.
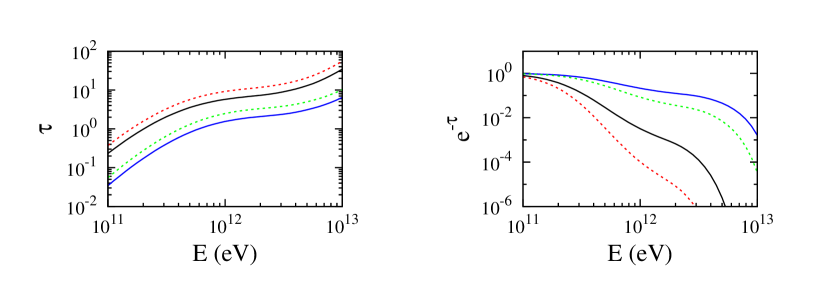
The optical depth for a high energy photon traveling through the intergalactic medium from a source at redshift to the observer, taking into account the cosmological distance and the EBL evolution, is
| (26) |
where is the cosmological line element; is the angle between the interacting photons; is the number density of the EBL as a function of redshift and soft-photon energy; and is the pair production cross section. In Fig. 2 the VHE -ray optical depths (left panel) and attenuation factors (right panel) for the two blazars are shown, for the two EBL levels: F1.0 (solid lines) and F1.6 (dashed lines). The calculated attenuation was used to reconstruct the initial spectra from the observed data by H.E.S.S. on 1ES 0229+200 (Aharonian et al., 2007) and by VERITAS on 3C 66A (Abdo et al., 2011). The resulting spectra are shown in Fig. 3 for 1ES 0229+200, and in Fig. 4 for 3C 66A. In both figures black points correspond to observed data, red points to the spectra reconstructed with the F1.0 EBL model, and blue points to the spectra reconstructed with the F1.6 EBL model.
The reconstructed spectra are significantly harder compared to the observed ones. In particular, in case of high EBL flux (F1.6), the spectra have and for 1ES 0229+200 and 3C 66A, respectively; i.e. they would be significantly harder than the conventional value of .
3.1 The case of 1ES 0229+200
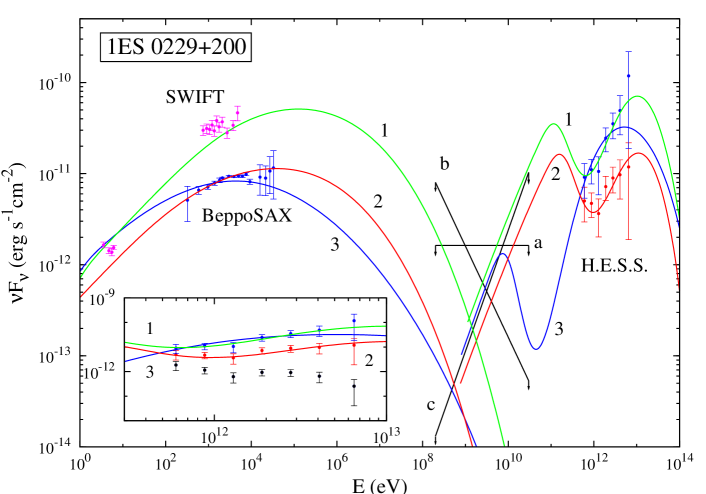
To study the case of 1ES 0229+200, we have combined the reconstructed VHE data with archive X-ray and optical data from SWIFT (Tavecchio et al., 2009) and BeppoSAX (Costamante et al., 2002), together with Fermi LAT observations (Abdo et al., 2009). The observational data are summarized in Fig. 3. We have applied the internal absorption scenario as described in Section 2 to reproduce the VHE spectrum together with X-ray spectrum, for both levels of intergalactic absorption and considering both indices of the power-law proton distribution ( and ).
In the case of a soft energy distribution of protons (), the flux upper limit obtained with Fermi requires a lower-energy cutoff () in the proton energy spectrum at very high energies, with both levels of EBL absorption. The exact location of this cutoff depends on different model parameters, e.g. intrinsic optical depth, Doppler boosting factor etc., but to satisfy the Fermi upper limits the resulting -ray spectral break should occur close to GeV. Thus, the cutoff in the proton spectrum should be located roughly at
| (27) |
This value is very close to the highest possible energy of the accelerated protons, thus the Fermi upper limits basically exclude the possibility of a proton spectrum significantly steeper than .
Since the VHE spectrum obtained from 1ES 0229+200 seems to show no significant changes on a yearly time scale, i.e. on a time scale much longer than the one defined by the cooling time (see Eq. 4), the proton spectrum is expected to be steady. A steady proton distribution with power-law index can be formed in two different ways: (i) with an almost mono-energetic continuous proton injection (e.g. through converter mechanism) in the fast synchrotron cooling regime; and (ii) with a conventional acceleration spectrum in the slow cooling regime. A very hard steady proton distribution with requires can be formed in the slow cooling regime when an acceleration mechanism similar to converter mechanism is responsible for the particle acceleration.
The resulting model parameters are summarized in Table 1 and the corresponding curves (Fits 1-3) are shown in Fig. 3.
3.1.1 F1.0 EBL level
In the case of the EBL level F1.0, the de-absorbed VHE spectrum has a photon index close to . For a proton distribution with , the proton synchrotron radiation below the peak has a photon index close to , i.e. formally it can explain the VHE data points without invoking internal absorption. Thus, in this case the key question is whether the internal absorption scenario can provide a consistent explanation of the X-ray component.
Given the strict upper limits provided by Fermi, which are at the level of the extrapolation in the HE band of the VHE spectrum, the available energy budget for the secondary pairs is quite limited, unless a higher emission can be effectively suppressed in the Fermi-LAT band. This could be achieved either by assuming a broad energy distribution of target photons extending to X-ray energies, so to provide a significant attenuation also in the GeV band, or by introducing a very high lower-energy cutoff in the proton distribution.
In absence of these two conditions, the X-ray synchrotron flux of the secondary pairs would be approximately an order of magnitude below the reported X-ray fluxes. Therefore, in this specific case, the internal absorption scenario requires additional ad-hoc assumptions to provide a self-consistent interpretation of the TeV and X-ray data.
3.1.2 F1.6 EBL level
In the case of high EBL flux (model F1.6), the de-absorbed VHE spectrum has a photon index close to , i.e. harder than the unabsorbed synchrotron spectrum from a proton distribution with index . Internal absorption allows the hardening of the TeV spectrum to the required level, but in the case of a conventional proton distribution the discrepancy with the Fermi-LAT upper limits is very strong. To avoid the conflict with Fermi-LAT data we need again to suppress the GeV emission, by introducing additional assumptions such as an effective absorption of GeV -rays (e.g. by X-rays) or a very high lower-energy cutoff (at TeV in proton energy). However, these assumptions can hardly be endorsed without an additional observational or theoretical justification.
On the other hand, a very hard proton distribution as predicted by the converter mechanism (Derishev et al., 2003) can accommodate the Fermi LAT upper limits. Even so, the synchrotron spectrum would not be sufficiently hard to explain the -ray spectrum corrected for the higher EBL flux (model F1.6). In this case the internal absorption becomes a key requirement to further harden the initial proton synchrotron spectrum (see Fits 1 and 3 in Fig. 3, and the corresponding parameters in Table 1).
The synchrotron radiation of secondary electron-positron pairs, calculated self-consistently with the hard VHE component, can explain the X-ray flux of 1ES 0229+200, with the caveat that the X-ray data are not simultaneous with the TeV observations. A characteristic feature of the secondary synchrotron radiation is its broad spectral extension up to hard X-rays. This prediction can be tested with hard X-ray instruments like Suzaku, or with future missions NuStar and Astro-H.
3.2 The case of 3C 66A
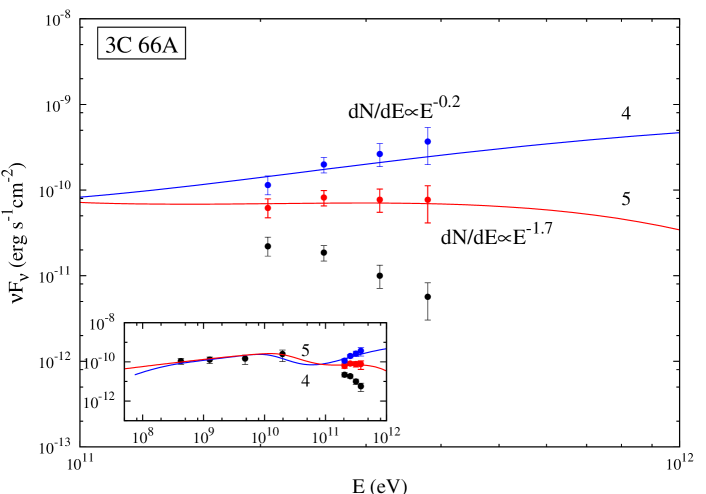
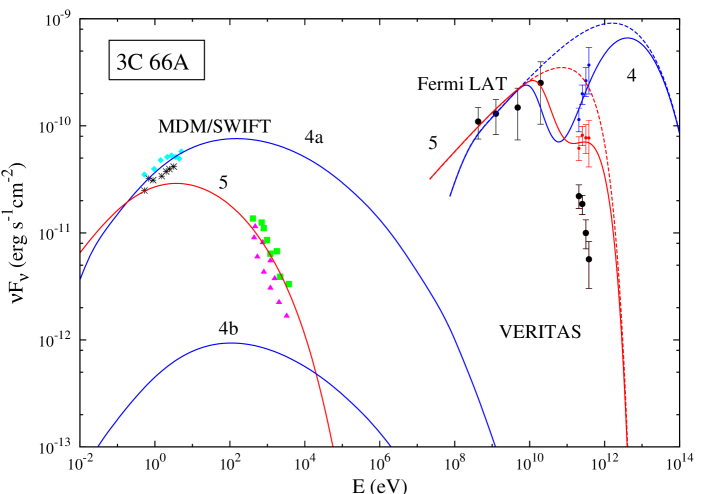
For the blazar 3C 66A, we have combined the VHE spectrum reported by VERITAS with the spectrum detected by Fermi-LAT during the VHE flare, together with the available X-ray/optical data from MDM and Swift (Abdo et al., 2011). The observational data are summarized in Fig. 4 and 5. We have applied the internal absorption scenario as described in Section 2 to fit the VHE spectrum, again considering both levels of EBL absorption (F1.0 and F1.6).
To correct for intergalactic absorption, the redshift for the source we adopted is the one most often cited and used in the literature, . It should be noted, however, that the redshift of this source is not yet firmly established, and thus one cannot exclude that the source is located closer. In particular, Prandini et al. (2010) suggested that the redshift should not exceed . This conclusion is based on the belief that the initial VHE -ray spectrum cannot be harder than the GeV spectrum measured with Fermi LAT. On the other hand, if the redshift is indeed , the TeV and GeV parts look quite different, and not part of a single component. Even though, this does not imply that they must be of different origin. In fact, our model can explain both components with a single proton population, as parts of the smooth proton synchrotron spectrum which is then deformed by the energy-dependent internal absorption.
3.2.1 F1.0 EBL level
In this case the de-absorbed TeV spectrum is rather flat, with photon index , while the HE component is characterized by a similar photon index but with at higher flux. A good agreement between the GeV and TeV spectra can be achieved assuming a proton energy distribution with power-law index .
A weak internal absorption (with maximum optical depth of about ) allows modification of the VHE spectrum to the required photon index (Fit 5 in Fig. 4), while the HE part is reproduced by the unmodified synchrotron spectrum. The synchrotron emission of secondary pairs can explain the X-ray spectrum obtained with Swift but not the optical MDM data, which require an additional radiation component.
The physical parameters used in this model may appear quite extreme (see Table 1, Fit 5). In particular, the very small value of the Doppler factor has been chosen to avoid -ray excess above TeV, and this consequently leads to a dramatic increase of the required energy budget. In fact, there is a more natural way to suppress the flux level above TeV, namely assuming a less efficient acceleration process. In this way the Doppler factor and B-field may be increased, while the required energy budget will be significantly reduced. The detail study of this possibility will be discussed elsewhere.
3.2.2 F1.6 EBL level
For the high EBL flux a very small photon index of is required. Remarkably, even such an unusual photon spectrum can be explained by internal absorption with a higher target photon temperature and slightly larger optical depth (see Fig. 4, Fit 4). With a certain combination of model parameters, the flux of the synchrotron radiation from secondary electrons can match the levels detected in the optical band, as is demonstrated in Fig. 5, Fits 4a and 4b. For a small production region, the main fraction of the secondary pairs are produced outside the blob. Their radiation is not Doppler boosted and, therefore cannot be detected. For the pairs produced inside the blob, the secondary synchrotron radiation is Doppler boosted and thus it can contribute significantly to the observed fluxes. We note, however, that for this source we did not succeed to find a combination of parameters which could explain both the optical and X-ray fluxes together, by synchrotron radiation of secondary electrons. Since the internal absorption scenario requires a significant attenuation of the VHE radiation over approximately two decades (see Figs. 3 and 5), the secondary synchrotron component has to be at least 4 decades broad (with additional broadening related to the relativistic motion of the production region). The strong magnetic field required in the proton synchrotron model provides fast cooling of the pairs, thus the radiation spectrum will be featureless, without a cooling break. In the case of a small radius of the production region, the effective particle injection in the blob may be rather narrow. But in this case the flux level would be significantly below the observed flux.
| 1ES 0229+200 | 3C 66A | ||||||
|---|---|---|---|---|---|---|---|
| Parameter | Fit 1 | Fit 2 | Fit 3 | Fit 4a | Fit 4b | Fit 5 | |
| -0.5 | -0.5 | -0.5 | 2.2 | 2.2 | 2 | ||
| 80 | 40 | 100 | 100 | 100 | 1.2 | ||
| 3 | 3 | 5 | 2 | 2 | 1.6 | ||
| 0.9 | 0.8 | 1.2 | 0.6 | 0.26 | |||
| 10 | 30 | 10 | 40 | 40 | 10 | ||
| 11 | 8 | 8 | 15 | 15 | 4 | ||
4 Summary
One of the most challenging issues of the physics of TeV blazars is the rather hard intrinsic -ray spectra of some representatives of this high-energy source population. Actually, the reported spectra themselves are steep, with photon indexes . However, the spectra of VHE -rays after being corrected for the energy-dependent intergalactic absorption become very hard, in some cases as hard as , assuming the EBL flux from Franceschini et al. (2008). Note however that some other recent models, in particular Dominguez et al. (2010), give very similar results. Explanation of such spectra faces serious difficulties within the standard blazar models. Moreover, even a slight increase of the EBL flux at optical and near IR wavelengths compared to the benchmark models (which, given the significant uncertainties in the derivation of the EBL fluxes, cannot be excluded) results in unusually hard intrinsic spectra with .
In this paper we studied the applicability of the idea of internal absorption of -rays produced by highly magnetized blobs as a result of synchrotron radiation of protons. While the main aspects of the model have been developed and discussed in our previous paper (Aharonian et al., 2008), in this work we tried to understand whether the model can be applied to specific objects. For this purpose, we have chosen two ”difficult” representatives of this source population, 1ES 0229+200 and 3C 66A, and allowed the EBL flux to be somewhat higher than the lowest possible fluxes. In particular, for the EBL level consistent with the lower limit around claimed by Levenson & Wright (2008), the intergalactic - de-absorption of the VHE flux detected from 3C 66A during a flaring episode results in an extremely hard spectrum, with photon index . While such a hard spectrum cannot fit into any existing VHE -ray production model, the scenario of internal absorption of -rays produced via synchrotron radiation of protons provides a reasonable explanation of both the hard TeV spectrum and the high GeV flux observed during the flare.
In the case of 1ES 0229+200, the internal absorption scenario calls for an extremely hard proton distribution, which can be provided for example by the “converter mechanism” (Derishev et al., 2003). The synchrotron radiation of secondary electron-positron pairs produced inside the blob results in an additional (Doppler boosted) radiation component, which can provide a self-consistent interpretation of the non-thermal X-ray emission in both objects. However, since in the framework of the internal absorption scenario the secondary synchrotron component is expected to be quite broad and featureless, we failed to find a set of parameters which explains simultaneously both the optical and X-ray data obtained from 3C66A.
The intrinsic absorption scenario allows a natural explanation of the very hard intrinsic TeV spectra at the cost of a large attenuation of the -ray flux around 100 GeV. Quite remarkably, despite the significant attenuation, this scenario does not enhance too dramatically the required energy budget. Indeed, since the correction for intergalactic absorption requires the initial -ray spectra to be very hard to begin with, with a photon index , the energy requirement to reproduce such a spectrum is determined by the highest energy part of the spectrum, which is not affected by internal absorption. Typically, the enhancement of the energy budget introduced by internal absorption does not exceed a factor of 5, which can be easily compensated by a slightly enhanced Doppler boosting of the radiation. Therefore the required intrinsic -ray luminosities remain quite modest (see Table 1). Given the very high (almost 100%) efficiency of conversion of the proton energy to -rays through the synchrotron radiation in the magnetized blob, the suggested scenario can be treated as quite effective.
It is apparent that the interpretation of very hard -ray spectra by the internal absorption depends on the ”right” choice of several model parameters, especially if we want to explain the X-ray data by synchrotron radiation of secondary electrons. Nevertheless, we should note that the level of hardening of the VHE -ray spectrum depends, in fact, only on the temperature of the photon field and the optical depth. On the other hand, while the flux ratio of the VHE - and X-ray components depends mainly on the size of the production area, the location of the secondary synchrotron peak is sensitive to the strength of the magnetic field, to the photon temperature and the bulk Lorentz factor. Finally, we note that certain radiation features of the scenario do not depend on the model parameters at all. This concerns, in particular, the slope of the -ray spectrum at GeV energies, and the shape of the X-ray spectrum.
The dependence of the results of radiation properties on several parameters limits, to a certain extent, the predictive power of the suggested model. This is a consequence of complex environment in blazars where several radiation and absorption processes can proceed simultaneously. In this regard, the often used one-zone models with consideration of only synchrotron and IC radiation components produced in the same region, are quite useful for understanding the basic aspects of the problem, but can hardly properly describe the complex scenarios that take place in blazars. In particular, the results of this paper demonstrate that the internal absorption not only cannot be a priory excluded from the consideration, but, in fact, in some cases can be invoked for better explanation of observations of TeV -ray blazars.
References
- Abdo et al. (2009) Abdo, A. A., et al. 2009, ApJ, 707, 1310
- Abdo et al. (2011) —. 2011, ApJ, 726, 43
- Acciari et al. (2009) Acciari, V. A., et al. 2009, ApJ, 693, L104
- Aharonian et al. (2006) Aharonian, F., et al. 2006, Nature, 440, 1018
- Aharonian et al. (2007) —. 2007, A&A, 475, L9
- Aharonian (2000) Aharonian, F. A. 2000, New Astronomy, 5, 377
- Aharonian et al. (2008) Aharonian, F. A., Khangulyan, D., & Costamante, L. 2008, MNRAS, 387, 1206
- Aliu et al. (2009) Aliu, E., et al. 2009, ApJ, 692, L29
- Bai et al. (2009) Bai, J. M., Liu, H. T., & Ma, L. 2009, ApJ, 699, 2002
- Begelman et al. (2008) Begelman, M. C., Fabian, A. C., & Rees, M. J. 2008, MNRAS, 384, L19
- Costamante et al. (2009) Costamante, L., Aharonian, F., Buehler, R., Khangulyan, D., Reimer, A., & Reimer, O. 2009, ArXiv e-prints
- Costamante et al. (2002) Costamante, L., Ghisellini, G., Celotti, A., & Wolter, A. 2002, in Blazar Astrophysics with BeppoSAX and Other Observatories, ed. P. Giommi, E. Massaro, & G. Palumbo, 21–+
- Derishev et al. (2003) Derishev, E. V., Aharonian, F. A., Kocharovsky, V. V., & Kocharovsky, V. V. 2003, Phys. Rev. D, 68, 043003
- Dominguez et al. (2010) Dominguez, A., et al. 2010, ArXiv e-prints
- Franceschini et al. (2008) Franceschini, A., Rodighiero, G., & Vaccari, M. 2008, A&A, 487, 837
- Gould & Schréder (1967) Gould, R. J., & Schréder, G. P. 1967, Physical Review, 155, 1408
- Hauser & Dwek (2001) Hauser, M. G., & Dwek, E. 2001, ARA&A, 39, 249
- Hauser et al. (1998) Hauser, M. G., et al. 1998, ApJ, 508, 25
- Katarzyński et al. (2006) Katarzyński, K., Ghisellini, G., Tavecchio, F., Gracia, J., & Maraschi, L. 2006, MNRAS, 368, L52
- Kneiske & Dole (2010) Kneiske, T. M., & Dole, H. 2010, A&A, 515, A19+
- Krennrich et al. (2008) Krennrich, F., Dwek, E., & Imran, A. 2008, ApJ, 689, L93
- Levenson & Wright (2008) Levenson, L. R., & Wright, E. L. 2008, ApJ, 683, 585
- Liu & Bai (2006) Liu, H. T., & Bai, J. M. 2006, ApJ, 653, 1089
- Liu et al. (2008) Liu, H. T., Bai, J. M., & Ma, L. 2008, ApJ, 688, 148
- Madau & Pozzetti (2000) Madau, P., & Pozzetti, L. 2000, MNRAS, 312, L9
- McBreen (1979) McBreen, B. 1979, A&A, 71, L19
- Nikishov (1962) Nikishov, A. I. 1962, Sov. Phys. JETP, 14, 393
- Prandini et al. (2010) Prandini, E., Bonnoli, G., Maraschi, L., Mariotti, M., & Tavecchio, F. 2010, MNRAS, 405, L76
- Primack et al. (2008) Primack, J. R., Gilmore, R. C., & Somerville, R. S. 2008, in American Institute of Physics Conference Series, Vol. 1085, American Institute of Physics Conference Series, ed. F. A. Aharonian, W. Hofmann, & F. Rieger, 71–82
- Reimer (2007) Reimer, A. 2007, ApJ, 665, 1023
- Reyes et al. (2009) Reyes, L. C., for the Fermi LAT collaboration, & the VERITAS collaboration. 2009, ArXiv e-prints
- Sitarek & Bednarek (2008) Sitarek, J., & Bednarek, W. 2008, MNRAS, 391, 624
- Tavecchio & Ghisellini (2008) Tavecchio, F., & Ghisellini, G. 2008, MNRAS, 386, 945
- Tavecchio et al. (2009) Tavecchio, F., Ghisellini, G., Ghirlanda, G., Costamante, L., & Franceschini, A. 2009, MNRAS, 399, L59
- Tavecchio & Mazin (2009) Tavecchio, F., & Mazin, D. 2009, MNRAS, 392, L40
- Zirakashvili & Aharonian (2007) Zirakashvili, V. N., & Aharonian, F. 2007, A&A, 465, 695