Overlapping abundance gradients and azimuthal gradients related to the spiral structure of the Galaxy
Abstract
The connection between some features of the metallicity gradient in the Galactic disk, best revealed by Open Clusters and Cepheids, and the spiral structure, is explored. The step-like abrupt decrease in metallicity at 8.5 kpc (with = 7.5 kpc, or at 9.5 kpc if = 8.5 kpc is adopted) is well explained by the corotation ring-shaped gap in the density of gas, which isolates the internal and external regions of the disk one from the other. This solves a long standing problem of understanding the different chemical characteristics of the inner and outer parts of the disk. The time required to build up the metallicity difference between the two sides of the step is a measure of the minimal life-time of the present grand-design spiral pattern structure, of the order of 3 Gyr. The plateaux observed on each side of the step are interpreted in terms of the large scale radial motion of the stars and of the gas flow induced by the spiral structure. The star-formation rate revealed by the density of open clusters is maximum in the Galactic radial range from 6 to 12 kpc (with an exception of a narrow gap at corotation), coinciding with the region where the 4-arms mode is allowed to exist. We argue that most of the old open clusters situated at large galactocentric radii were born in this inner region where conditions more favorable to star-formation are found. The ratio of -elements to Fe of the sample of Cepheids does not vary appreciably with the Galactic radius, which reveals an homogeneous history of star formation. Different arguments are given showing that usual approximations of chemical evolution models, which assume fast mixing of metallicity in the azimuthal direction and ignore the existence of the spiral arms, are a poor ones.
keywords:
Galaxy: Abundances, Galaxy: Evolution, Galaxy: Structure, Stellar Dynamics1 Introduction
The variation of the abundance of chemical elements as a function of radius in the Galactic disk provides constraints to star formation history in the disk and to basic assumptions made in chemical evolution models. Several reviews have been published recently, focusing in different chemical elements like Iron or -elements, and in different tracers like Open Clusters, Cepheids, HII regions, etc., see e.g. the series of papers by Andrievsky and collaborators from 2002 to 2005, Rudolph et al. (2006), Pedicelli et al. (2009), and Magrini et al. (2009), among others. In the past, the metallicity gradients were most often fitted by straight lines in logarithm of abundance versus Galactic radius plots, with slopes of about -0.07 dex/kpc. This ”first order” approximation did not pose severe constraints to chemical evolution models, since many important parameters of the models, like gas density and infall rate of matter are supposed to be smoothly decreasing functions of the Galactic radius (Chiappini et al. 1997). However, evidences have accumulated that a single slope approximation (or two slopes, in the last reference) is not satisfactory, since it hides more complex slope changes that are real and should be better understood. For instance, the series of papers reporting observations of Cepheids by Andrievsky and collaborators showed that the slope of the abundance gradient is larger than average around 5-6 kpc from the center, followed by a plateau from about 6.5 kpc to 10 kpc, and then by a new decrease at about 10 kpc (here we quote the Galactic radii as given in the original papers). As another example, Twarog et al. (1997)(hereafter TAAT) analyzing a sample of Open Clusters, have found that the Galactic metallicity gradient can be described in terms of two zones with flat slopes: an inner disk with radii ranging from 6 to 10 kpc and an outer disk for radii larger than 10 kpc. These two zones are separated by a step-like discontinuity of about 0.3 dex in [Fe/H]. Finally, Carney et al. (2005) and Carraro et al. (2007) found that the metallicity gradient is totally flat in the outer disk. All these results are in conflict with the old view of an unique and constant slope, however, they are not inconsistent with each other, as it will be shown in this work.
These changes of slope and step-like behavior of the gradients merit great attention since they provide a much deeper understanding of the disk evolution and impose real constraints to the existing models. In particular, we believe that the effect of the spiral arms cannot be ignored in chemical evolution models, as it has most often been done. The spiral arms are the star-forming machines of the disk, and are the places where the youngest stars (O, B stars and HII regions) are found. The massive stars are those which have the most important role in chemical evolution. Furthermore, when one integrates the orbits of Open Clusters in the Galactic potential for a time equal to their age, one finds that they were born in the spiral arms (Dias & Lépine 2005). This is a confirmation that almost all stars are born in the arms. The spiral arms obey a number of rules dictated by the resonances between the epicycle frequency (the frequency of oscillation of a star around its non-perturbed circular orbit) and the frequency of rotation around the Galactic center, as observed in the frame of reference of the spiral pattern . Among the major resonances are the inner and the outer Lindblad resonances (ILR and OLR, or 2:1 resonances), situated where . According to the classical theory of galactic spiral waves proposed by Lin & Shu (1964) and Lin et al. (1969), the spiral arms are restricted to the interval between these two resonances, so that an important change in the star-formation rate could be expected at the corresponding radii. For other theories in which the spiral arms are explained by the crowding of stellar orbits, the ILR and OLR have the same nature and are equally important (Kalnajs, 1973). The 4:1 resonances, which appear where , are the equivalent of the ILR and OLR for 4 arms; in principle a 4-arms structure could only exist between these two resonances. A stellar orbit at a 4:1 resonance presents 4 maxima of the radius during one revolution around the center, which gives it the aspect of a square orbit with rounded corners.
Another major resonance is corotation, situated where the rotation speed of the material of the disk coincides with that of the spiral pattern (). This maximizes the effect of the potential perturbation of the spiral arms on the stars and gas clouds in this region. The spiral arms are able to produce systematic radial transfer of interstellar gas with opposite directions on the two sides of corotation, and to create a ring with a void of gas at this resonance, as it will be discussed later in this paper.
A matter of concern is that it has been pointed out by several authors who analyzed the metallicity gradients in the Galactic disk that deviations of individual measurements from the average slope are often found to be larger than individual errors on the measurements (e.g. Yong et al. 2005, Carraro et al. 2007). This challenges the usually accepted hypothesis that the metallicity must have a single value at any given radius (or, equivalently, that the azimuthal diffusion is very fast). It is important to analyze the non axis-symmetric variations of metallicity, and if they are confirmed, to verify if they are related to the spiral structure, or alternatively, if random local variations in metallicity do exist.
In the present paper we analyze the connection of variations in the abundances of elements with resonances of the spiral structure like the 4:1 resonance, corotation and OLR. The radii of these resonances, at least for the main spiral structure, is no more uncertain as they were in the past; they are now known with accuracy of the order of 0.2 kpc, as discussed by Lépine et al. (2010), hereafter L+5. We adopt, for corotation, = 8.4 kpc, combined with a solar orbit with = 7.5 kpc. The reasons for the choice the ”short scale” for are discussed in Section 3. The value of results from the nice agreement between parameters directly determined, such as the rotation speed of the arm pattern, measured by integration of the orbits of Open Clusters, the radius of the ring-shaped gap in the Galactic disk (associated with corotation), and the observation of the position of the 4:1 resonance. One can find in the literature a number of determinations of the corotation radius that are in conflict with these measurements. However, we must be conscious that numerical N-body simulations, hydrodynamical simulations and chemical evolution models depend on a series of assumptions of unknown parameters and on simplified hypotheses, so that their results cannot be regarded as being as precise as those of direct measurements. For instance, in a recent work by Acharova et al. (2010), a chemical evolution model gave a best fit to the metallicity plateau of Cepheids with corotation at 7 kpc (which would be about 6.6 kpc in the shorter scale adopted here). However, it was left clear in the mentioned paper that this result could not be regarded as a determination of the corotation radius.
We are aware that dynamical measurement of the pattern speed of the spiral structure, based on the location of the Hyades and Sirius moving groups in velocity space (Famaey et al. 2005, 2007), placed the corotation at a radius kpc (Quillen & Minchev 2005, Pompéia et al. 2011). This could perhaps be reconciled with the present findings in the case of the existence of multiple spiral patterns with different pattern speeds; while the main grand-design spiral pattern has its corotation at 8.4 kpc, and is responsible for the plateau in the metallicity gradient as well as for the ring-shaped gap in the density of gas, it could coexist with an outer m=2 pattern whose 4:1 inner resonance smoothly connects with the corotation of the main pattern. This is what happens in the N-body simulations of Quillen et al. (2010). While the corotation of the main spiral pattern would not have a large effect on the local velocity distribution of stars in the solar neighbourhood, the 4:1 inner resonance of that slower outer pattern would be responsible for the observed substructures. The corotation of this outer spiral pattern would then be located at about kpc, near the OLR of the main structure, and could also contribute to a gap which seems to exist in the distribution of clusters at this radius, and will be discussed in this paper. We restate, however, that although we wish to keep open the possibility of a second pattern speed, all the analysis in this paper is based on what we call the main structure, with corotation at 8.4 kpc.
The accuracy now reached by direct measurements of the radii of resonances of the main structure allows us to perform detailed comparisons between the features of abundance variations and the Galactic spiral structure. This is the main focus of the present paper, which is organized as follows. In Section 2 we analyze the expected ranges of radii covered by orbits of stars, to estimate how far from their birthplace young tracers can be found. This is a theoretical background needed for a better understanding of the abundance plateaux that are discussed later in the paper. In the subsequent two sections we present the data of the abundance tracers that have the most precise distances: Open Clusters (Section 3) and Cepheids (Section 4). In Section 5 we examine a departure from axis-symmetry in chemical abundance that we call azimuthal gradient, and we comment an extra-galactic example of non-axissymmetric gradients which looks like the ”overlapping” gradients that we believe to exist in the Galaxy. In Section 7, from the observation of the step-like decrease of metallicity at corotation, we derive a lower limit to the life-time of the spiral structure.
2 Range of radii swept by stars
We review here the basic rules that regulates the range of radii swept by the orbits of stars or Open Clusters in the Galaxy.
A typical orbit is shown in Figure 1. This orbit was obtained by numerical integration for a star with initial velocity 40 km/s in excess with respect to circular rotation at the initial radius. If we are interested on the radial motion only, there is a classical solution which consists in introducing an effective potential governing the radial motion of a particle of a given angular momentum in a central force field. The effective potential is the sum of the original central potential plus a rotational energy given by , where is the mass of the particle and its distance from the center. Figure 2 shows two examples of effective potential curves, with different angular momentum of the star. The Galactic potential is obtained by integration of the rotation curve of the Galaxy (the gravitational force is equal to , where is the rotation curve). We arbitrarily set the potential equal to zero at a large distance (we used 60 kpc). Note that adding an arbitrary constant to the potential energy curves does not change the dynamics of the stars, since we are not investigating the escape probability and we restrict our study to orbits with small perturbation energy. In the figure, a dot represents the radius of minimum energy (circular orbit), and the dashed lines show the range of radius swept by the star for a not too large perturbation.
Lépine et al. (2008) presented an histogram of the perturbation velocities of the Open Clusters (the residual velocity after subtracting the velocity of the rotation curve). The histogram presents a peak at about 15 km/s, and extends to about 50 km/s. The ranges of radii illustrated in Figure 2 were computed with a perturbation velocity of 40 km/s, so that they are close to the maximum observed range. The most important result is that the stars travel between their normal maximum and minimum Galactic radius in a time shorter than one revolution around the Galactic center. Another mechanism capable of producing changes in the Galactic radius of stars is the scattering by the corotation resonance. This was investigated in detail by Sellwood & Binney (2002) and Lépine et al. (2003), showing that the scattering is able to impart larger radial amplitudes, but it requires a longer time to be effective, compared to the normal epicycle oscillations described previously.


3 Gradients based on Open Clusters
Our analysis of metallicities of Open Clusters is based on two different samples, which were constructed using different criteria to select the results from the literature. The first sample only includes [Fe/H] measurements obtained with high-resolution spectroscopy. This is basically the same sample of 45 object collected by Magrini et al. (2009), updated with a few recent observations. These include NGC 6633, NGC 2539, NGC 2447, IC 2714 and NGC 5822 (Santos et al., 2009), NGC 7160 Monroe & Pilachowski (2010), CR110, NGC 2099, NGC 2024 and NGC 7789 (Pancino et al., 2010), Tombaugh2 (Villanova et al., 2010). Two measurements presented by Gratton (2000), of IC4725 and NGC6087, although not so recent, were added to this sample.
The second sample contains metallicity derived from spectroscopy as well as from photometry and other methods. These data are less reliable, and their use is justified by the larger number of measurements available (131 compared to 58 for the first sample). This second sample is based on the on-line version of the New Catalogue of Optically visible Open Clusters and Candidates published by Dias et al. (2002), and often updated111Available at the web page . This catalog contains a list of 153 clusters with available metallicity measurement, and gives the adopted reference for each entry, as well as the method of observation and estimated error. The metallicity indicator used is [Fe/H], usually given in the original references. However, in a few cases the metallicity included in the catalog is , from which the Fe abundance can be recovered using the relation [Fe/H] = log (Z/0.019) (see Carraro et al., 1999).
Minor changes or updates were performed for a number of objects, often giving preference to metallicity and distance from the same author. For NGC 2168 we adopted the distance given by Pöhnl & Paunzen (2010)(0.8 kpc); for NGC 2489, the distance given by Piatti et al. (2009) (1.8 kpc); for NGC2335, the same distance used by TAAT (1.15 kpc); for NGC188, the distance given by Meibom et al. (2009) (1.77 kpc), and for NGC2360, the distance given by Hamdani et al. (2000) (1.09 kpc); for Berkeley 20 and Collinder 261, we used the data of Sestito et al. (2008); for Berkeley 31 the distance by Yong et al. (2005) (5.3 kpc); for IC4756, NGC 2682 and NGC 3680, the [Fe/H] data of Santos et al. (2009).
In the analysis of this second sample, we only make use of data with errors smaller than 0.2 dex in [Fe/H]. A number of authors do not give an error estimate (see the on-line catalog), but we adopt an error estimate of 0.1 dex based on the similarity of the technique with other work. Data of Ann et al. (2002) are an exception, for which we believe that the error is larger than the limit adopted here, because some discrepancies were found in two Open Clusters that are in common with Hasegawa et al. (2004), and because for some clusters it seems that is given instead of [Fe/H], which is not clear. The data from Hasegawa et al., (not included in the on-line catalog), on their turn, are not included because the error estimated by the authors is 0.3 dex. The error on the metallicity of Berkeley 21 (the Open Cluster with the lowest metallicity) is about 0.3 dex (Tosi et al., 1998), and that of NGC6451 is about 0.5 dex (Paunzen et al., 2003). It should be noted that our procedure of eliminating objects with large errors on metallicity has affected more severely objects with [Fe/H] -0.5; it may happen that our sample is biased in showing only few clusters with very low metallicity. Note that there is a large overlap in the list of clusters between the high-quality sample (first sample) and this one.
For both samples (high-resolution, and general) we re-computed the galactocentric distances of all the objects using = 7.5 kpc instead of the IAU recommended value 8.5 kpc. This is a more realistic estimate of , as for instance the (preferred) Models 1 and 2 from Table 2 of McMillan & Binney (2010) assume and 7.8 kpc respectively. A higher value of would imply an unrealistically high circular speed. See also the recent work of Sofue et al. (2011). But the use of this shorter scale is not something new in the literature, since many specialists in the Galactic distance scale recognized that is about 7.5 kpc; see the reviews by Fich & Tremaine (1991) and by Feast (2008), or the papers by Glushkova et al. (1999) and others of the same group. It is preferable to use this value of when precise distances in different directions are to be compared, like for instance when stellar distances are compared with the position of resonances.
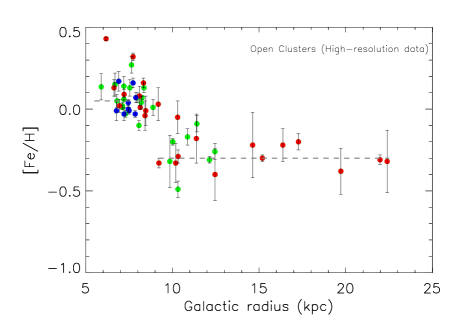
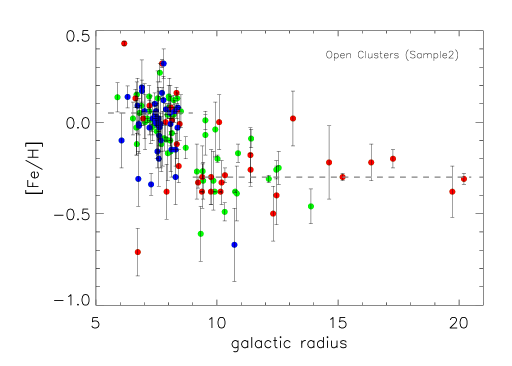
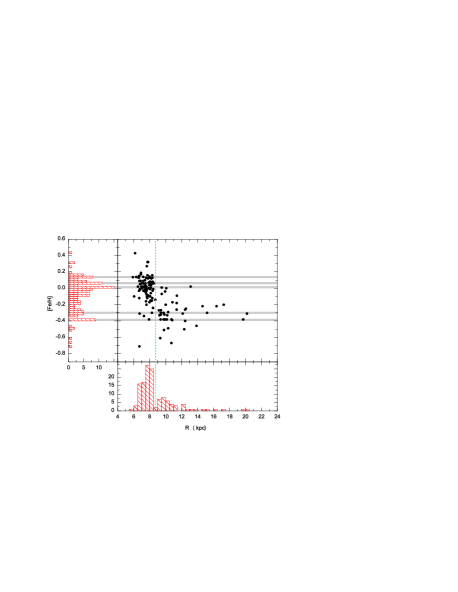
In Figure 3 we present [Fe/H] as a function of galactocentric distance, for the sample of Open Clusters with high-quality measurements. The data of the second sample (lower quality but larger sample) are presented in a similar way in Figure 4. In both figures different colors were used to indicate young, intermediate age and old Clusters. In Figure 5 the same data of Figure 4 (larger sample)is presented with histograms on the two axes.
3.1 The step and the gap at corotation
The first remark to be done is that the step in the Fe abundance first observed by TAAT is confirmed; it appears clearly in Figure 3 which presents high-quality data that were not available at the epoch of TAAT’s paper. The height of the step is about 0.3 dex. The Galactic radius at which it is observed (8.5 kpc) is the same found by TAAT after correction for the different values of . In addition to the step, one can see a gap in the distribution of clusters at Galactic radius 8.5 kpc, which is clearer in Figure 4 and in the lower histogram of Figure 5, due to the larger number of Clusters plotted in these figures. The radius of the gap coincides with corotation and with the Cassini-like ring-shaped region void of gas discovered by Amôres et al. (2009). The gap in the distribution of clusters tells us that the star formation is hindered in the region of gas void, while the step in the metallicity distribution indicates that the gas void forms a barrier that has prevented the transportation of gas from one side to the other, so that the metallicity evolved independently on the two sides.
3.2 The flatness of the external gradient and cluster ages
The metallicity distribution as a function of radius confirms that the metallicity gradient is flat in the outer part of the disc, a fact which was observed by many authors, among them TAAT, Carney et al. (2005), Yong et al. (2005), Carraro et al. (2007) and Magrini et al. (2009). There was not yet a consensus on where the flat part begins, but from Figures 3 to 5 it seems clear that the radius at which the ”base level” of metallicity of the outer disc starts is the corotation radius.
In Figure 3 and 4 we separated the Open Clusters in 3 groups of age, the young ones (age 200 Myr), intermediate (200 age 1200 Myr) and old (age 1200 Myr). One can see that there is no young cluster with [Fe/H] smaller than about -0.3 dex, on the inner side of corotation. The young clusters present are IC 2581, NGC 2343 e NGC 6716. Surprisingly, many metal-rich clusters with [Fe/H] about 0.1 dex are observed in the same range of Galactic radius. This indicates that large metallicity differences are present in the gas situated at different azimuthal directions in a same interval of Galactic radius, which suggests that a fast mixing of the gas in the azimuthal direction, usually assumed in chemical evolution models, is a poor approximation.
There is only one young cluster beyond corotation in Figure 4, Dolidze 25. This brings the question: at what Galactic radius does star formation stop? Star formation tracers like HII regions, compact HII regions revealed by CS emission and other tracers are seen up to about 14 kpc, e.g. see L+5 and Vázquez et al. (2008). In Figure 3 and even in Figure 4 we are working with small samples of objects with well measured metallicity, so that we should not conclude from these samples that young clusters do not exist at larger radii.
In Figure 6 we examine the age versus Galactic radius relation of the larger sample of clusters (1266 objects extracted from the web page of Dias et al. (2002)) which have measured distance and age, without any other requirement (for this study the existence of high-resolution spectrometry is not so relevant). This figure confirms that young clusters, if they exist, are very rare beyond 14 kpc. The most distant object among the young clusters (in the lower part of the Figure 6) is Teutsch 45, at Galactic radius 14.3 kpc, which presents, however, a large error on distance ( 1.6 kpc). Other objects which were previously believed to have similar Galactic radii, like Dolidze 25 and NGC 1893, had their distance corrected based on recent publications (Delgado et al., 2010, Prisinzano et al., 2011). We note however that Carraro et al. (2010) report the detection of diffuse groups of young stars in the third quadrant of the Galaxy, at distances between 14 and 19 kpc (converted to our short scale). The estimated distance of VdB-Hagen 4, which contains B stars, is of the order of 19 kpc. Similarly Moitinho et al. (2006) detected ”blue plumes”, which are groups of young stars up to distances of 16 kpc (in our scale) in the third quadrant of the Galaxy (the other ”normal” clusters listed by the same authors are already included in the cluster database that we presented).
The flatness of the gradient of the outer disk (Figures 3 and 4) deserves an explanation. One possibility is the flow of gas from corotation to the external regions, which is a consequence of the interaction of the gas with the spiral potential perturbation. The radial flow is predicted theoretically and confirmed by hydrodynamical simulations (Mishurov, 2000, Lépine et al., 2001). This flow transports the relatively high metallicity gas of the corotation zone towards outer regions, and flattens the gradients.
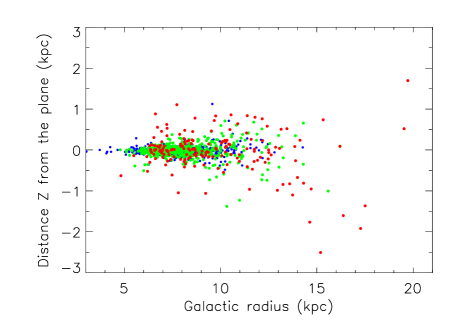
Another possible reason for the flatness of the gradients is that a large fraction of the clusters that are presently observed at galactocentric distances of 15 to 20 kpc were born at smaller distances. This is naturally expected based on the discussion presented in Section 2. As we move towards larger radii, the curves representing the effective potential (Figure 2) become shallower, and for the same perturbation energy, the clusters cover a larger Galactic radius range. This hypothesis aims to explain why there are no (or almost no) young clusters beyond about 14 kpc. The conditions for star formation (probably, the gas density) are not fulfilled at large radii; the age of the clusters situated there is sufficiently large to allow them to be born in an inner radius and to have traveled to their present position. An additional argument in favour of the hypothesis that the outer clusters are travelers born in inner regions is their distribution in Galactic component (direction perpendicular to the Galactic plane), shown in Figure 7. Simple integration of orbits of stars (or clusters) in the Galactic gravitational potential shows that if they are launched from a radius of 12 kpc, when they reach a radius about 18 kpc, their coordinate can easily reach values of the order of 2 kpc, similar to the observed scale height. In such experiments the same initial velocity perturbations in the direction required to explain the local (solar neighbourhood) scale height is used. Since the gravity of the disk decreases with Galactic radius, the amplitude of the oscillation in the direction increases, if a star moves outwards. The good match of the scale-heights points towards a common origin of the velocity perturbations. The smooth increase of average age with distance seen in Figure 6 is also an argument in favour of the ”travelling clusters” hypothesis. Note, however, that there are indications that the two outermost old Open Clusters, Berkeley 29 and Saurer 1, are of extragalactic origin (Carraro & Bensby, 2009).

3.3 A possible zone of enhanced star-formation efficiency between the 4:1 resonances
Does the 4:1 resonance have any visible effect on the star-formation rate? This resonance, which is the ILR of the 4-arms structure, as previously discussed, is at 6.2 kpc, see L+5. Since our Galaxy has a strong 4-arms component, the frontier of the region where 4 arms are allowed to exist with the region with only 2 arms is in principle an important boundary. The star-formation machine (the spiral arms) and the mechanism that produces the inflow of gas have their power increased beyond that radius due to the larger number of arms. All the higher resonances, some of them possibly having associated spiral arms, are situated between the 4:1 resonance and corotation. Indeed, both the lower histogram in Figure 5, and Figure 6, which exhibits a larger sample of clusters, show a strong increase in the density of clusters at about 6.2 kpc. Of course, the interstellar extinction could be a cause of the cut-off in the counts of clusters at Galactic radius about 6 kpc. However, the 4:1 resonance is only 1.3 kpc from the Sun, which corresponds to a visible extinction a little larger than 1 magnitude in the direction of the Galactic center. In the opposite direction, many clusters are observed at Galactic radius 12 kpc, which is much farther from the Sun (5.5 kpc). Therefore, the abrupt increase in the density of clusters beyond 6 kpc seems to be real, not an effect of extinction. It can be seen in Figure 6 that there are much more Clusters on the right side of the vertical line at 9 kpc than on the left side of the line at 6 kpc, although the two lines are equidistant from the Sun. The outer 4:1 resonance () is situated at 12 kpc. For the same reasons we could expect a decrease of the star formation rate and cluster counts beyond that radius. However, the frontier does not seem to be so well defined in this case. The probable reason is that the completeness of the sample of clusters is smaller, at distances of about 5.5 kpc. Nevertheless, it seems that the Galactic radius interval 6 to 12 kpc, the region between the two 4:1 resonances, except for the corotation gap, is a privileged zone for star formation. As we discussed, the old clusters situated at large distances possibly originated in the 6-12 kpc zone, and also most of the intermediate-age clusters situated in the neighbouring region 12-14 kpc could possibly be born inside the 12 kpc radius.
At 12 kpc there is some indication of a minor gap in the distribution of clusters (see eg the histogram in Figure 5). In the alternative interpretation of the spiral structure discussed in the introduction, in which a secondary pattern speed coexists with the main one, 12 kpc is the radius of corotation of the outer pattern. Some of the properties of the distribution of clusters could also be explained by this interpretation.
3.4 Fine structure of the metallicity distribution
Another interesting aspect of the metallicity gradients shown in Figures 3 to 5 is that they present concentrations of clusters around a number of horizontal (constant metallicity) lines. Some of the peaks of the histogram on the left side of Figure 5 seem to be significant. For instance the peak at 0.15 dex also corresponds to a group of Clusters with the same metallicity in the sample with only high-quality measurements shown in Figure 3. We prefer to postpone the discussion on concentrations of metallicities around preferential values to the later section on Cepheids, since the metallicities of these stars, which form a completely independent sample, confirm our statement. We remark that in Figures 4 and 5 several old clusters situated inside the corotation radius have high metallicities ([Fe/H] 0.15 dex), which are larger than the average value for young clusters. This poses the interesting question: is the metallicity in the solar neighbourhood decreasing with time (more recent clusters have smaller metallicities) or did the old clusters situated around the solar radius have born in inner regions of the Galaxy? Still another possibility would be to associate this observation with the azimuthal differences in chemical abundances, that are disussed in a later section. This question shows again the importance of taking into account the radial motion of the tracers to understand the metallicity gradient.
In Figure 6 one can see a concentration of clusters with age years; this can be interpreted as a rounding effect in the papers reporting ages, rather than an evidence for a star-formation episode. It should be remembered that the large sample presented in that figure (1266 objects) contains data with non-uniform quality.
We will not discuss here the abundances of -elements in Open Clusters, as only a small number of clusters have been measured. The -elements can be better analyzed based on the sample of Cepheids, discussed in the next section.
4 The gradients based on Cepheids
An impressive set of metallicity data for 130 Cepheids, with abundances derived for many elements based on high resolution spectra, is presented in the series of papers by Andrievsky and collaborators: Andrievsky et al. (02 a, 02 b, 02 c), Luck et al. (2003), Andrievsky et al. (2004), Kovtyukh et al. (2005), Luck et al. (2006). These data constitute the main source for the present analysis. The range of Galactocentric distances covered by the sample is 4 to 16 kpc.
We revised the distances of the Cepheids to the Sun given in those papers as next explained, and subsequently re-computed the galactocentric distances using =7.5 kpc, as it was done for the Open Clusters. The stellar distances in the original papers on metallicity measurements were usually taken from the catalog of Berdnikov et al. (2000) with on-line updates. We re-estimated them using the expression for intrinsic colors as a function of period given by Abrahamyan (2003) and in addition, using Rv=AV/E(B-V)= 3.5 instead of the usual 3.1 used by Berdnikov et al.. The reason for this change is that Rv depends on the spectral type of the stars (a correction must be made to the effective wavelength of the B and V filters when they are convolved with the energy distribution of the stars (see Ažusienis & Straižys, 1969). L+5 found that the distances of the Cepheids calculated this way were better correlated with the kinematic distances than the original distances given by Berdnikov et al.
These minor corrections of distances do not change the main picture of the gradients that emerged form the series of papers of Andrievsky and collaborators, that we described in the Introduction.
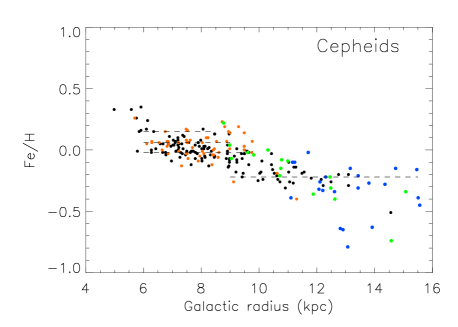
We present in Figure 8 the Fe abundance in Cepheids as a function of Galactic radius. In this plot we made small corrections to the values of [Fe/H] given in two papers. The papers of Andrievsky et al. and Luck et al. are based on the use of the same approach of spectroscopic analysis (the same system of oscillator strengths and the same methods of determination of the stellar fundamental parameters) so that the results are directly comparable. In spite of this, a minor mismatch appeared in the average metallicity for a large number of stars in the same galactic radius (there were no stars in common). We added 0.03 dex to the measurements of Luck et al. (2006) to correct for the difference in the average value of [Fe/H], considering the data of Andrievsky et al. as the correct ones. Another correction, of larger magnitude, was applied to the data of Yong et al. (2005). Their sample contains two stars in common with the series of Andreievsky et al: NT Pup and CE Pup, for which Yong et al. obtained [Fe/H] values lower by 0.25 and 0.2 dex respectively. The average difference for the stars situated in the region of overlap of the two samples was 0.3 dex. We added 0.25 dex to the [Fe/H] results of Yong et al. to match the data of Andriesky et al. This correction has an uncertainty of the order of 0.05 dex. The sample of Kovtyukh et al. (2005) contains 4 stars in common with Andrievsky et al.: RX Aur, RW Cam, T Mon, SV Mon; the average metallicity difference for these stars is negligible.
At a first glance, the traditional inclined straight line used in the past to fit metallicity gradients as discussed previously, would seem to be justified, to describe the ensemble of Cepheid data. However, a step function (or Heavyside function), not shown, with a step of 0.3 dex at 9.5 kpc, produces a fit of the same quality (Chi-square divided by the number of degrees of freedom), if we restrict the fit to the interval 6 to 13 kpc. In other words, this plot cannot be used to dismiss the existence of a TAAT-like step in the sample of Cepheids. The magnitude of the step, of about 0.3 dex, seem to be a little smaller than the one found for Open Clusters, but the difference is within the errors.
The gap in the distribution of Galactic radii of the Cepheids, similar to that of the Clusters, can be seen at about 8.7 kpc. It seems to be narrower and a little displaced with respected to the corotation radius (8.4 kpc). One explanation could be that the Cepheids are on the average older than the young Clusters and had more time to partially invade the corotation gap. The range of ages of the Cepheids is about 50 to 300 Myr (e.g. Bono et al., 2005). Another possibility is that the errors in distance are larger for Cepheids.
A number of horizontal lines are plotted in Figure 8 at [Fe/H] values which seem to concentrate a large quantity of stars. Some of these lines coincide with the [Fe/H] values with relatively larger density of clusters in Figures 3 to 5, like for instance at 0.0 dex and 0.15 dex. This is not surprising, since the two samples are constituted of populations of young objects; both can be considered to represent the chemical abundance of the interstellar gas at their birthplace at the present epoch, since 200 Myr (the order of magnitude of the ages) is a small interval of time for the chemical evolution of the disk.
To produce the horizontal alignments of Cepheids seen in Figure 8, there must be relatively few regions in the Galactic plane with active star formation. In any one of these regions, stars are formed from the local gas with a same metallicity, and then start their travel in radial distance from the Galactic center according to their initial perturbation velocity. The gas of the disk possibly presents a smooth variation of metallicity with radius, except for the step at corotation. If there were star forming regions distributed all over the Galactic plane, with a smooth distribution of metallicity, it would not be possible to distinguish preferential metallicities in the distribution of clusters. Certainly the Cepheids are born in spiral arms, like the clusters (in the case of the clusters this was shown by direct integration of their orbits for a time equal to their age, see Dias & Lépine (2005). Therefore, the spiral arms are the obvious candidates to be the discrete star-forming regions required to explain the existence of peaks in the metallicity distribution. Then, a natural question is: many arms are elongated structures, spanning a range of Galactic radius, why don’t they produce a broad distribution of metallicity that would smooth out the horizontal lines seen in Figure 8? One possibility is that some portions of the arms, like the corner of the square-shaped resonant arm discussed by L+5, are more efficient star formation regions than the others, and dominate. Another possibility is that due to the flow of gas along the arms the gradients of metallicity are small within a given arm.
4.1 The -elements
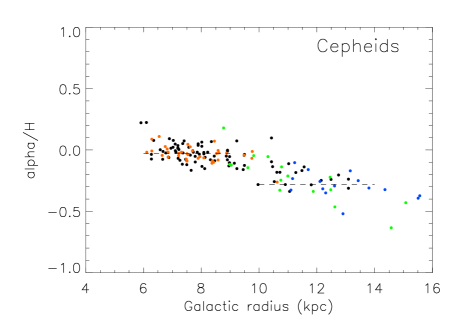
In order to reduce the errors on the abundance of -elements, we averaged five elements. These are O + Si + S + Mg + Ca, taken with equal weights. We shall designate them as -elements for simplicity. The choice of these elements was based on the fact they are classical -elements, and they were measured by different authors who performed spectroscopy of Cepheids. Since O was not measured by Yong et al. (2005), for the data of these authors we calculated the average of the remaining elements. The results are shown in Figure 8. We also performed minor corrections to the data presented in this figure, to match of the alpha abundance data of different authors: the corrections were -0.04 dex for Luck et al. (2006) and -0.1 dex for Kovtyukh et al. (2005).
The step-like decrease in the abundance of -elements at corotation looks similar to that of the Fe abundance. We plotted two horizontal lines in the Figure, to indicate the average metallicity inside corotation and the ”base-level” beyond corotation. The difference between them is of 0.25 dex, a little smaller than the step in Fe abundance but the difference is not significant compared to the scattering of the points.
4.2 The [/Fe] ratio
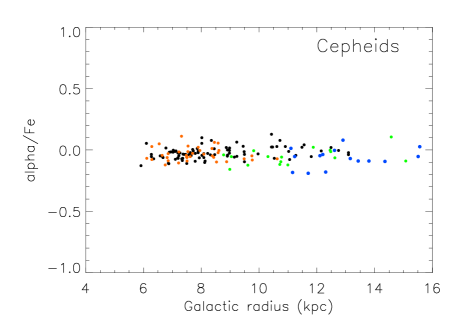
The obtained [/Fe] ratio, where is composed of the same elements above, is presented in Figure 9. The same minor corrections that were applied independently to Fe and -elements abundance were used to compute [/Fe]. The radial distribution shown in Figure 9 is surprisingly flat, showing an homogeneous abundance pattern all over the disk.
Although our discussion here has its focus on Cepheids, we have to make comparisons with results for different objects. Our results seem to be in contradiction with those from Carney et al. (2005), who have observed a relatively large (0.2 dex) increase of the [/Fe] ratio beyond 10 kpc. The origin of this discrepancy is mostly due to the Fe abundance, found by Carney et al. to be about -0.5 dex in the outer disk, while Andrievsky et al. (02 c) derive about -0.2 dex, not much different from TAAT ( -0.3 dex). Supposing that our results based on Andrievsky’s data are correct, the uniformity of the [/Fe] ratio with Galactic radius is an argument against the hypothesis raised by Yong et al. (2005), according to which the outer Open Clusters could be associated with mergers, and consequently, have very different formation histories from those born in our Galaxy.
Acharova et al. (2010) presented in the introduction of their paper a detailed discussion of the problem posed by the similarity of the Fe and abundances. According to the traditional view, most of the Iron is synthesized in type Ia supernovae (SNe), whose progenitors are stars with ages of several billion years. On the other hand, -elements are synthesized in type II SNe, associated with massive short-lived stars. When star formation begins somewhere, the abundance of -elements grows quickly, while the Fe abundance only starts to increase much later. However, more recently Matteucci et al. (2006) developped a new formulation for the Type Ia SNe rate, in which up to 50 per cent of the total Type Ia SNe should be composed by binary systems with lifetimes as short as yr. Taking into account that type II SNe also produce Iron, at least 2/3 of the Iron is produced in a fast process. Consequently, the [/Fe] ratio is not very sensitive to the time elapsed since the beginning of star formation, and is a good indicator of a recent star formation history. In this interpretation, the flatness of the distribution in Figure 9 is not so surprising.
Still, it is possible to obtain some insight on the star formation history from this figure. One can see a number of stars with [/Fe] of the order of 0.1 dex, in the range of galactocentric distances about 7 to 13 kpc. This is an indication that there has been intense star formation activity in recent times in this Galactic radius range. Interestingly, the stars with high metallicity seen around 6 kpc in Figure 8 do not have a high [/Fe] ratio.
5 The azimuthal gradient
We show in Figure 11 the azimuthal distribution of Fe abundance in the sample of Cepheids. This angle is the galactocentric angle in the Galactic plane, defined to be in the direction of the Sun and positive in the direction . Obviously, if we could observe all the , no average gradient would be seen. In this example we restricted the range of Galactic radius to go from 7 to 11 kpc. Very similar plots can be obtained if we use the abundance of -elements instead of [Fe/H], or if we change the range of radius. Note that if we transform the two extremities of the line segment fitted to the data in the figure into points on the Galactic plane, their distance is about 6 kpc, taking the average Galactic radius equal to 9 kpc. Therefore, the azimuthal gradient transformed to distance units would be of the order of 0.05 dex/kpc, which is not negligible compared to the radial gradients found in the literature. For instance, Pedicelli et al. (2009) have found an overall radial gradient of 0.05 dex/kpc.
We attribute this local azimuthal gradient to the spiral structure. For example, there is an excess of on-going star formation in the second Galactic quadrant () compared to the third one, due to the presence of the Perseus star forming region. This can be seen in maps of the spiral structure based on young tracers, like those from Hou et al. (2009) and L+5.
The main purpose of presenting this azimuthal gradient is to call attention to the risk of simple interpretations of radial metallicity gradients, and to emphasize the role of non axis-symmetric spiral arms. Obviously the usual assumption in chemical evolution models of almost instantaneous mixing of the enriched gas in azimuth is a poor approximation. It must be kept in mind that within 1 kpc from corotation (which includes the solar vicinity), the differential velocity of the gas with respect to the spiral structure is so small that it takes more than 1 Gyr for the gas to complete a turn around the Galactic center, in the frame of reference of the spiral structure.

5.1 The metallicity gradient step in M83
Since there is a widespread concept that abundance mixing in the azimuthal direction (along a circle around the Galactic center) is very efficient, we would like to present an additional example in which the simple parameterization of abundance patterns as a function of Galactic radius only is a poor one, and to show that there can be more than one ”organized” (in contrast with simple noise or random distribution) metallicity at a given radius. Figure 12 presents the gradient of Oxygen abundance in M83, reproduced from Bresolin et al. (2009). Coincidentally, the step occurs at about the same distance than in our Galaxy. Where the step appears we can find in M83 ”overlapping” gradients which resemble the ones we can see in Figure 3. We do not claim, however, that 8.5 kpc is the corotation radius in the case of M83, since there are many discrepant determinations of this corotation in the literature.

6 A lower limit to the age of the spiral structure
We have shown that the step in chemical abundance first noted by TAAT and confirmed in the present work coincides with the corotation radius; the step is explained it by the independent chemical evolution on the two sides of the barrier constituted by the ring void of gas and by the ”pumping out” mechanism. On each side of the barrier, there is exchange of gas between neighbouring Galactic radii due to winds of massive stars, explosions of supernovae, and gas transfer in the spiral arms, so that relatively flat gradients have established. The discovery of the nature of the abundance step provides a unique opportunity to contribute to the debate on the age of the present spiral pattern of the Galaxy, a parameter of major importance for the understanding of the physics of the spiral arms. A concept of ”transient spiral arms” has been supported by a number of papers (e.g. Sellwood & Carlberg, 1984, Sellwood, 2011). According to that hypothesis, which is based on numerical simulations, the lifetime of the arms is only of a few Galactic rotations. However, based on similar techniques, but with a larger number of particles, Fujii et al. (2010), concludes that the lifetime of a spiral structure can be of up to 10 Gyr.
The existence of the step in abundance means that the corotation resonance stayed at the same position for a long period. If the spiral structure were a transient phenomenon, changing its characteristics and its corotation radius at time intervals of the order of a few galactic rotations, the abundance step would not exist. We next discuss a lower limit to the age of the metallicity step. Supposing that a new spiral structure established itself at some time in the past, with its corotation radius at its present radius, then different metallicities started to build up on both sides of the resonance. A minimum elapsed time can be estimated by supposing that the production rate of metals was negligible on the outer side (of course, if the production of metals were not small on that side, a larger time would be required to build up the same 0.3 dex step). Taking the slope of Fe enrichment as a function of time presented by Chiappini et al. (1997) in their Figure 1, applied to the inner side, in the extreme case in which the enrichment is unimportant in the outer side, to build a 0.3 dex difference requires at least 3 Gyr.
This number, which is a lower limit, is in contradiction with the concept of transient spiral arms, in the shorter pattern life-time version of it. A rough estimation of 3 Gyr as the time elapsed since the last major change in the spiral structure of the Galaxy was already proposed by Amôres et al. (2009) based on the time required to build up the slope of the metallicity gradient of the youngest planetary nebulae.
7 Conclusions
The abrupt step in the metallicity gradient at about 8.5 kpc (for = 7.5 kpc, or 9.5 kpc for =8.5 kpc), first reported by Twarog et al. (1997) based on analysis of Fe abundance in a sample of Clusters, is confirmed by the additional data collected since 1997, and in particular, by the high-resolution spectroscopy data. A similar conclusion was already reached by Carney et al. (2005). The step is also present in the sample of Cepheids that we analyzed, not only for Fe abundance, but for the -elements as well.
The position of this step coincides with the corotation radius of the main spiral structure and is easily explained by the presence of this resonance (the possibility of the existence of a second pattern speed was also discussed). As shown by Amôres et al. (2009) there is a ring-shaped void of gas at this radius, which was predicted by hydrodynamic simulations (e.g. Lépine et al., 2001). This void is caused by the pumping out effect of the spiral structure that produces an inward flow of the gas in the inner regions of the Galaxy and an outward flow in the outer regions. Therefore, the Cassini-like gap is a barrier that isolates the gas of one side from the other, so that the chemical evolution of the two sides are independent. One must remember that chemical evolution models are models for the gas; stars are not usually regarded as a mean of transporting metallicity from one Galactic radius to the other. The corotation barrier only acts on the gas, not on the stars; many stars have orbits with strong deviations from the circularity, and there is no impediment for them to cross the resonance; what is more, stars on circular orbits themselves are scattered across the corotation radius (Sellwood & Binney, 2002; Lépine et al., 2003), and thus naturally cross the chemical barrier.
The counts of Open Clusters suggest that in the Galactic radius range 6.2 to 12 kpc, that is, between the ILR and the OLR of the 4-arms mode, but excluding a narrow gap at corotation, the star-formation rate is larger than outside this region. This is not an unexpected result, since our Galaxy has an important 4-arms mode, which is only permitted in this region.
Close to corotation, on the inner side of it, one can find Open Clusters with differences as large as 0.4 dex in Fe abundance at a same Galactic radius, which is much larger than the errors of measurements. The large dispersion of Fe abundance in this region can be attributed to the fact that the stars have been originated from different Galactic radii or different star-formation regions, through either non-circularity (”blurring”) or angular momentum exchange of circular orbits (”churning”), making the variety of birthplaces a more important cause of dispersion of metallicity than variations in age, except for the very old clusters.
A fine structure study of the metallicity distribution in populations of clusters and Cepheids situated in a Galactic radius range of width 1-2 kpc, in any of the two sides of corotation, shows that the pattern of this distribution is not smooth but presents a number of peaks, shown by horizontal lines in Figure 5. Our interpretation is that the star formation process is active in a limited number of regions of the Galactic disk; each active region has its own well defined metallicity, which is shared by the stars born there. Due to their initial velocities at the instant of birth, the stars (or clusters) have non-circular orbits and usually present variations in their Galactic radius of the order of 2 kpc in periods of time of the order of 100 Myr. In the external parts of the Galaxy the amplitudes of the radial variations get larger, enhancing the ”blurring” effect, but the time-scales are also larger. The simultaneous presence, at a given Galactic radius, of stars that originated from different star-forming regions can be explained by the overlapping of orbits. The concept is illustrated by L+5, where we see that orbits of different natures can cross each other. In the same paper, the complexity of the local spiral structure is shown, with the young stars of the solar neighborhood distributed in spiral arms with many different orientations.
In other words, the recent chemical enrichment of the Galactic disk seems to have its origin in a clumpy distribution of dominant star-formation centers. As the stars move out from the star-formation centers, and present variations of their Galactic radius, they form the horizontal concentrations of stars with similar metallicity like those seen in Figure 5. Certainly the star formation centers belong to the spiral arms.
To further convince the reader that one cannot neglect the spiral structure in the interpretation of the chemical gradients, we showed that there is a significant azimuthal metallicity gradient in a broad Galactic radius range around the Sun. With the same purpose, we showed an extragalactic example of the existence of a step in the gradient, associated with overlapping gradients (two different metallicity curves at a same radius). Analyses of metallicity gradients in our Galaxy or in external galaxies that are restricted to the determination of a single slope as a function of radius are poor ones.
As a conclusion, we thus stress that several difficulties exist in the comparison of chemical evolution models with observations. Only recently, such models predicting the metallicity distribution of both the stars and gas in a realistic manner have been developed Schönrich & Binney (2009), by taking into account both the angular momentum exchange across corotation of minor transient spiral features and the range of radii swept by stars on non-circular orbits. However, such recent models are still axisymmetric in essence, and do not take into account some of the basic features of our non-axisymmetric Galaxy, like the chemical barrier at the corotation of the main grand-design spiral pattern, the flow of gas with inverse direction on both sides of it, and a more correct expression for the star-formation rate taking into account the rate at which the spiral arms (where stars are born) are fed with gas. Consequently they cannot at present reproduce features such as the metallicity step and the overlapping abundance gradients observed around the corotation of the main spiral pattern, or such as the azimuthal metallicity gradient observed in the vicinity of the Sun. More elaborated chemo-dynamical models taking into account the main effects of the grand-design spiral pattern of the Milky Way are thus now required to reproduce such observations.
Acknowledgements
The thank the anonymous referee for several useful suggestions. The work was supported by the São Paulo State agency FAPESP through the PhD grant 08/06304-3. PC is is now supported by RoPACS, a Marie Curie Initial Training Network funded by the European Commission s Seventh Framework Programme. BF acknowledges the support of the AvH foundation.
;
References
- Abrahamyan [2003] Abrahamyan H. V., 2003, Astrophysics, 46, 455
- Acharova et al. [2010] Acharova I. A., Lépine J. R. D., Mishurov Y. N., Shustov B. M., Tutukov A. V., Wiebe D. S., 2010, MNRAS, 402, 1149
- Amôres et al. [2009] Amôres E. B., Lépine J. R. D., Mishurov Y. N., 2009, MNRAS, 400, 1768
- Andrievsky et al. [02 b] Andrievsky S. M., Bersier D., Kovtyukh V. V., Luck R. E., Maciel W. J., Lépine J. R. D., Beletsky Y. V., 2002 b, A&A, 384, 140
- Andrievsky et al. [02 a] Andrievsky S. M., Kovtyukh V. V., Luck R. E., Lépine J. R. D., Bersier D., Maciel W. J., Barbuy B., Klochkova V. G., Panchuk V. E., Karpischek R. U., 2002 a, A&A, 381, 32
- Andrievsky et al. [02 c] Andrievsky S. M., Kovtyukh V. V., Luck R. E., Lépine J. R. D., Maciel W. J., Beletsky Y. V., 2002 c, A&A, 392, 491
- Andrievsky et al. [2004] Andrievsky S. M., Luck R. E., Martin P., Lépine J. R. D., 2004, A&A, 413, 159
- Ann et al. [2002] Ann H. B., Lee S. H., Sung H., Lee M. G., Kim S., Chun M., Jeon Y., Park B., Yuk I., 2002, Astron. J, 123, 905
- Ažusienis & Straižys [1969] Ažusienis A., Straižys V., 1969, Astronomicheskii Zhurnal, 46, 402
- Berdnikov et al. [2000] Berdnikov L. N., Dambis A. K., Vozyakova O. V., 2000, A&AS, 143, 211
- Bono et al. [2005] Bono G., Marconi M., Cassisi S., Caputo F., Gieren W., Pietrzynski G., 2005, ApJ, 621, 966
- Bresolin et al. [2009] Bresolin F., Ryan-Weber E., Kennicutt R. C., Goddard Q., 2009, ApJ, 695, 580
- Carney et al. [2005] Carney B. W., Yong D., Teixera de Almeida M. L., Seitzer P., 2005, Astron. J, 130, 1111
- Carraro & Bensby [2009] Carraro G., Bensby T., 2009, MNRAS, 397, L106
- Carraro et al. [2007] Carraro G., Geisler D., Villanova S., Frinchaboy P. M., Majewski S. R., 2007, A&A, 476, 217
- Carraro et al. [1999] Carraro G., Vallenari A., Girardi L., Richichi A., 1999, A&A, 343, 825
- Chiappini et al. [1997] Chiappini C., Matteucci F., Gratton R., 1997, ApJ, 477, 765
- Delgado et al. [2010] Delgado A. J., Djupvik A. A., Alfaro E. J., 2010, A&A, 509, A104+
- Dias et al. [2002] Dias W. S., Alessi B. S., Moitinho A., Lépine J. R. D., 2002, A&A, 389, 871
- Dias & Lépine [2005] Dias W. S., Lépine J. R. D., 2005, ApJ, 629, 825
- Famaey et al. [2005] Famaey B., Jorissen A., Luri X., Mayor M., Udry S., Dejonghe H., Turon C., 2005, A&A, 430, 165
- Famaey et al. [2007] Famaey B., Pont F., Luri X., Udry S., Mayor M., Jorissen A., 2007, A&A, 461, 957
- Feast [2008] Feast M. W., 2008, in First Middle East-Africa, Regional IAU Meeting, held 5-10 April, 2008 in Cairo, Egypt. Online at http://www.mearim.cu.edu.eg/new/ Proceeding.htm, p.3 Galactic and Extragalactic Distance Scales: The Variable Star Project
- Fich & Tremaine [1991] Fich M., Tremaine S., 1991, ARA&A, 29, 409
- Fujii et al. [2010] Fujii M. S., Baba J., Saitoh T. R., Makino J., Kokubo E., Wada K., 2010, ArXiv e-prints
- Glushkova et al. [1999] Glushkova E. V., Dambis A. K., Rastorguev A. S., 1999, Astronomical and Astrophysical Transactions, 18, 349
- Gratton [2000] Gratton R., 2000, in R. Pallavicini, G. Micela, & S. Sciortino ed., Stellar Clusters and Associations: Convection, Rotation, and Dynamos Vol. 198 of Astronomical Society of the Pacific Conference Series, Abundances in open clusters: results and concerns. pp 225–234
- Hamdani et al. [2000] Hamdani S., North P., Mowlavi N., Raboud D., Mermilliod J., 2000, A&A, 360, 509
- Hasegawa et al. [2004] Hasegawa T., Malasan H. L., Kawakita H., Obayashi H., Kurabayashi T., Nakai T., Hyakkai M., Arimoto N., 2004, PASJ, 56, 295
- Hou et al. [2009] Hou L. G., Han J. L., Shi W. B., 2009, A&A, 499, 473
- Kalnajs [1973] Kalnajs A. J., 1973, Proceedings of the Astronomical Society of Australia, 2, 174
- Kovtyukh et al. [2005] Kovtyukh V. V., Wallerstein G., Andrievsky S. M., 2005, PASP, 117, 1173
- Lépine et al. [2003] Lépine J. R. D., Acharova I. A., Mishurov Y. N., 2003, ApJ, 589, 210
- Lépine et al. [2008] Lépine J. R. D., Dias W. S., Mishurov Y., 2008, MNRAS, 386, 2081
- Lépine et al. [2001] Lépine J. R. D., Mishurov Y. N., Dedikov S. Y., 2001, ApJ, 546, 234
- Lépine et al. [2010] Lépine J. R. D., Roman-Lopes A., Abraham Z., Junqueira T. C., Mishurov Y. N., 2010, ArXiv e-prints
- Lin & Shu [1964] Lin C. C., Shu F. H., 1964, ApJ, 140, 646
- Lin et al. [1969] Lin C. C., Yuan C., Shu F. H., 1969, ApJ, 155, 721
- Luck et al. [2003] Luck R. E., Gieren W. P., Andrievsky S. M., Kovtyukh V. V., Fouqué P., Pont F., Kienzle F., 2003, A&A, 401, 939
- Luck et al. [2006] Luck R. E., Kovtyukh V. V., Andrievsky S. M., 2006, Astron. J, 132, 902
- Magrini et al. [2009] Magrini L., Sestito P., Randich S., Galli D., 2009, A&A, 494, 95
- Matteucci et al. [2006] Matteucci F., Panagia N., Pipino A., Mannucci F., Recchi S., Della Valle M., 2006, MNRAS, 372, 265
- McMillan & Binney [2010] McMillan P. J., Binney J. J., 2010, MNRAS, 402, 934
- Meibom et al. [2009] Meibom S., Grundahl F., Clausen J. V., Mathieu R. D., Frandsen S., Pigulski A., Narwid A., Steslicki M., Lefever K., 2009, Astron. J, 137, 5086
- Mishurov [2000] Mishurov Y. N., 2000, Astronomy Reports, 44, 6
- Moitinho et al. [2006] Moitinho A., Vázquez R. A., Carraro G., Baume G., Giorgi E. E., Lyra W., 2006, MNRAS, 368, L77
- Monroe & Pilachowski [2010] Monroe T. R., Pilachowski C. A., 2010, Astron. J, 140, 2109
- Pancino et al. [2010] Pancino E., Carrera R., Rossetti E., Gallart C., 2010, A&A, 511, A56+
- Paunzen et al. [2003] Paunzen E., Maitzen H. M., Rakos K. D., Schombert J., 2003, A&A, 403, 937
- Pedicelli et al. [2009] Pedicelli S., Bono G., Lemasle B., François P., Groenewegen M., Lub J., Pel J. W., Laney D., Piersimoni A., Romaniello M., Buonanno R., Caputo F., Cassisi S., Castelli F., Leurini S., Pietrinferni A., Primas F., 2009, A&A, 504, 81
- Piatti et al. [2009] Piatti A. E., Clariá J. J., Mermilliod J., Parisi M. C., Ahumada A. V., 2009, in Revista Mexicana de Astronomia y Astrofisica Conference Series Vol. 35 of Revista Mexicana de Astronomia y Astrofisica, vol. 27, Optical photometry and CORAVEL observations of stars in the field of the Hyades-like age open cluster NGC 2489. pp 303–+
- Pöhnl & Paunzen [2010] Pöhnl H., Paunzen E., 2010, A&A, 514, A81+
- Pompéia et al. [2011] Pompéia L., Masseron T., Famaey B., Van Eck S., Jorissen A., Minchev I., Siebert A., Sneden C., Lépine J. R. D., Siopis C., Gentile G., Dermine T., Pasquato e. a., 2011, ArXiv e-prints
- Prisinzano et al. [2011] Prisinzano L., Sanz-Forcada J., Micela G., Caramazza M., Guarcello M. G., Sciortino S., Testi L., 2011, A&A, 527, A77+
- Quillen et al. [2010] Quillen A. C., Dougherty J., Bagley M. B., Minchev I., Comparetta J., 2010, ArXiv e-prints
- Quillen & Minchev [2005] Quillen A. C., Minchev I., 2005, Astron. J, 130, 576
- Rudolph et al. [2006] Rudolph A. L., Fich M., Bell G. R., Norsen T., Simpson J. P., Haas M. R., Erickson E. F., 2006, ApJSS, 162, 346
- Santos et al. [2009] Santos N. C., Lovis C., Pace G., Melendez J., Naef D., 2009, A&A, 493, 309
- Schönrich & Binney [2009] Schönrich R., Binney J., 2009, MNRAS, 396, 203
- Sellwood [2011] Sellwood J. A., 2011, MNRAS, 410, 1637
- Sellwood & Binney [2002] Sellwood J. A., Binney J. J., 2002, MNRAS, 336, 785
- Sellwood & Carlberg [1984] Sellwood J. A., Carlberg R. G., 1984, ApJ, 282, 61
- Sestito et al. [2008] Sestito P., Bragaglia A., Randich S., Pallavicini R., Andrievsky S. M., Korotin S. A., 2008, A&A, 488, 943
- Sofue et al. [2011] Sofue Y., Nagayama T., Matsui M., Nakagawa A., 2011, ArXiv e-prints
- Tosi et al. [1998] Tosi M., Pulone L., Marconi G., Bragaglia A., 1998, MNRAS, 299, 834
- Twarog et al. [1997] Twarog B. A., Ashman K. M., Anthony-Twarog B. J., 1997, Astron. J, 114, 2556
- Vázquez et al. [2008] Vázquez R. A., May J., Carraro G., Bronfman L., Moitinho A., Baume G., 2008, ApJ, 672, 930
- Villanova et al. [2010] Villanova S., Randich S., Geisler D., Carraro G., Costa E., 2010, A&A, 509, A102+
- Yong et al. [2005] Yong D., Carney B. W., Teixera de Almeida M. L., 2005, Astron. J, 130, 597