Silicon dry oxidation kinetics at low temperature in the nanometric range: modeling and experiment
Abstract
Kinetics of silicon dry oxidation are investigated theoretically and experimentally at low temperature in the nanometer range where the limits of the Deal and Grove model becomes critical. Based on a fine control of the oxidation process conditions, experiments allow the investigation of the growth kinetics of nanometric oxide layer. The theoretical model is formulated using a reaction rate approach. In this framework, the oxide thickness is estimated with the evolution of the various species during the reaction. Standard oxidation models and the reaction rate approach are confronted with these experiments. The interest of the reaction rate approach to improve silicon oxidation modeling in the nanometer range is clearly demonstrated.
pacs:
81.65.Mq,68.35.Fx,68.47.Fg,81.15.AaI Introduction
An important challenge imposed by CMOS downscaling is the growth of ultra-thin oxides of silicon of high quality, with a tight thickness control and a good uniformity ITR (2005). Very important progress have been done during the last decade to improve the structural properties and electrical limits of ultra-thin ( nm) silicon oxide and oxynitride Green et al. (2001). On the other side, the modeling of ultra-thin silicon oxide growth remains a difficult issue for the microelectronics industry.
To date, the seminal work of Deal and Grove remains the main approach used in process simulators to describe the oxide growth Deal and Grove (1965). Assuming a steady state reaction between molecular oxygen and silicon, Deal and Grove deduced that the oxide growth can simply be described by the following equation :
| (1) |
where the oxide thickness is described by a linear-parabolic relationship as a function of the oxidation time . The term characterizes the initial linear rate growth. The parabolic rate constant governs the diffusion limited regime. An initial time offset is necessary to take into account the presence of an initial thick oxide layer. The success of this model can be explained by its ability to describe both dry and wet oxide in the case of thick oxide. Another major achievement is the introduction by Kao et al. Kao et al. (1988) of the influence of strain effects in the Deal and Grove approach. Using this generalized Deal and Grove approach, Kao et al. explained the retardation effect observed for the oxidation of curved surfaces Kao et al. (1987).
However, this model suffers from strong limitations such as the failure to describe the fast initial growth regime for dry oxidation Massoud et al. (1985a) or the difficulties to extend it to oxynitridation process Dimitrijev et al. (1996). Much research work has been dedicated to elucidate the breakdown of the Deal & Grove model in the ultra-thin regime. The idea was to correct the Deal and Grove model by adding some empirical terms to the growth rate Massoud et al. (1985b); Han and Helms (1987). However, the physical origin of these terms is subject to discussion.
An alternative approach has been proposed by Wolters et al. who considered that mobile ionic species are responsible of the silicon oxidation process Wolters and Zegers-Van-Duijnhoven (1989a, b). Ionic transport and induced electric field considered in this model could explain some of the experimental phenomena observed in silicon oxidation such as the rate dependence on the orientation or the cross-over effects Wolters and Zegers-Van-Duijnhoven (1993). But the role of charged species in the oxidation mechanism is still debated even, for more fundamental simulations such as density functional theory Stoneham et al. (2001); Bongiorno and Pasquarello (2004). Recently, a new alternative linear parabolic rate equation has also been proposed by Watanabe et al. Watanabe et al. (2006) without the rate-limiting step of the oxidation reaction but assuming that diffusivity is suppressed in a strained oxide near the silicon interface.
From the above discussion, a revision of the Deal and Grove model is clearly necessary to improve process simulation. An ideal model for the microelectronics industry must give access to : (i) a fundamental and quantitative understanding of the interaction between oxygen, silicon and the standard dopant at the Si/SiO2 to better describe segregation effects Kim and Chang (2005); Kohli et al. (2005) or to estimate the dose-loss of dopant, (ii) the amount of silicon interstitials at the interface (iii) the amount of nitrogen incorporated during a more complex oxynitridation process (NO, N2O gas) to estimate the gate leakage current Muraoka et al. (2003). The development of such model still represents a big challenge. Moreover, a multiscale modeling of silicon oxidation Bongiorno and Pasquarello (2004) will probably be mandatory to simulate the growth of ultimate oxides ( 1 nm) fabricated by advanced oxidation process such as plasma nitridation step Pan and Liu (2005).
In this paper, the modeling of dry oxidation kinetics at low temperature in the nanometer range is investigated. This paper is organized as follows. In section II, the reaction rate formalism is presented. The calibration method and some preliminary results are also discussed. Experiment at low temperature are described in section III. The two standard models (Deal and Grove Deal and Grove (1965), Massoud Massoud et al. (1985a, b)) and the reaction rate approach are confronted with the experimental data in section IV. Most important conclusions are summarized in section V.
II The reaction rate approach
II.1 Introduction
An interesting study in silicon oxidation modeling has been published by Almeida et al. de Almeida et al. (2000); Baumvol (1999). The main idea of this work is to analyze the main assumptions of the Deal and Grove model and to propose a more rigorous approach. The first approximation made by Deal and Grove is to consider that the reaction strictly takes place at the interface. The second approximation is the steady state regime which imposes the a balance between oxidizing species entering the SiO2 surface, the number of molecules diffusing into the oxide and the molecules reacting at the Si/SiO2 interface. Thus the concentration of the oxidant species is not time dependent. As outlined in an very elegant way by Almeida et al., these assumptions are certainly the key to explain the limitations of the Deal and Grove model in the ultra-thin regime for dry oxidation. Moreover these assumptions limits the development of more sophisticated treatment of the oxidation mechanism.
II.2 The model
In this paper, a reaction rate approach similar to that of Almeida et al. de Almeida et al. (2000); Baumvol (1999) has been adopted for the modeling of our experimental kinetic at low temperature. The main diffusing species is assumed to be molecular oxygen (O2) as demonstrated by several isotopic experiments Rochet et al. (1984). The two other species are pure silicon (Si) and silicon dioxide (SiO2). The reaction of oxidation is simply given by:
| Si+ O2 | SiO2 |
where is the reaction rate. Keeping in mind that the investigation focuses on the nanometric regime, a silicon surface associated with a one dimensional system of coordinates is considered (see Figure 1). The area to be oxidized is viewed as an assembly of silicon monolayers. The grid is defined to match as fine as possible this assembly of planes. This means that the vertical mesh step corresponds to the distance between two silicon planes (1.35 Å). The oxygen flux in the furnace is perpendicular to the silicon interface. Since the model involves an oxidation mechanism in the nanometer range, the growth of the film is restricted to the vertical direction.
The relative concentration of the species (where = Si, O2, and SiO2) is defined as follow :
| (2) |
where corresponds to the concentration in the plane in units of number of atoms per unit surface, and is the maximum possible concentration in the plane. can be viewed as a layer coverage. For example, a value of 1 for , means that the coverage of the layer is complete and corresponds to a concentration of 0.91 at/cm2 of silicon.
In order to setup the system of equations, the evolution of each species is described. During the oxidation process, the molecular oxygen diffuses in the silicon dioxide, reaches the silicon and reacts with it. Considering the diffusivity of the molecular oxygen and the reaction rate constant , the evolution of molecular oxygen can be given by:
| (3) |
In this expression, the reaction region is defined by the overlap between the oxygen and silicon species. Next, silicon consumption has is described by:
| (4) |
To simplify the previous equation, the fact that some silicon interstitials generated during oxidation Skarlatos et al. (1999) has been neglected. The conservation law of the different species allows the description of the silicon dioxide creation:
| (5) |
II.3 Boundary conditions
To complete the mathematical description of the oxidation mechanism, boundary conditions need to be refined. For oxygen, it is necessary to evaluate the concentration of oxygen molecules that lies on the silicon surface. In this study, this concentration is estimated by simple physical considerations.
Considering that the oxygen is described by the ideal gas law, the number of oxygen molecules in the furnace chamber can be expressed as a function of the gas pressure and temperature . Assuming that an ideal monolayer of oxygen molecules lies on top of the wafer surface, the density is :
| (6) |
where is the Avogadro number, the universal gas constant, is the surface of the lattice and the height of the oxygen layer. If the maximum density occurs when all the molecules form a square lattice of Å spacing:
| (7) |
The oxygen layer coverage on the surface can be expressed by the following expression :
| (8) |
which further simplifies to the last expression of Eq. 8, if the height of the layer is about Å.
The layer coverage of oxygen at the interface depends on both the partial pressure and the temperature. Figure 2 represents the variation of this coverage with the temperature.
II.4 Calibration
A rough estimation of the the oxygen concentration at the interface can be deduced using simple physical arguments. In order to estimate the value for the reaction rate and for the diffusivity , a calibration step has been undertaken on experimental kinetics. The large experimental oxidation database of Massoud (measured with an in-situ ellipsometer) has been chosen Massoud et al. (1985a). A numerical optimization method based on simulated annealing has been undertaken Goffe et al. (1994). This method explores the whole solution space for the parameters (here , ) to reach a global minimum for the error function. The probability of jump between different parameter values is proportional to Boltzmann probability distribution. At the beginning of the calibration step, the temperature (for the Boltzmann distribution) is high to explore all the solution space and then is cooled down to limit the variation of the parameters in order to reach a minimum. The calibration procedure used is :
-
•
Start with an initial value of and and with an important value for the control parameter
-
•
Calculate the theoretical oxide thickness at the different experimental points
-
•
Estimate the error function defined by the difference between the theoretical estimations and the different experimental thickness of the kinetics:
(9) Where is the number of the experimental points of the oxidation kinetics. are weighting coefficients defined such as to enforce the algorithm to minimize principally the error function for the lowest oxide thickness.
-
•
Modify the value of and to minimize the error function . According to the Boltzmann probability associated with E, cool .
At the end of an important number of iteration steps (100000), the value of the two parameters minimizing the error function is obtained.
II.5 Calibration results
The parameters given by the optimization step to adjust the Massoud experimental data are reported in Table 1. In order to extract a physical law for the variation of the two parameters, the different values have been calibrated again to match an Arrhenius law. As shown in figure 3, both the diffusivity and the reaction rate parameter agree well with an Arrhenius plot, which leads to the following law:
| (10) |
The energy of activation is found to be eV and the prefactor nm2/s. For the reaction-rate, we obtain similarly an Arrhenius law :
| (11) |
with and eV. It is worth noting that the activation energy and reaction rate are physically reasonable and close to published numbers de Almeida et al. (2000); Han and Helms (1987); Kim et al. (1996). The calibrated activation energy for the diffusivity is in agreement with the experimental diffusion energy in silicon (2.42 eV) Kim et al. (1996) and with ab-initio estimations (2.3-2.5 eV). The energy of activation (1.42 eV) for the reaction rate is not so different from the energy to break an Si-Si bonds (1.86 eV) Pauling (1960).
II.6 Preliminary evaluation
A primary consolidation of the present model has been performed through a comparison with published oxide thickness measured by ellipsometry. Figure 4 compares the prediction of our modeling approach with the kinetics of Massoud et al. at atmospheric pressure from 800∘C to 1000∘C. Each sample has an 1.0 nm initial oxide prior to oxidation. Thanks to the calibration step, an excellent agreement between the experimental data and the model is obtained. The oxidation rate for the different temperature is clearly well described both in the linear and the parabolic regime. No clear loss of predictivity is observed when using the analytical law for the reaction rate and the diffusivity rather than each pair of calibrated data. Next, the model is compared with the experiments made by Chao et al. Chao et al. (1991) at atmospheric pressure in the nanometer range. The corresponding experimental data shown in the figure 5 were obtained with a multi-angle incident ellipsometer. Samples have a native oxide of 1.6-2nm covering the substrate. Similar conclusions can be drawn again considering that the variation of the oxidation growth rate is well described by the model for experimental conditions close to those used by Massoud et al.
Finally, a comparison between our model and the original kinetics obtained by the Deal and Grove model has been performed. The main objective is to check the validity of the reaction rate approach to describe correctly the oxide growth in the thick regime. The comparison between the two models is of interest. Figure 6 presents the classical Deal and Grove kinetics simulated with the original parameters published in 1965 Deal and Grove (1965). The breakdown of Deal and Grove model to describe dry oxide growth below 20 nm is clearly emphasized. Almost no oxide growth is observed for a temperature near 800∘C. The kinetics obtained by the reaction rate approach with the same temperature and pressure is represented in the figure 7. The differences between the two models is obvious in the ultra-thin regime. However the reaction rate approach is also able to describe the oxide growth in the thick regime. The growth rates predicted by the two models for various temperatures are in relatively good agreement. Even if the initial thickness considered in the two models is strongly different, the amount of oxide grown is almost identical a difference that does not exceed 5 for 30 minutes at 1200∘C.
III Dry oxidation at low temperature
A complementary experimental work has been undertaken to validate the model. In order to reach the nanometer range with a conventional furnace, the oxidation is often performed by reducing the pressure of the growth ambient Bidaud et al. (2001); Ludsteck et al. (2004), by diluting the oxidant gas with nitrogen Bhat et al. (2001a), or by lowering the temperature Irene and der Meulen (1976). Oxidation with low thermal budget is an interesting solution. This point is illustrated by the study of Bhat et al. who propose the growth of ultra-thin oxides of silicon at low temperature [600∘C-700∘C] by wet oxidation Bhat et al. (2001b). In the present case, dry oxidation in a classical furnace is performed at low temperatures (725∘C, 750∘C) to fabricate oxide in the [1.5-4 nm] range.
III.1 Oxidation experiments
Low oxidation temperature is not sufficient to achieve oxide layers with interesting structural properties in the nanometer range. Special care has to be given on the design of the thermal process to achieve a good homogeneity. Our experiments were performed on [100] silicon substrates (p type doped 5 1015 at/cm3) that previously received a RCA cleaning and 1 HF dip. The oxide growth was carried out in a conventional furnace at atmospheric pressure. The oxidation process is divided into four stages as shown in figure 9.
The sample introduction is performed at a temperature lower by 50∘C than the main temperature step. Next, a temperature ramp is applied to reach the desired temperature during 30 minutes. The ambient is composed by a main flux of nitrogen (2 L/min) and a small amount of oxygen (0.2 L/min). During this ramp, a very thin layer of silicon dioxide is created on top of the wafer before the start of the isothermal part of the oxidation step. An oxide of 1.53 nm (resp. 1.96 nm) is grown for a preoxidation ramp of 30 minutes at 725∘C (resp. 750 ∘C) is created during this step. The thickness grown during the first part of the thermal cycle is nearly half of the maximum thickness range. However, this step is critical regarding the oxide thickness homogeneity. The preoxidation ramp has a clear impact on homogeneity which is less than 2 on the whole wafer for the oxidation process at 725∘C. Performing the same process with an inert ambient during the ramp-up leads to a strong increase of the oxide thickness dispersion up to 16 .
Finally, the oxidation stage is realized under an enhanced oxygen flux of (2 L/min). As shown in table II, the oxide growth is slow and the expected final thickness can be precisely controlled by the duration of the main oxidation stage since the reaction rate is very limited. The final step consists in an inert nitrogen atmosphere for a ramp down during 10 min. and by a thermal reflow of 30 min. No growth is expected during this phase. The main objective of the final process step is to improve the electrical properties of the oxide film and to reduces the amount of interface defects.
III.2 Ellipsometry and TEM measurements
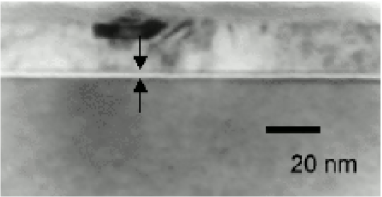
Oxide thickness has been measured by a spectroscopic ellipsometer. In order to validate the ellipsometry measurements, some TEM analysis were performed. Two oxide layers grown with a preoxidation ramp at 725∘C during 10 min and 30 min were analyzed. A polysilicon capping layer simulate the gate stack. The TEM analyzes (figure 8) shows that a thin and uniform oxide layer. The following table (table 2) compare the thickness measurements given by the two methods. The good agreement between the ellipsometer and TEM measurements validate the ellipsometric method even if it has already been observed that for thickness below 2.5 nm, deviations become more important der Marel et al. (2004).
IV Simulation of oxide growth at low temperature.
IV.1 Introduction
The main objective of this section is to compare our experimental kinetics with the two standard models (Deal and Grove and Massoud) and the reaction rate approach. It has been previously verified that the reaction rate approach is able describe the kinetics in the case of thick oxides. However some questions still require clarification: i) is finally the reaction rate approach more adapted to describe the silicon oxidation in the nanometer regime ? ii) Is it possible to describe the oxidation in the low temperature regime where the oxidation reaction rate is very limited ? The objective of this section is to address these questions.
On the other side, it must be kept in mind that oxide growth in this range [1.5-4 nm] is strongly dependent on processing parameters like e.g., the pre-oxidation ramp and surface cleaning methods Baumvol (1999). Moreover, the experimental regime is relatively challenging for oxidation modeling. These two points emphasize the fact that only the oxidation kinetics variation during the main oxidation stage can be discussed.
IV.2 Comparison with Deal and Grove
Our experimental kinetics data are compared with the two standard models. Since our objective is to tackle the model limitations, a continuous implementation of these models have been performed. The oxide thickness is obtained by integrating the following expression of the growth rate using very short timestep:
| (12) |
In the present case, for the diffusivity and the reaction rate, calibrated parameters of standard TCAD tool has been used Dio (1999). This set of parameters is supposed to give more accurate results in the ultra-thin regime. Since, the oxidation temperature is below 1000∘C, the linear reaction rate is govern by:
| (13) |
and the diffusivity
| (14) |
Oxide growth has been simulated for the main oxidation steps at 725∘C and 750∘C. Since the initial oxidation ramp-up is not simulated, the theoretical curve must be shifted upward to match the experimental thickness obtained at the end of the temperature ramp up. As shown in figure 10, the theoretical kinetic predicted by Deal and Grove Deal and Grove (1965) significantly deports from experimental data. The oxide growth rate is strongly underestimated. Almost no oxide is created at low temperature, in contradiction with our oxidation experiments.
IV.3 Comparison with the Massoud model
As previously discussed, the Massoud model is an extension of the Deal and Grove model to improve the description in the ultra-thin regime. In practice, the growth rate expression is corrected by adding a supplementary term that exponentially decays with the oxide thickness: :
| (15) |
involves with an Arrhenius law:
| (16) |
and the oxide thickness of this additional term is controlled by the parameter length (L=7 nm).
As shown in figure 11, the introduction of the corrective term does not really improve the situation. Growth rate are still underestimated in the lowest temperature regime. It is worth noting that the situation improves at 750∘C since it is much closer to the lowest temperature (800∘C) used by Massoud et al. to perform their calibration.
IV.4 Comparison with the reaction rate approach
A final comparison has been performed between the experimental results and the reaction rate approach. Results are shown in figure 12. The first stage of the oxidation process is not considered since we are interested in simulating the main isothermal oxidation ramp. The theoretical oxidation kinetics are shifted upward in order to match the oxide thickness at the beginning of the oxidation ramp. Doing so, the agreement between the experimental kinetics and the model is fine specially for the oxidation at 725∘C. the range of oxide thickness predicted by the reaction rate approach is clearly relevant. For 750∘C, the model slightly overestimates the growth rate but the error remains reasonable (the maximum error is less than 0.4 nm for the complete set of experimental data). Probably the most interesting point is that the variation of the growth rate is relatively well defined. Moreover the oxidation kinetics seems to be not strictly linear as often described by the two standard models (the reaction rate approach predicts a behavior in t0.8).
V Conclusion
In conclusion, we have proposed a combined experimental and theoretical study for the dry oxidation of silicon at low temperature. A model based on the reaction rate approach and on recent developments de Almeida et al. (2000) has been proposed. A set of parameters has been calibrated. A comparison with the two standard models shows a very good predictivity both in the thin and the thick regime. A complementary study has been carried out to test the predictivity of the two standard models and of the reaction rate approach in the nanometric regime ([1.5-4 nm] range). Considering that only two parameters have been calibrated, the results obtained by this approach are very promising. Further work is needed to refine and improve the model. For example, it would be of interest to test if the reaction rate approach is able to describe the complex orientational effects observed experimentally by Irene et al. Lewis and Irene (1987) or Ngau et al. Ngau et al. (2002). A further extension of this approach could also be the modeling of various oxynitridation processes (NO, N2O) used by the microelectronics industry.
Acknowledgements.
The financial support of the European Union through the IST-2000-30129 FRENDTECH project (for the simulation work) and the IST-2000-26475 SODAMOS project (for ultra-thin gate oxidation experiments) is acknowledged. The authors would like to thank Jerzy Katcky from ITE (Varsaw) for the TEM analysis and Vincent Senez (IEMN) who initiated the work on oxidation modeling. One of the authors (C. K.) is also strongly indebted to Peter Pichler (Franhofer FhG-IISB, Erlangen) for support during the FRENDTECH project.References
- ITR (2005) The International Technology Roadmap for Semiconductors (2005).
- Green et al. (2001) M. L. Green, E. P. Gusev, R. Degraeve, and E. L. Garfunkel, J. Appl. Phys. 90, 2057 (2001).
- Deal and Grove (1965) B. E. Deal and A. S. Grove, J. Appl. Phys. 36, 3770 (1965).
- Kao et al. (1988) D.-B. Kao, J. P. McVittie, W. D. Nix, and K. C. Saraswat, IEEE Trans. Electron Devices 35, 25 (1988).
- Kao et al. (1987) D.-B. Kao, J. P. McVittie, W. D. Nix, and K. C. Saraswat, IEEE Trans. Electron Devices 34, 1008 (1987).
- Massoud et al. (1985a) H. Z. Massoud, J. D. Plummer, and E. A. Irene, J. Electrochem. Soc. 132, 2685 (1985a).
- Dimitrijev et al. (1996) S. Dimitrijev, H. B. Harrison, and D. Sweatman, IEEE Trans. on Electron Devices 43, 267 (1996).
- Massoud et al. (1985b) H. Z. Massoud, J. D. Plummer, and E. A. Irene, J. Electrochem. Soc. 132, 2693 (1985b).
- Han and Helms (1987) C.-J. Han and C. R. Helms, J. Electrochem. Soc. 134, 1297 (1987).
- Wolters and Zegers-Van-Duijnhoven (1989a) D. R. Wolters and A. T. A. Zegers-Van-Duijnhoven, J. Appl. Phys. 65, 5126 (1989a).
- Wolters and Zegers-Van-Duijnhoven (1989b) D. R. Wolters and A. T. A. Zegers-Van-Duijnhoven, J. Appl. Phys. 65, 5134 (1989b).
- Wolters and Zegers-Van-Duijnhoven (1993) D. R. Wolters and A. T. A. Zegers-Van-Duijnhoven, Microelectronics Journal 24, 333 (1993).
- Stoneham et al. (2001) A. M. Stoneham, M. A. Symanski, and A. L. Shluger, Phys. Rev. B 63, 241304 (2001).
- Bongiorno and Pasquarello (2004) A. Bongiorno and A. Pasquarello, Phys. Rev. B 70, 195312 (2004).
- Watanabe et al. (2006) T. Watanabe, K. Tatsumura, and I. Ohdomari, Phys. Rev. Lett. 96, 196102 (2006).
- Kim and Chang (2005) Y.-S. Kim and K. J. Chang, J. Appl. Phys. 87, 041903 (2005).
- Kohli et al. (2005) P. Kohli, A. Jain, S. Chakravarthi, H. Bu, S. T. Dunham, and S. Banerjee, J. Appl. Phys. 97, 073520 (2005).
- Muraoka et al. (2003) K. Muraoka, K. Kurihara, N. Yasuda, and H. Satake, J. Appl. Phys. 94, 2038 (2003).
- Pan and Liu (2005) T.-M. Pan and C.-H. Liu, J. Electrochem. Soc. 152, 851 (2005).
- de Almeida et al. (2000) R. M. C. de Almeida, S. Gonçalves, I. J. R. Baumvol, and F. C. Stedile, Phys. Rev. B 61, 12992 (2000).
- Baumvol (1999) I. J. R. Baumvol, Surface Science Reports 36, 1 (1999).
- Rochet et al. (1984) F. Rochet, B. Agius, and S. Rigo, J. Electrochem. Soc. 131, 914 (1984).
- Skarlatos et al. (1999) D. Skarlatos, M. Omri, A. Claverie, and D. Tsoukalas, J. Electrochem. Soc. 146, 227476 (1999).
- Press et al. (1986) W. Press, S. A. Teukolsky, W. T. Vetterling, and B. P. Flannery, Numerical Recipes in Fortran 77, The art of scientific computing (Cambridge University Press, 1986).
- Goffe et al. (1994) W. L. Goffe, G. D. Ferrier, and J. Rogers, Journal of Econometrics 60, 65 (1994).
- Kim et al. (1996) K. Kim, Y. H. Lee, M. H. An, M. S. Suh, C. J. Youn, K. B. Lee, and H. J. Lee, Semicond. Sci. Technol. 11, 1059 (1996).
- Pauling (1960) L. Pauling, The Nature of the Chemical Bond (Cornell University Press, New-York, 1960).
- Chao et al. (1991) T. S. Chao, C. L. Lee, and T. F. Lei, J. Electrochem. Soc. 138, 1756 (1991).
- Bidaud et al. (2001) M. Bidaud, F. Guyader, F. Arnaud, J. L. Autran, and K. Barla, J. Non-Cryst. Solids 280, 32 (2001).
- Ludsteck et al. (2004) A. Ludsteck, J. Schultze, I. Eisele, W. Dietl, and Z. Nenyei, J. Appl. Phys. 95, 2827 (2004).
- Bhat et al. (2001a) V. K. Bhat, K. N. Bhat, and A. Subrahmanyam, Solid State Electron. 16, 925 (2001a).
- Irene and der Meulen (1976) E. A. Irene and Y. J. V. der Meulen, J. Electrochem. Soc. 123, 1380 (1976).
- Bhat et al. (2001b) V. K. Bhat, K. N. Bhat, and A. Subrahmanyam, Solid State Electron. 16, 925 (2001b).
- der Marel et al. (2004) C. V. der Marel, M. A. Verheijen, Y. Tamminga, R. H. W. Pijnenburg, N. Tombros, and F. Cubaynes, J. Vac. Sci. Technol. A 22, 1572 (2004).
- Dio (1999) DIOS, SYNOPSYS TCAD Manuals, Release 6 (1999).
- Lewis and Irene (1987) E. A. Lewis and E. A. Irene, J. Electrochem. Soc. 134, 2332 (1987).
- Ngau et al. (2002) J. L. Ngau, P. B. Griffin, and J. D. Plummer, J. Electrochem. Soc. 149 (2002).
| T(∘C) | n | (nm2/s) | () |
|---|---|---|---|
| 800 | 1.50e-04 | 27.5 | 7.0 |
| 850 | 1.43e-04 | 124.4 | 8.1 |
| 900 | 1.37e-04 | 355.6 | 15.8 |
| 950 | 1.38e-04 | 1035.9 | 23.8 |
| 1000 | 1.26e-04 | 2268.1 | 57.2 |
| Duration | Ellipsometry | TEM |
|---|---|---|
| 10 Min. | 18.90 0.3 Å | 19 1.0 Å |
| 30 Min. | 27.10 0.3 Å | 27 1.0 Å |