Expansion of the Youngest Galactic Supernova Remnant G1.9+0.3
Abstract
We present a measurement of the expansion and brightening of G1.9+0.3, the youngest Galactic supernova remnant, comparing Chandra X-ray images obtained in 2007 and 2009. A simple uniform expansion model describes the data well, giving an expansion rate of % yr-1, and a flux increase of % yr-1. Without deceleration, the remnant age would then be yr, consistent with earlier results. Since deceleration must have occurred, this age is an upper limit; we estimate an age of about 110 yr, or an explosion date of about 1900. The flux increase is comparable to reported increases at radio wavelengths. G1.9+0.3 is the only Galactic supernova remnant increasing in flux, with implications for the physics of electron acceleration in shock waves.
1 Introduction
The small Galactic supernova remnant (SNR) G1.9+0.3 was determined to have an age of less than yr based on a comparison of a radio image from 1985 and an X-ray image from 2007 (Reynolds et al. 2008; Paper I). This makes G1.9+0.3 the remnant of the most recent known Galactic supernova. Its X-ray spectrum is highly absorbed ( cm-2; Reynolds et al. 2009 [Paper III]) and dominated by synchrotron emission with a very high rolloff energy, keV. Faint thermal emission can be isolated from the N rim, with line emission from Si, S, Ar, Ca, and Fe, as well as a 4.1 keV line from 44Sc produced in the decay chain from 44Ti (Borkowski et al. 2010; Paper IV).
The mean expansion of G1.9+0.3 between 1985 and 2007 was estimated to be %, or % yr-1 (Paper I). A comparison of the 1985 radio image to a new 2008 VLA111The VLA is part of the National Radio Astronomy Observatory, a facility of the National Science Foundation operated under cooperative agreement by Associated Universities, Inc. radio image confirmed this result, giving a mean expansion rate of 0.65% yr-1 (Green et al. 2008; Paper II). At an assumed distance of 8.5 kpc, consistent with the high X-ray absorption, the implied shock speed is about 14,000 km s-1, comparable to that inferred from measured line widths (Paper IV). The high velocity, and the symmetric nonthermal X-ray morphology, suggest a Type Ia origin, though this is far from certain.
We observed G1.9+0.3 with Chandra again in 2009 for a total of 237 ks, and now have the opportunity of examining the expansion between two X-ray observations. Since the radio and X-ray morphologies differ somewhat (Paper I), it is important to determine an expansion from X-ray data alone, which should give the best indication of the blast wave speed.
2 Observations
Our 2007 observation with using the ACIS-S CCD camera (S3 chip) took place on 2007 February 10 for 24 ks, and March 4 for 26 ks. We checked aspect correction and created new level 1 event files appropriate for VFAINT mode. No flares occurred during the observation. CTI correction was applied and calibration was performed using CALDB version 4.3.1. Finally, the data sets were merged and weighted response files created. About 8000 counts were obtained. We reobserved on 2009 July 13 and July 27 for a total of 237 ks. The same procedures were followed. About 40,000 counts were obtained. We verified that the data sets were well aligned for both observations by using the fitting method described below to compare pairs of sub-observations of the same epoch. We found negligible shifts (far smaller than a pixel). The weighted average interval between observations was 2.408 yr.
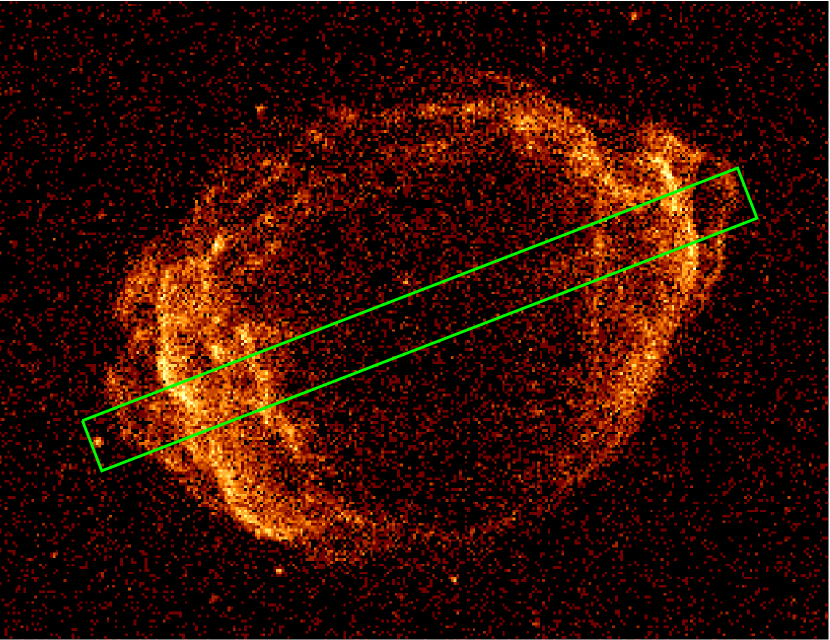
We used an elliptical mask, chosen by inspection, to exclude non-source parts of the image, allowing the analysis to proceed faster. The mask also excluded circular regions surrounding several point sources. We checked that the mask did not skew the results by repeating the analysis without it; the results did not change significantly. Therefore, all results below were obtained with the mask. In addition, we subtracted a constant background, estimated from a region of the 2009 image free of discrete sources.
3 Method
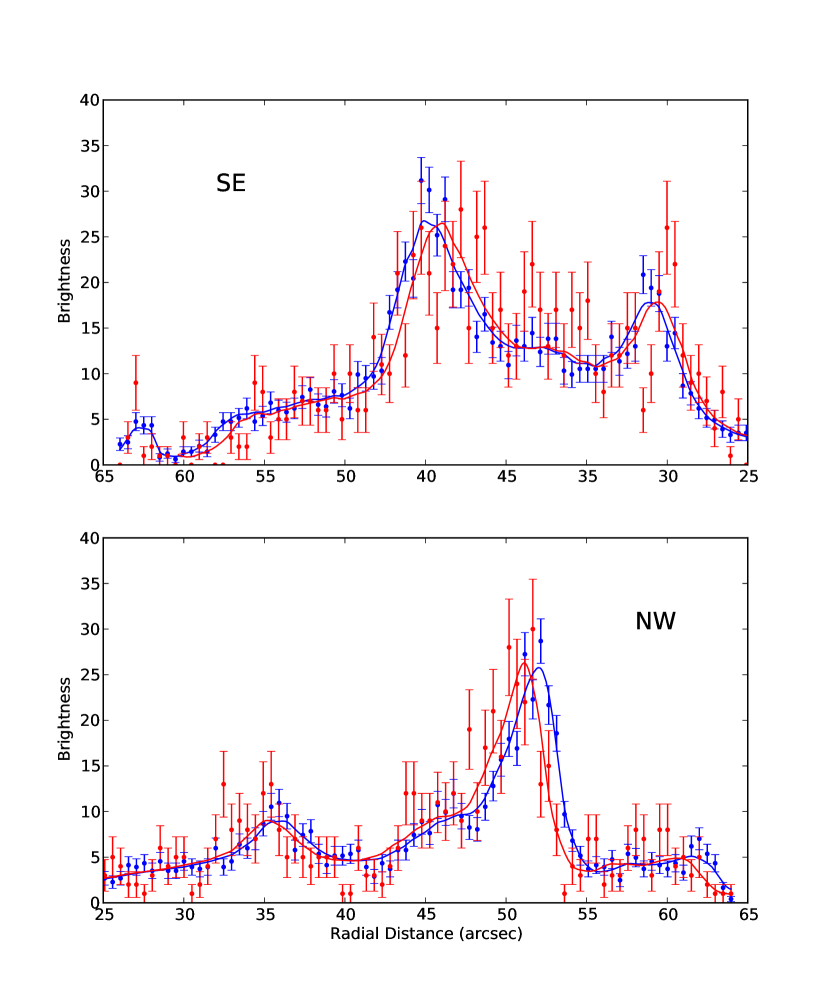
To measure the expansion, we compared the 2009 platelet-smoothed (Willett 2007) image to the raw 2007 data. (We tested for dependence on smoothing method by repeating the analysis with an image smoothed using the spectro-spatial method of Krishnamurthy, Raginsky, & Willett (2010). The results were not significantly different, either in best-fit values or in uncertainties.) The model contains four parameters: a physical scaling factor, a surface brightness scaling factor, and expansion center coordinates. We shrank the background-subtracted image by an overall multiplicative factor about a point chosen by eye to be near the center, scaled its brightness (counts/shrunken pixel) by another factor, added back a background taken from the 2007 image, and shifted the image as necessary to minimize our fit statistic described below. The shift from the originally chosen origin produced an “expansion center,” just the point on the 2009 image from which this simple uniform-expansion model yields the closest approximation to the 2007 data. This method is analogous to the one used by Vink (2008) for Kepler’s supernova remnant.
Because the number of counts per bin is small, the 2007 data are not well-represented by a Gaussian distribution, making the use of the statistic inappropriate. The data are better described by a Poisson distribution: the probability of getting a particular set of data counts is given by
| (1) |
where is the sum of source and background model expectation values. The maximum-likelihood fit can be found by minimizing the Cash statistic (Cash, 1979) given by
| (2) |
In the limit of large numbers of counts, the -statistic becomes identically . The minimum was found using a downhill simplex algorithm. The resulting values for the parameters were found to be independent of the choice of initial values.
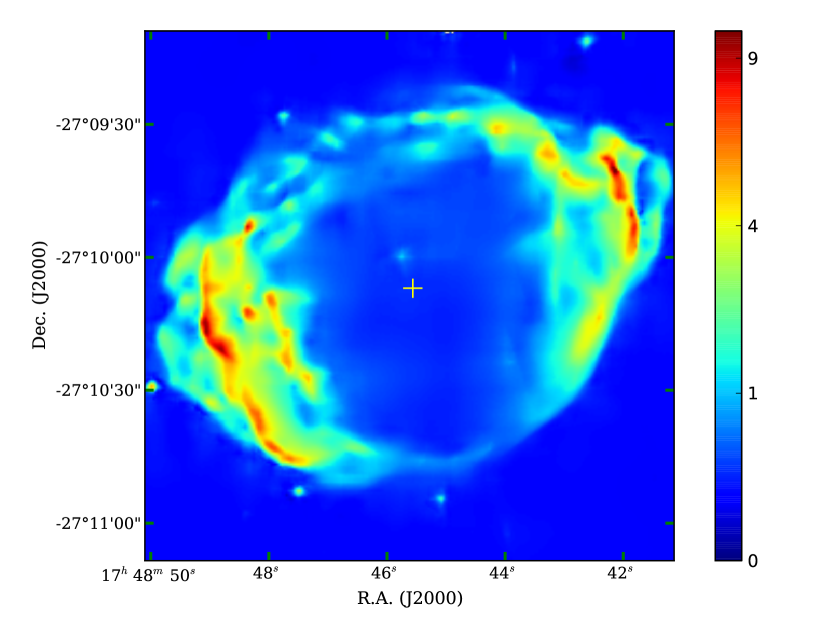
The method produces a factor that represents a change in the surface brightness (counts/pixel) (after scaling by the ratio of exposure times, a factor of 4.779). However, the effective change in pixel size as the 2009 model is shrunk to match the 2007 data means that the X-ray flux changes by an additional factor, just the linear scaling factor squared. Our best-fit value for the linear scale change is %, or an expansion rate of % yr-1. Our brightness scaling factor by which the 2009 model had to be diminished, before correcting for the exposure-time difference, was , indicating a surface-brightness change of a factor of over the 2.408-year interval. After correction for the size increase, this yields a mean flux increase of a factor of % or % yr-1. The derived expansion center is shown as the cross on the X-ray image of Fig. 1. Our results are summarized in Table 1. All errors are 90% confidence intervals.
We also performed Markov chain Monte Carlo (MCMC) simulations using the PyMC software package (Patil et al., 2010). These simulations converged on the same optimal values of the parameters found using our optimization routine presented in Table 1, to an accuracy much better than our reported errors, supporting the validity of the maximum-likelihood method.
By inspection, the remnant appears to have spatial variations in its relative expansion factor and change in brightness. The east and west X-ray bright lobes appeared to expand by a larger factor than the radio-bright northern region and the dimmer southern region. To see if this visual impression was supported statistically, we divided the remnant into four regions and performed a joint fit allowing the regions to have separate expansion and brightness factors, but sharing a common expansion center. The resulting fit was not a significant improvement on the four-parameter fit. Confirmation of spatial variations in the expansion rate will require a deeper observation.
4 Flux Increase
The flux increase can be measured directly by performing a joint analysis of spatially-integrated spectra. We used a simple absorbed power-law model, but instead of subtracting background we modeled it as a combination of sky and particle components (Paper III). Background spectra were extracted from an annulus surrounding the remnant (Paper III, Fig. 2). Source and background spectra from both epochs were fit jointly, using MCMC simulations as implemented in the X-ray software package XSPEC (Arnaud, 1996). We assumed flat priors for the absorbing column density and the power law spectral index , and a logarithmic prior for (absorbed) 2007 and 2009 X-ray fluxes in the energy range from 1 to 7 keV. The fitted absorption is cm-2, , ergs cm-2 s-1, and ergs cm-2 s-1. (We neglect dust scattering, so the value of here includes contributions from both absorption and scattering.) The best estimate of the flux increase is 4.1%, but uncertainties are large (the 90% confidence interval is (1.7%-6.6%), using the 0.05 and 0.95 quantiles of the MCMC draws). Since the thermal contribution to the integrated spectrum is small, the increase is evidently in the synchrotron emission.
The rate of X-ray flux increase is % yr-1. This is consistent with our image-based result, and comparable to the rate of increase in the radio flux density, estimated at 2% yr-1 in Paper II and % yr-1 by Murphy et al. (2008) (1 errors).
5 Discussion
For a distance of 8.5 kpc and a mean shock radius of about (the radius of the bright ring in Fig. 1), our measured expansion rate gives a shock velocity of 13,000 km s-1; the SE-NW extensions beyond the bright ring are at about for a shock velocity of almost 16,000 km s-1. These values bracket the spectroscopically deduced velocities of order 14,000 km s-1 (Paper IV) and indicate that our distance estimate is a good approximation.
While our measured expansion rate gives an upper limit to the age of G1.9+0.3 of 156 yr, it is likely considerably younger because of blast-wave deceleration. Significant deceleration is expected for either a Type Ia or core-collapse (CC) SN explosion. The simplest Type Ia SNR model consists of ejecta with an exponential ejecta density profile, , expanding into a uniform ambient ISM (Dwarkadas & Chevalier, 1998). The velocity scale is equal to km s-1, where and are ejecta kinetic energy (in ergs) and mass (in units of the Chandrasekhar mass ). The free expansion velocity of ejecta at the reverse shock is very high, km s-1, or , where and are the reverse shock radius and age of G1.9+0.3. At very early times, the separation between forward and reverse shocks is a small fraction of their radii, in the model of Dwarkadas & Chevalier (1998) with the standard postshock compression of 4 (corresponding to the adiabatic index ), and less for a cosmic ray modified blast wave with a larger compression. Using mass conservation (McKee, 1974), this fractional separation can be estimated as . There is growing evidence for in young SNR; e.g., Williams et al. (2011) found a large () blast wave compression in the LMC SNR 051969.0. In their hydrodynamical model with , the shocked region thickness is only at early times. We then used a thin-shell approximation (); for ambient medium mass varying as , eqs. (37) and (38) in Chevalier (2005) reduce to , where and . At very early times, for well-behaved, asymptotic thin-shell solutions. This imposes an initial condition at ; it is straightforward to verify that is an exact solution of the ordinary differential equation for that satisfies this initial condition. For uniform ambient medium (), we arrive at an analytic, parametric solution for the dimensionless blast wave radius , where pc and is preshock H density in cm-3. A good match to the measured expansion rate of yr-1 and the remnant’s radius of 2 pc is provided by a fiducial SN model with and at an age of 110 yr and with cm-3. For this model, , , the dimensionless time , and the deceleration parameter .
In the CC scenario, we favor explosions of stripped compact cores over red supergiant explosions, because of the very high shock velocity and the presence of shocked Fe and other heavy elements in the outer ejecta layers. The outermost ejecta in explosions of stripped massive cores (WR stars) are well described by a power law density profile, with (Matzner & McKee, 1999). The blast wave radius initially increases as as SN ejecta are expanding into a WR stellar wind (Chevalier, 1982), so that . Chevalier & Fransson (2006) find that drops slightly to 0.866 yr after the explosion (for a representative WR progenitor), corresponding to (the ejecta density profile becomes less steep as decreases). Since X-ray and radio emission decreases with time while the blast wave propagates through the wind, G1.9+0.3 cannot be at this stage of evolution. Instead, the blast wave must have passed the WR termination shock and now be propagating into the shocked wind with an approximately constant density. The WR termination shock can be less than 2 pc close to the Galactic center where the ISM pressure is much higher than in the solar vicinity. Chevalier et al. (2004) investigated the evolution of bubbles blown by WR stars in high-pressure environments, and found that the wind termination shock stalls at pc for ISM pressures higher than cm-3 K (, , and are the WR wind speed, mass loss rate, and duration in units of 1000 km s-1, yr-1, and yr, respectively). If the current blast wave radius is much larger than the wind termination shock, then (or 0.68 for ; Chevalier 1982), comparable to our estimates for the Type Ia scenario. Intermediate values between 0.68 to 0.87 arise if the termination shock radius is a sizable fraction of the current remnant radius. This will affect the estimated age. With (0.8), G1.9+0.3 is 110 (125) yr old. Ksenofontov et al. (2010) modeled G1.9+0.3 with power-law ejecta with , obtaining an age of only 80 yr (they also relied on estimates of the remnant’s expansion from Papers I and II).
Realistic high-velocity ejecta density profiles in Type Ia SNe may deviate substantially from the idealized exponential profile. High velocity features are frequently seen in Type Ia SN spectra at early times, mostly in Ca II absorption, suggesting the presence of density structures of unknown origin. Type Ia explosion models differ significantly in predicted density profiles at high velocities, including variations in steepness and the presence or absence of distinct density structures. This strongly affects the deceleration of the blast wave, as demonstrated by Badenes et al. (2003, Figs. 2 and 3e). It is then highly desirable to measure the deceleration directly with present and future Chandra observations. This may be feasible with observations spanning the anticipated Chandra lifetime (we hope at least one more decade). Assuming no deceleration, the current expansion age of 156 yr at the mean epoch 2008 would increase to 166 yr at epoch 2018; alternatively, the expansion rate would decrease to % yr -1 from the current value of % yr-1. With , we expect a smaller rate of % yr-1 in 2018. It may be possible to measure this difference, since significant improvements are expected with upcoming long Chandra observations, on account of much better photon statistics and the increased time baseline.
The flux increase we report of about 1.7% yr-1 is consistent with both our estimate of the rate of increase of radio flux (about 2%; Paper II), and that reported by Murphy et al. (2008), % yr-1. As discussed in Paper II, radio flux increases are difficult but not impossible to produce; in the absence of increasing efficiency of magnetic-field amplification and/or particle acceleration, they typically require expansion into a uniform medium. We should note that prompt radio emission from supernovae is observed to drop rapidly with time at frequencies at which it is optically thin (e.g., Panagia et al., 2006); this emission is typically modeled as synchrotron emission from a region occupied by magnetic field and relativistic electrons, with a constant fraction of shock energy going into each component, as a shock moves through a dense stellar wind. The increasing radio and X-ray flux from G1.9+0.3 argues against current interaction with a stellar wind. In the formalism of Katsuda et al. (2010), Appendix A, for expansion into a uniform medium, the intensity at radio wavelengths varies at the fractional rate , where and . In that work, the relativistic-electron density and magnetic-field energy density are both assumed proportional to the post-shock energy density . Then for , appropriate for the integrated radio spectrum of G1.9+0.2, we have The integrated flux , giving a fractional rate . For G1.9+0.3, we consider two cases: undecelerated expansion ( and yr), and ( yr). The undecelerated case then gives a fractional flux increase rate of about 2% yr-1, while the decelerated case gives 1% yr-1, so that the radio results nicely bracket the theoretical expectations.
For a power-law electron distribution with an exponential cutoff above some , the rate of change of intensity and flux will be different in general for observing frequencies , the characteristic synchrotron frequency emitted by electrons with energy in a magnetic field (e.g., Pacholczyk 1970; cgs units). If rises with time, the X-ray flux will rise faster (or decline more slowly) than the radio, while if drops with time, the reverse is true. So the question of whether the X-ray rate of change is larger or smaller than the radio is of considerable theoretical interest. The same Appendix from Katsuda et al. (2010) gives the additional fractional rate of change of intensity (or flux) as , where . For an average over the spectrum of G1.9+0.3, we take (or keV, about the peak in the integrated spectrum). The behavior with time of depends on the mechanism limiting electron acceleration. If radiative losses limit it, Katsuda et al. (2010) show that , while if the finite remnant age is the limitation, . Then undecelerated motion predicts the same rate of change in X-rays as radio for loss-limited acceleration, and a faster rate, about 2.8% yr-1, for age-limited acceleration. For decelerated expansion, both possibilities give slower rates of increase: about 0.6% yr-1 for loss-limited, but only slightly less than 1% yr-1 for age-limited acceleration. Subsequent observations should allow both the radio and X-ray rates of flux increase to be determined more accurately, offering the possibility of determining the mechanisms limiting particle acceleration in G1.9+0.3. We point out that age-limited acceleration would have to limit ion acceleration as well, while if electrons are loss-limited, ions might well be accelerated to much higher energies than those we deduce from electron synchrotron emission.
6 Conclusions
-
1.
The change in morphology of the X-ray emission from G1.9+0.3 is well-described by uniform expansion at a rate of % yr-1 between 2007 and 2009, consistent with earlier observations. Undecelerated expansion would imply an age of yr, but reasonable expectations for either a Type Ia or core-collapse event suggest deceleration with , giving an age of about 110 yr or an explosion date of 1900.
-
2.
The total X-ray flux is increasing at the rate of % yr-1 (90% confidence limits), a rate comparable to radio rates. This increase makes it highly unlikely that G1.9+0.3 is expanding into a stellar wind.
-
3.
Direct determination of deceleration may be possible within the lifetime of Chandra.
References
- Arnaud (1996) Arnaud, K.A. 1996, in ASP Conf. Ser. 101, Astronomical Data Analysis Software and Systems V, ed. G. Barnes & J. Jacoby (San Francisco, CA: ASP), 17
- Badenes et al. (2003) Badenes, C., Bravo, E., Borkowski, K.J., & Domínguez, I. 2003, ApJ, 593, 358
- Borkowski et al. (2010) Borkowski, K.J., Reynolds, S.P., Green, D.A., Hwang, U., Petre, R., Krishnamurthy, K., & Willett, R. 2010, ApJ, 724, L161 (Paper IV)
- Cash (1979) Cash, W. 1979, ApJ, 228, 939
- Chevalier (1982) Chevalier, R.A. 1982, ApJ, 258, 790
- Chevalier et al. (2004) Chevalier, R.A., Li, Z.-H., & Fransson, C. 2004, ApJ, 606, 369
- Chevalier (2005) Chevalier, R.A. 2005, ApJ, 619, 839
- Chevalier & Fransson (2006) Chevalier, R. A. , & Fransson, C. 2006, ApJ, 651, 381
- Dwarkadas & Chevalier (1998) Dwarkadas, V.V., & Chevalier, R.A. 1998, ApJ, 497, 807
- Green et al. (2008) Green, D.A., Reynolds, S.P., Borkowski, K.J., Hwang, U., Harrus, I., & Petre, R. 2008, MNRAS, 387, L54 (Paper II)
- Katsuda et al. (2010) Katsuda, S., Petre, R., Mori, K., Reynolds, S.P., Long, K.S., Winkler, P.F., & Tsunemi, H. 2010, ApJ, 723, 383
- Krishnamurthy et al. (2010) Krishnamurthy, K., Raginsky, M., & Willett, R. 2010, SIAM J. Imaging Sci., 3, 619
- Ksenofontov et al. (2010) Ksenofontov, L.T., Völk, H.J., & Berezhko, E.G. 2010, ApJ, 714, 1187
- Matzner & McKee (1999) Matzner, C.D., & McKee, C.F. 1999, ApJ, 510, 379
- McKee (1974) McKee, C.F. 1974, ApJ, 188, 335
- Murphy et al. (2008) Murphy, T., Gaensler, B. M., & Chatterjee, S. 2008, MNRAS, 389, L23
- Pacholczyk (1970) Pacholczyk, A.G. 1970, Radio Astrophysics (San Francisco: Freeman)
- Panagia et al. (2006) Panagia, N., Van Dyk, S.D., Weiler, K.W., Sramek, R.A., Stockdale, C.J., & Murata, K.P. 2006, ApJ, 646, 369
- Patil et al. (2010) Patil, A., Huard, D., & Fonnesbeck, C.J. 2010, J. Stat. Softw., 35, Issue 4
- Reynolds et al. (2008) Reynolds, S.P., Borkowski, K.J., Green, D.A., Hwang, U., Harrus, I., & Petre, R. 2008, ApJ, 680, L41 (Paper I)
- Reynolds et al. (2009) Reynolds, S.P., Borkowski, K.J., Green, D.A., Hwang, U., Harrus, I., & Petre, R. 2009, ApJ, 695, L149 (Paper III)
- Willett (2007) Willett, R. 2007, in Statistical Challenges in Modern Astronomy IV, eds. G.J. Babu & E.D. Feigelson, APS Conf. Ser. 371, 247
- Williams et al. (2011) Williams, B.J., et al. 2011, ApJ, 729, 65
- Vink (2008) Vink, J. 2008, ApJ, 689, 231
| Parameter | Value | |
|---|---|---|
| Expansion Rate | (0.6420.049)% yr-1 | |
| Surface-Brightness Factor | ||
| Flux Increase Rate (image) | (1.890.86)% yr-1 | |
| Flux Increase Rate (spectrum) | % yr-1 | |
| Expansion Center | RA | 17:48:45.570 |
| (J2000) | Dec | -27:10:06.94 |
Note. — Uncertainties are 90% confidence intervals. Errors on the expansion center are statistical only; Chandra pointing uncertainties are greater.