Lattice dynamics of FeSb2
Abstract
The lattice dynamics of FeSb2 is investigated by the first-principles DFT calculations and Raman spectroscopy. All Raman and infrared active phonon modes are properly assigned. The calculated and measured phonon energies are in good agreement. We have observed strong mixing of the Ag symmetry modes, with the intensity exchange in the temperature range between 210 K and 260 K. The Ag modes repulsion increases by doping FeSb2 with Co, with no signatures of the electron-phonon interaction for these modes.
pacs:
63.20.D-; 71.15.Mb; 71.28.+d; 78.30.Hv;I Introduction
FeSb2 is a strongly correlated narrow-gap semiconductor which has recently attracted a lot of attention due to its unusual thermoelectric properties.1 ; 2 ; 3 ; 4 ; 5 ; 6 It was shown that FeSb2 has colossal thermopower at 10 K (range from 1 mV/K to 45 mV/K1 ; 3.1 ) and the largest power factor ever reported.1 ; 3.1 ; 3.2 ; 3.3 The phonon contribution to remains controversial.6.1 Also, the thermal conductivity of FeSb2 is relatively high and around 10 K is dominated by the phonons.1 Consequently, full knowledge of FeSb2 lattice dynamics is necessary in order to understand the low temperature transport and thermodynamic properties of this material.
The infrared active phonon frequencies of FeSb2 were obtained from the polarized far-infrared reflectivity spectra.10.1 From Eb polarized reflectivity measurements on (102) plane of FeSb2 single crystal, Perucchi et al. observed four modes at 106.4, 231, 257 and 271 cm-1 at 10 K (factor group analysis predicts 3 modes for this polarization configuration). For Eb polarization, both and B3u symmetry modes can be observed from (102) plane. Three (of four) modes at 121, 216 and 261.4 cm-1 are observed for this polarization. Raman scattering measurements on FeSb2 were published in Refs. 7.a, ; 7.b, ; 7, ; 7.1, . Lutz and Müller7.a observed two Raman active modes at about 175 and 154 cm-1 on hot-pressed samples, and assigned them as the Ag symmetry modes. In contrast, Racu et al.7.b observed three Raman modes at about 150, 157 and 180 cm-1 using polarized Raman scattering measurements on FeSb2 single crystals and assigned them as the B1g, Ag and B1g symmetry modes, respectively. Finally, all six Raman active modes of FeSb2 predicted by the factor group analysis (2Ag+2B1g+B2g+B3g) were observed in Ref. 7, . Polarized Raman scattering spectra of the Fe1-xMxSb2 (M=Cr,Co) single crystals was studied in Ref. 7.1, . The linewidths and energies of the Raman modes were analyzed as a function of doping and temperature. Strong electron-phonon interaction, observed for the B1g symmetry mode of pure FeSb2, produces significant mode asymmetry. The electron-phonon interaction is drastically reduced with increasing concentration of Co and Cr in Fe1-x(Co,Cr)xSb2. The mixing of the Ag symmetry phonon modes has been observed both in pure and Cr-doped samples.7.1
In this paper we report ab initio study of the lattice dynamics of FeSb2. The calculated phonon energies in the point are in good agreement with experimental data. Phonon density of state show a gap at about 175 cm-1, which divides a low frequency region where vibration modes are mostly Raman active from a high frequency region where only infrared active modes appear. The calculated phonon dispersions for two Ag symmetry modes indicates strong mode mixing. This is indeed observed in our polarized Raman scattering spectra. The Ag mode intensity exchange in the temperature range between 210 K and 260 K agrees well with theoretical calculations, excluding any additional temperature dependent electron phonon coupling for these modes. The mode repulsion increases with Co doping.
II Experiment
Single crystals of FeSb2 and Fe0.75Co0.25Sb2 were grown by the self-flux method and characterized as described elsewhere.2 The Raman scattering measurements were performed using Jobin Yvon T64000 Raman system in micro-Raman configuration. The 514.5 nm line of an Ar+/Kr+ mixed gas laser was used as an excitation source. Focusing of the laser beam was realized with a long distance microscope objective (magnification ). We have found that laser power level of 0.02 mW on the sample is sufficient to obtain Raman signal and, except signal to noise ratio, no changes of the spectra were observed as a consequence of laser heating by further lowering laser power. The corresponding excitation power density was less then 0.1 kW/cm2. Low temperature measurements were performed between 15 K and 300 K using KONTI CryoVac continuous Helium flow cryostat with 0.5 mm thick window. Raman scattering measurements of pure and Co doped FeSb2 samples were performed using the oriented FeSb2 samples. Selection rules for parallel and crossed polarization from the plane of the orthorhombic crystal symmetry and the mode assignment have been presented in Ref. 7, .
III Numerical method
FeSb2 crystallizes in the orthorhombic marcasite-type structure of the centrosymetric Pnnm (D) space group, with two formula units (Z=2) per unit cell.31 ; 32 Basic structural unit is built up of Fe atoms surrounded by deformed Sb octahedra. These structural units are corner sharing in the (ab) plane and edge sharing along the -axis. Two Fe atoms are in (2a) Wyckoff positions at (0,0,0) and four Sb atoms are in (4g) Wyckoff positions at (0,,) of the Pnnm space group. Our density functional theory (DFT) calculations are performed within generalized gradient approximation (GGA) with PW91 exchange-correlation functional which is used to calculate ultra-soft pseudopotentials,21.1 as implemented in the QUANTUM ESPRESSO package.21 Iron (antimony) pseudopotential takes into account 3s2 3p6 4s2 3d6 (4d10 5s2 5p3) electron states for the valence electrons. The Brillouin zone was sampled with an 888 Monkhorst-Pack k-space mesh and with the Marzari-Vanderbilt cold smearing (0.005Ry).21.2 The obtained optimized structural parameters are =5.859 Å, =6.583 Å, =3.812 Å, =0.1882, and =0.3554, which are in good agreement with the experiment. Our band structure calculations agree well with the previously reported. 6.1 ; 6.a ; 6.b
IV Results and discussion
| Symmetry | Exp.7 | Calculation | Activity | Symmetry | Exp.10.1 ; 10.2 | Calculation | Activity | |
| A | 150.7 | 160.3 | 146.8 | B1u | 195 | 177.4 | ||
| A | 153.6 | 164.4 | 161.2 | B | 106.4 | 108.1 | ||
| B | 154.3 | 164.6 | 173.3 | B | 231.0 | 210.7 | ||
| B | 173.9 | 190.4 | 184.3 | B | 257.0 | 259.6 | ||
| B2g | 90.4 | 89.4 | 271.0 | |||||
| B3g | 151.7 | 95.6 | B | 121.0 | 122.8 | |||
| B | 216.0 | 219.2 | ||||||
| B | 261.4 | 236.6 | ||||||
| A | 84.9 | |||||||
| A | 195.2 |
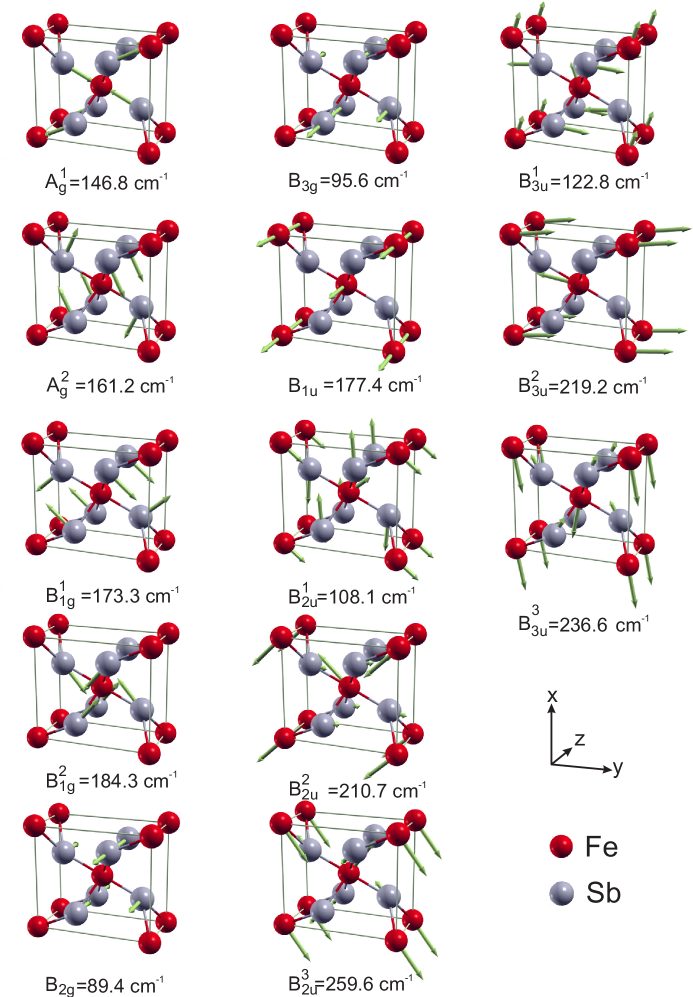
The lattice dynamics is investigated by the density functional perturbation theory (DFPT)123 within the theory of linear response. This method includes calculations of charge response to the lattice distortions (allowed by the symmetry operations) for the specified vectors in the first Brillouin zone. Calculations start from the previously calculated ground state atomic and electronic configuration and continue with the self-consistent calculations of the charge response for each different displacement. The normal modes of the optical active phonons (in the point) are given in Fig. 1. Because Fe ions are located in the center of inversion of Pnnm space group, they do not contribute to the Raman scattering process, i.e. the Raman modes of FeSb2 originate only from the Sb atoms vibrations, in a manner illustrated in Fig. 1. In the case of infrared active modes, both the Fe and Sb atoms contribute to the normal modes, see Fig.1.
In order to obtain the phonon dispersion curves, we have calculated the phonon frequencies at 444 Monkhorst-Pack -points mesh and interpolated along the chosen path. Figure 2(a) shows the calculated phonon dispersions, whereas Fig. 2(b) represents the phonon density of states of FeSb2. It is interesting to note that there is a frequency gap in the phonon dispersion of FeSb2 at about 175 cm-1. The lower frequency range is dominated by Sb-atoms vibrations (mostly Raman active vibrations), whereas the Fe atoms vibrate at frequencies higher than 175 cm-1. These modes are only infrared active.
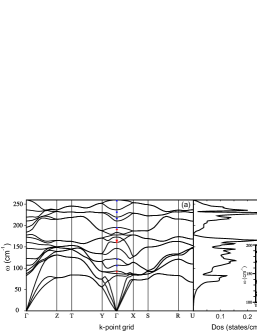
The phonon density of states peaked structure between 50 an 90 cm-1 correspond to the low frequency acoustic modes associated with the low-lying B2g Raman active mode, which calculated frequency is at 89.4 cm-1. Sharp peaks in the phonon density of states above 90 cm-1 come from the flat regions of dispersion curves of corresponding Raman (below 175 cm-1) and infrared (above 175 cm-1) modes.
The lattice dynamics calculations allow us to assign the infrared active modes, experimentally observed in Ref. 10.1, . The assignment of the infrared active modes is done according to the mode energy and symmetry. As we have already mentioned, for (B3u symmetry modes) four modes are observed10.1 instead of three. We believe that the appearance of two modes at about 257 and 271 cm-1 instead of a single frequency mode is the consequence of splitting of relatively broad oscillator (which calculated TO frequency is 259.6 cm-1), due to anharmonicity effects.52 The B1u infrared active mode of FeSb2 is recently observed at 195 cm-1 in Ref. 10.2, .The frequencies and assignment of all infrared active modes are given in Table 1.
The DFT calculations are performed at zero temperature and should be matched with the phonon energies at zero temperature. For this purpose, we have analyzed the change of the Raman mode energy and linewidth with temperature, induced by anharmonicity effect.
The influence of the anharmonic effects on the Raman mode energy can be taken into account via three- and four-phonon processes by applying the Klemens’s ansatz:17 ; Klemens
| (1) |
where is the temperature independent contributions to the Raman mode energy, C (D) is the three (four)-phonon anharmonic constant, and .
There are two main contributions to the phonon linewidth: (i) anharmonic decay of the phonon, and (ii) perturbation of the translational symmetry of the crystal by the presence of impurities and defects. Having this in mind, the phonon linewidth can be described with:
| (2) |
where is the temperature independent linewidth, which originates mainly from (ii), A (B) is the three (four)-phonon anharmonic constant.
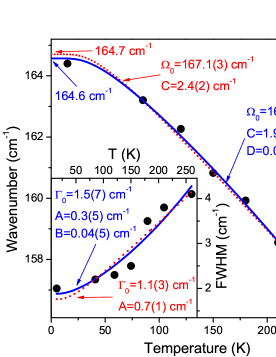
Analysis of energy and FWHM (full width at half maximum) vs. temperature for the B mode is presented in Fig. 3. Because anharmonicity constants ratio B/A and D/C is very small, see Fig. 3, the contribution of the four-phonon processes is small compared to that of the three-phonon processes. The obtained value of 164.6 cm-1 for this mode at zero temperature is in good agreement with the DFT results. Similar analysis have been performed for B symmetry mode giving the value of 190.4 cm-1 at zero temperature,7.1 which is in rather good agrement with our calculations.
The calculated energy (89.4 cm-1) for the B2g symmetry mode in the point shows excellent agreement with the room temperature experimental data. This is to be expected since low energy modes show week anharmonicity effects. Surprisingly large discrepancy between experimental and calculated phonon energies is observed for the B3g mode. Since the B2g and B3g modes have similar normal modes, the chain rotation around the x and y axis, respectively (see Fig. 1) their frequencies should be very close. This large disagreement is also unexpected since all other calculated phonon energies show rather good agreement with the experimentally obtained data. By detailed inspection of our previously published Raman spectra7 of pure, Co and Cr doped FeSb2 samples we did not find any mode in a low frequency region close to the calculated frequency (95 cm-1) for the B3g mode. The missing B3g mode is most probably of a very low intensity and it was not possible to extract it from the noise. The mode observed at 151.7 cm-1 for (x’y) polarization, which we assigned in Ref. 7, as the B3g mode, could be the ”leakage” of the A mode, which appears at about 150.7 cm-1 in the () polarization.
It is interesting to note that the dispersion curves of two Ag symmetry Raman modes have opposites slopes near the point (see the inset of Fig. 2(b)), which leads to the mode mixing with the ”anticrossing” effect. A mode represents stretching vibration of Sb ions, whereas A mode represents twisting of Sb ions which tent to rotate Sb ions around the z-axis, see Fig 1. In our previous paper,7.1 we showed the existence of the Ag mode mixing in the case of pure FeSb2 and Cr alloyed samples. Here we present detailed analysis of the mixing of two Ag modes for pure and 25% Co alloyed samples.
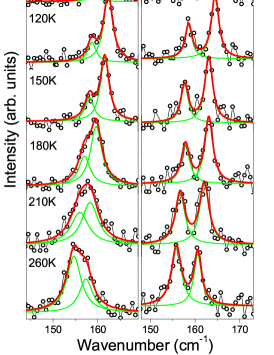
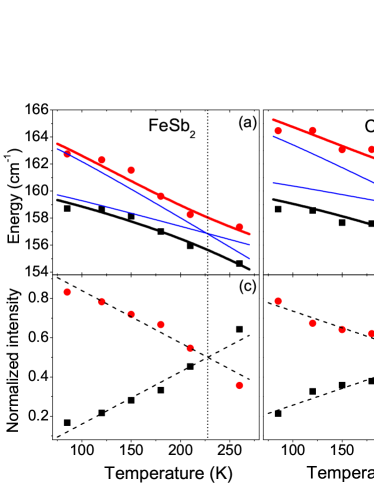
The polarized Raman scattering spectra for pure FeSb2 (left panel7.1 )and Fe0.75Co0.25Sb2 (right panel) single crystals, measured in the configuration (Ag modes) at different temperatures, are presented in Fig. 4. The Lorentzian lineshape profile has been used for the extraction of mode energy and linewidth. Fig. 5 shows the energies and normalized intensities as a function of temperature of the Ag modes for FeSb2 and Fe0.75Co0.25Sb2 single crystals. In the observed temperature range, energies of two Ag modes for pure and 25% Co doped samples are very close which implies the existence of the mode mixing, manifested by mode repulsion and intensity transfer with the change of temperature.13 Indeed, intensities of these modes are exchanged for both samples in the temperature range between 210 and 260 K (see Figs. 4 and 5).
In general, two phonon branches or any other elementary excitations of the same symmetry, may couple leading to the renormalization of the quasiparticle energies. Coupling between two phonon branches yields to the energy and linewidth changes (anticrossing effect). We can consider the coupling of two phonon branches as coupling of two quantum oscillators. When the perturbation is small, we can write the Hamiltonian of the system as
| (3) |
where is the interaction constant, and are the unperturbed mode energies, obtained by takeing into account, due to simplicity, only three-phonon process in Eq. (1). The eigenvalues of the Hamiltonian are given by
| (4) |
Eq. (4) gives a rather good fit of the experimental data (solid lines in Fig. 5 (a),(b)), suggesting the absence of any additional temperature dependent couplings (i.e. electron-phonon interaction) for these modes. Fitting parameters are presented in Table 2.
| Compound | Symmetry | (cm-1) | (cm-1) | V (cm-1) |
| FeSb2 | A | 167.1 | 2.65 | 1.2 |
| A | 161.5 | 1.16 | ||
| Fe0.75Co0.25Sb2 | A | 167.5 | 2.2 | 2.4 |
| A | 161.9 | 0.80 |
Zero-temperature energies of A and A symmetry modes, in the absence of interaction, for pure (25% Co dopped) sample are cm-1 and cm-1 ( cm-1 and cm-1). One can notice that the zero-temperature energies for decoupled modes are increased by 0.8 cm-1 (about 0.5% increase) with 25% Co dopping, corresponding to the unit cell volume contraction.4 The phonon energy of the bond-stretching mode scales as , where is the bond length.51 Since the change in is proportional to the inverse volume change, we can expect the phonon-energy change for bond-stretching modes (Ag modes) to be inversely proportional to the volume change. Because the Co atom substitutes Fe atom, which is located in the center of the inversion, there is no change in Raman spectra due to the mass effect. Additional repulsion between the coupled modes are due to the interaction. With Co doping, the interaction constant increases, resulting in larger mode separation for the 25% dopped sample.
V Conclusion
In summary, we presented a detailed theoretical and experimental study of the FeSb2 phonon dynamics. All experimentally observed Raman and infra-red active modes were successfully assigned. The calculated phonon frequencies in the point agree with the measured frequencies. We believe that the low energy B3g mode is of a very low intensity and therefore is not observed in the Raman experiments. The phonon mode at 150.7 cm-1, which we previously assigned as the B3g mode, could be the ”leakage” of the A mode. The strong intensity exchange of the Ag symmetry modes, observed in our Raman scattering experiments in the temperature range between 210 K and 260 K, is successfully described by a simple model of coupling of two phonon branches with the same symmetry. The mode mixing is also implied from the calculated dispersion curves, which show opposite slopes for two Ag modes near the point. We find that doping of FeSb2 with Co increases the Ag modes repulsion.
Acknowledgment
This work was supported by the Serbian Ministry of Education and Science under Projects ON171032, III45018, ON171017. Part of this work (C. P. and R. H.) was carried out at the Brookhaven National Laboratory which is operated for the Office of Basic Energy Sciences, U.S. Department of Energy by Brookhaven Science Associates (DE-Ac02-98CH10886). Numerical simulations were run on the AEGIS e-Infrastructure, supported in part by FP7 projects EGI-InSPIRE, PRACE-1IP and HP-SEE. Z.V.P. and M.M.R. acknowledge support from the Swiss National Science Foundation through the SCOPES Grant No. IZ73Z0-128169.
∗ Present address: Department of Physics, University of Maryland, College Park MD 20742-4111, USA.
References
- (1) C. Petrovic, J. W. Kim, S. L. Bud’ko, A. I. Goldman P. C. Canfield, W. Choe, and G. J. Miller, Phys. Rev. B 67, 155205 (2003).
- (2) C. Petrovic, Y. Lee, T. Vogt, N. D. Lazarov, S. L. Bud’ko, and P. C. Canfield, Phys. Rev. B 72, 045103 (2005).
- (3) Rongwei Hu, V. F. Mitrović, and C. Petrovic, Phys. Rev. B 74, 195130 (2006).
- (4) Rongwei Hu, V. F. Mitrović, and C. Petrovic, Phys. Rev. B 76, 115105 (2007).
- (5) A. Bentien, S. Johnsen, G. K. H. Madsen, B. B. Iversen, and F. Steglich, Europhys. Lett. 80, 39901 (2007).
- (6) Rongwei Hu, V. F. Mitrović, and C. Petrovic, Appl. Phys. Lett. 92, 182108 (2008).
- (7) P. Sun, N. Oeschler, S. Johnsen, B. B. Iversen, and F. Steglich, Dalton Trans. 39, 1012 (2010).
- (8) Peijie Sun, Niels Oeschler, Simon Johnsen, Bo Brummerstedt Iversen, and Frank Steglich, Phys. Rev. B 79, 153308 (2009).
- (9) H. Takahashi, Y. Yasui, I. Terasaki and M. Sato, J. Phys. Soc. Japan 80, 154708 (2011).
- (10) J. M. Tomczak, K. Haule, T. Miyake, A. Georges, and G. Kotliar, Phys. Rev. B 82, 085104 (2010).
- (11) A. Perucchi, L. Degiorgi, Rongwei Hu, C. Petrovic, and V.F. Mitrović, Eur. Phys. J. B 54, 175 (2006).
- (12) H. D. Lutz and B. Müller, Phys. Chem. Miner. 18, 265 (1991).
- (13) A. M. Racu, D. Menzel, J. Schoenes, M. Marutzky, S. Johnsen, and B. B. Iversen, J. Appl. Phys. 103, 07C912 (2008).
- (14) N. Lazarević, Z. V. Popović, Rongwei Hu, and C. Petrovic, Phys. Rev. B 80, 014302 (2009).
- (15) N. Lazarević, Z. V. Popović, Rongwei Hu, and C. Petrovic, Phys. Rev. B 81, 144302 (2010).
- (16) H. Holseth, and A. Kjekshus, Acta Chem. Scand. 22, 3273 (1968).
- (17) H. Holseth, A. Kjekshus, and A. F. Andresen, Acta Chem. Scand. 24, 3309 (1970).
- (18) http://www.quantum-espresso.org/pseudo.php.
- (19) P. Giannozzi, S. Baroni, N. Bonini, M. Calandra, R. Car, C. Cavazzoni, D. Ceresoli, G. L Chiarotti, M. Cococcioni, I. Dabo, A. Dal Corso, S. de Gironcoli, S. Fabris, G. Fratesi, R. Gebauer, U. Gerstmann, C. Gougoussis, A. Kokalj, M. Lazzeri, L. Martin-Samos, N. Marzari, F. Mauri, R. Mazzarello, S. Paolini, A. Pasquarello, L. Paulatto, C. Sbraccia, S. Scandolo, G. Sclauzero, A. P Seitsonen, A. Smogunov, P. Umari, and R. M Wentzcovitch, J. Phys. Condens. Matter 21, 395502 (2009).
- (20) N. Marzari, D. Vanderbilt, A. De Vita, and M. C. Payne, Phys. Rev. Lett. 82, 3296 (1999).
- (21) A. V. Lukoyanov, V. V. Mazurenko, V. I. Anisimov, M. Sigrist, and T. M. Rice, Eur. Phys. J. B 53, 205 (2006).
- (22) A. Bentien, G. K. H. Madson, S. Johnsen, and B. B. Iversen, Phys. Rev. B 74, 205105 (2006).
- (23) S. Baroni, S. de Gironcoli, A. Dal Corso, and P. Giannozzi, Rev. Mod. Phys. 73, 515 (2001).
- (24) F. Gervais and B. Piriou, Phys. Rev. B 10, 1642 (1974).
- (25) A. Herzog, M. Marutzky, J. Sichelschmidt, F. Steglich, S. Kimura, S. Johnsen, and B. B. Iversen, Phys. Rev. B 82, 245205 (2010).
- (26) M. Balkanski, R. F. Wallis, and E. Haro, Phys. Rev. B 28, 1928 (1983).
- (27) P. G. Klemens, Phys. Rev. 148, 845 (1966).
- (28) M. N. Iliev, M. V. Abrashev, J. Laverdi re, S. Jandl, M. M. Gospodinov, Y.-Q. Wang, and Y.-Y. Sun, Phys. Rev. B 73, 064302 (2006).
- (29) Z. V. Popović, V Stergiou, Y. S. Raptis, M. J. Konstantinović, M. Isobe, Y. Ueda, and V. V. Moshchalkov, J. Phys.: Condens. Matter 14, L583 (2002).