Galaxy pairs in the Sloan Digital Sky Survey - IV: Interactions trigger AGN.
Abstract
Galaxy-galaxy interactions are predicted to cause gas inflows leading to enhanced nuclear star formation. This prediction is borne out observationally, and also supported by the gas-phase metallicity dilution in the inner regions of galaxies in close pairs. In this paper we test the further prediction that the gas inflows lead to enhanced accretion onto the central supermassive black hole, triggering activity in the nucleus. Based on a sample of 11,060 Sloan Digital Sky Survey galaxies with a close companion ( kpc, V 200 km s-1), we classify active galactic nuclei (AGN) based either on emission line ratios or on spectral classification as a quasar. The AGN fraction in the close pairs sample is compared to a control sample of 110,600 mass- and redshift-matched control galaxies with no nearby companion. We find a clear increase in the AGN fraction in close pairs of galaxies with projected separations 40 kpc by up to a factor of 2.5 relative to the control sample (although the enhancement depends on the chosen S/N cut of the sample). The increase in AGN fraction is strongest in equal mass galaxy pairings, and weakest in the lower mass component of an unequal mass pairing. The increased AGN fraction at small separations is accompanied by an enhancement in the number of ‘composite’ galaxies whose spectra are the result of photoionization by both AGN and stars. Our results indicate that AGN activity occurs (at least in some cases) well before final coalescence and concurrently with ongoing star formation. Finally, we find a marked increase at small projected separations of the fraction of pairs in which both galaxies harbour AGN. We demonstrate that the fraction of double AGN exceeds the expected random fraction, indicating that some pairs undergo correlated nuclear activity. We discuss some of the factors that have led to conflicting results in previous studies of AGN in close pairs. Taken together with complimentary studies, we favour an interpretation where interactions trigger AGN, but are not the only cause of nuclear activity.
keywords:
Galaxies: interactions, galaxies: active1 Introduction
There are several lines of evidence that indicate that the build-up of stellar mass in galactic bulges is closely linked to the evolution of the central black hole (e.g. Haehnelt, Natarajan & Rees 1998; Richstone et al. 1998). Gravitational torques have been shown to be effective at funneling gas to the centres of galaxies to feed both star formation and accretion onto the central black hole (e.g. Haan et al. 2009) and there is a remarkably tight relationship between the stellar properties of the bulge and the mass of the black hole (Magorrian et al 1998; Ferrarese & Merritt 2000; Gebhardt et al. 2000). The similarities in the shape of the redshift evolution of both star formation rates and the frequency of active galactic nuclei (AGN) indicate a common physical driver between the two processes. There is considerable observational evidence linking AGN activity with star formation, such as bluer colours in AGN hosts (Silverman et al. 2009) and correlations between star formation activity and AGN power (Cid-Fernandes et al. 2001; Choi, Woo & Park 2009). In turn, both observations and simulations suggest that feedback from the AGN itself may quench the star formation (Kauffmann et al. 2003a; Di Matteo et al. 2005; Schawinski et al. 2007, 2009; Bundy et al 2008; van de Voort et al. 2011; Kaviraj et al. 2011).
The obvious culprit for building both the central stellar mass and feeding the black hole (and hence increasing its activity) is a ready supply of gas for fuel and galaxy-galaxy mergers represent a natural mechanism for providing this gas in wholesale quantities (Kauffmann & Haehnelt 2000; Cattaneo et al. 2005; Di Matteo et al. 2005;Springel, Di Matteo & Hernquist 2005; Wild et al. 2007; Hopkins et al. 2008). Many authors have found evidence for mergers associated with AGN hosts (e.g. Surace et al. 1998; Canalizo & Stockton 2001; Sanchez & Gonzalez-Serrano 2003; Jahnke et al. 2004; Smirnova et al. 2006; Combes et al. 2009; Villar-Martin et al. 2010, 2011), leading to an often cited connection between the merger process and AGN triggering. The discovery of double AGN also lend circumstantial support to a merger origin (e.g. McGurk et al. 2011 and references therein). However, although some studies claim a connection between nuclear activity and the presence of close companions (Dahari 1984; Keel et al. 1985; Rafanelli et al. 1995; Koss et al. 2010), other studies have claimed that there is statistically no difference in the percentage of galaxies with companions between active and inactive galaxies (Schmitt 2001; Coldwell & Lambas 2006; Grogin et al. 2005). Similarly, there are claims that AGN hosts are no more tidally distorted than inactive galaxies (Dunlop et al. 2003; Gabor et al. 2009; Cisternas et al. 2011; Kocevski et al. 2011), but counter claims also exist (e.g. Koss et al. 2010; Ramos Almeida 2011a,b). Various biases may contribute to these discrepant results, including sample size, wavelength-dependent dust extinction, image depth, adequate definition of a control sample, automated versus visual classification and distinction between Type I and Type 2 AGN (e.g. Darg et al. 2009; Dultzin et al. 2010; Koss et al. 2010; Liu et al. 2011a,b; Ramos Almeida et al. 2011b). Nonetheless, the null results have led some authors to conclude that there is actually little evidence for a connection between merging and AGN triggering (e.g. Grogin et al. 2005; Gabor et al. 2009; Cisternas et al. 2011). These conclusions potentially undermine one of the cornerstones of our modern paradigm of galaxy evolution: the triggering of AGN through merger events.
A natural way to test the connection between mergers and AGN is to use close pairs of galaxies which can be classified as either star-forming or AGN-dominated on the basis of their emission line ratios. Close pairs have been unequivocally demonstrated to have enhanced star formation rates (Kennicutt et al., 1987; Barton, Geller & Kenyon 2000; Lambas et al 2003; Alonso et al. 2004; Nikolic, Cullen & Alexander 2004; Woods, Geller & Barton 2006; Woods & Geller 2007; Ellison et al. 2008, 2010; Patton et al. 2011; Liu et al. 2011b) and evidence for gas inflows, as indicated by diluted interstellar medium metallicities (Kewley et al. 2006a; Ellison et al. 2008; Michel-Dansac et al. 2008; Kewley et al. 2010; Rupke et al. 2010; Scudder et al. in preparation). Similar enhancements in star formation rates (SFRs) and low gas phase metallicities have been reported for other classes of galaxies that are likely to be post-mergers, such as luminous infrared and ‘lopsided’ galaxies (Rupke, Veilleux & Baker 2008; Reichard et al. 2009). It is therefore perhaps surprising that the results for AGN fractions in close pairs are considerably more controversial. For example, Alonso et al. (2007), Woods & Geller (2007) and Rogers et al. (2009) all find higher AGN fractions in samples of close pairs, relative to a control sample of field galaxies. Conversely, Li et al. (2006, 2008) and Ellison et al. (2008) and Darg et al (2009) do not find a statistically significant difference in AGN fractions.
One of the issues that hampers the observational association between mergers and AGN ignition is the expected time delay between clear signs of merging (e.g. well identified galactic components and strong tidal features), the presence of triggered star formation and, finally, the activity in the nucleus. This complication was highlighted by Storchi-Bergmann et al. (2001) in their study of Seyfert 2 galaxies. The majority of the Seyferts with close companions show signs of recent nuclear star formation, leading Storchi-Bergmann et al. to suggest that the pure Seyfert spectrum emerges after the main starburst has faded. A similar evolutionary scenario was suggested by Haan et al. (2008), whereby low luminosity AGN precede Seyferts after a merger, based on high fractions of the former, but few of the latter in a sample of galaxies with disturbed HI disks. Delays are also implied by the intermediate colours and spectral characteristics of AGN hosts, indicating at least 100 Myr between the decline of star formation and black hole activity (Schawinski et al. 2009). Indeed, by the time galaxies have migrated from their peak star-forming days into the ‘green valley’ and/or show signs of strong AGN, their morphologies do not exhibit any residual signs of interactions (Cisternas et al. 2011; Mendez et al. 2011). Delays of a few hundred megayears between the epochs of peak star formation and peak black hole accretion are also inferred from simulations (Wild, Heckman & Charlot 2010; Hopkins 2011). Although gas inflow leads to triggered star formation after the first pericentric passage, the highest enhancements are seen when the galaxies finally merge. If coalescence also represents the peak in AGN activity, this may further contribute to the difficulty in connecting AGN with galaxy pairs.
In this paper, we use a large sample (Section 2) of close galaxy pairs to return to the question of AGN fractions in galaxy-galaxy interactions. One novelty in the current study is the application of a variety of AGN classifications (Section 3) which permit different contributions from AGN and star formation. The varying strictness of these diagnostics allows us to obtain some measure of how dominant the AGN contribution is. This will be useful if our sample includes a significant fraction of galaxies that are just transitioning between their star-forming and AGN phases, the so-called composite population. Most previous works have used a single sample of close pairs (with separations typically 30 kpc) and calculated a single AGN fraction to be compared with the field (e.g. Alonso et al. 2007; Ellison et al. 2008; Darg et al. 2009). However, one of the benefits of our large sample size is that we can investigate the AGN fraction as a function of projected separation and as a function of pair mass ratio (Section 4). This has only been attempted once before by Woods & Geller (2007) with a sample around 1/3 the size of ours. Finally, we will investigate whether there is any evidence of simultaneous triggering of AGN (Section 5). In particular we will quantify whether the fraction of double AGN pairs is consistent with the expectation from random occurrence, or whether there is a component of correlated AGN pairs.
2 Sample selection
The sample of pairs used in this work differs significantly from that used in previous papers in this series (Ellison et al. 2008, 2010; Patton et al. 2011) in several respects. Previously, the pairs sample was constructed from only the SDSS galaxy (specclass=2) sample. However, in this work, we are interested in the AGN contribution, so we have extended our search for pairs to also include objects classified as QSOs (specclass=3) which have been classified as galaxies from the SDSS imaging. For clarity, we will refer to objects with specclass values of either 2 or 3 as ‘galaxies’. The parent sample of galaxies from which we will select the pairs is restricted to the SDSS legacy area (i.e. excluding the Segue footprint) with extinction corrected -band Petrosian magnitudes in the range . Our previous works have used stellar masses calculated from SDSS photometry made available by the Max Planck Institut fur Astrophysik/Johns Hopkins University (MPA/JHU) collaboration111http://www.mpa-garching.mpg.de/SDSS/. However, in Simard et al. (2011), we have shown that the SDSS photometry becomes unreliable for galaxies with close companions (see also Figure 10 in Patton et al. 2011). Simard et al. (2011) recomputed the magnitudes for 1.2 million SDSS galaxies using improved sky subtraction and object definition techniques, combined with morphological decompositions. These improvements dramatically improved the quality of photometric measurements in close pairs (e.g. Figure 11 of Simard et al. 2011). We therefore re-compute stellar masses using the updated photometry of Simard et al. (2011).
The masses are derived using a simple relation between g-r colour and mass-to-light ratio (M/L) derived from MPA/JHU data catalogues, which we parametrise as a double power-law. M/L measurements in the MPA/JHU catalogues were derived from fits to the SDSS model photometry to a suite of synthetic SEDs spanning a broad range of star-formation histories (Kauffmann et al. 2003b; Salim et al. 2007), and are corrected for the influence of emission lines on the SDSS photometry. Model SEDs were constructed using galaxev (Bruzual & Charlot 2003) with a Chabrier (2003) initial mass function, and galaxies were assumed to be well described by the combination of an underlying, exponentially declining star-formation history and stochastically-sampled bursts. Simard et al. (2011) show that their magnitudes are on average 0.05 to 0.1 mag brighter that the SDSS model magnitudes and, more importantly for this work, are less prone to deblending errors at small galaxy–galaxy separations (see also Patton et al. 2011). We therefore adopt our updated masses throughout this work, although note that our results are qualitatively similar if we use the MPA/JHU stellar masses.
We impose a minimum redshift of 0.01 to avoid non-cosmological values and a maximum value of 0.20 above which the sample becomes increasingly incomplete. The final criterion for inclusion in the parent sample is that the SDSS redshift confidence parameter must have a value of , i.e. the confidence level of the redshift is greater than 70 per cent (our results are unaffected by increasing this cut to higher confidence levels).
From the parent sample we select pairs and higher order multiples22294 per cent of our sample consists of pairs, approximately 6 per cent are triples and less than 1 percent are higher order multiples. with a companion within 80 kpc, V 200 km s-1 and with stellar mass ratios 0.1 . Fibre collisions lead to a high incompleteness at separations 55 arcseconds which biases the mass and redshift distribution of close pairs (Ellison et al. 2008; Patton & Atfield 2008). We therefore follow Ellison et al. (2008) and exclude a random 67.5% of pairs with 55 arcseconds to yield a pairs sample with unbiased selection as a function of separation. Before the cull is implemented, there is a clear trend towards larger masses at small separations. Since there is a strong dependence of AGN fraction on mass, this artificially introduces an increased AGN fraction at small separations. After the cull, the distrubution of masses and redshifts with projected separation is flat. There are 11,060 galaxies in the full pairs sample of which 46 are classified as QSOs.
A control sample is constructed by iteratively matching galaxies in both mass and redshift from a pool of galaxies with no close companion within 80 kpc and 10,000 km s-1. The control sample is vital since the AGN fraction depends sensitively on galactic properties such as mass, luminosity, colour, morphology and concentration (Kauffmann et al. 2003b; Best et al. 2005; Choi, Woo & Park 2009; Ellison et al. 2008). Matching in mass largely mitigates these differences, as well as dealing with aperture bias (the varying covering fraction as a function of redshift). The matching procedure finds the best simultaneous match in mass and redshift to each galaxy (i.e. both members of the pair are matched separately) and calculates the Kolmogorov-Smirnov (KS) probability that the masses and redshifts of the control and pairs are drawn from the same distribution. If the KS probability is above 30%, the matching is repeated up to the best match. We are able to match 10 controls to each galaxy in a pair before the KS test fails, yielding a control sample of 110,600 galaxies. We keep track of which controls are matched to which pair galaxy so that we can include only the relevant controls for different subsamples of pairs.
3 AGN diagnostics
3.1 Background
Since their early use in distinguishing spectra dominated by AGN (Baldwin, Phillips & Terlevich 1981; Veilleux & Osterbrock 1987), line ratio diagrams have evolved into a standard tool for categorizing the dominant source of ionizing radiation in a galaxy (Dopita et al. 2000; Kewley et al. 2001, 2006b; Kauffmann et al. 2003a; Stasinska et al. 2006; Groves et al. 2006; Cid-Fernandes et al. 2010). The principle behind these diagnostic diagrams is to distinguish the excitation mechanism (photoionization by hot stars, AGN or shock heating). The various mechanisms result in a different ionization structure in the interstellar gas, and changes in the relative sizes of the ionized, partly ionized and neutral media. The inner zone is highly ionized, hosting species such as [OIII]. The outer zone is the primary location of the lower ionization species such as [OII] and some of the [NII]. Forming a partially ionized zone requires a relatively hard spectrum as the decreasing cross section of hydrogen (and other species) means that only the high energy photons penetrate. This means that the partially ionized zone is prevalent in the presence of an AGN and shocks, but virtually absent with stellar spectra. [NII], [OI] and [SII] are all formed in the partially ionized zone, and can be boosted further by collisional excitation. The differences in structure and ionization balance are encapsulated in a single ionization parameter, : the ratio of hydrogen ionizing photon flux per unit area to the local number density of hydrogen atoms. In terms of the choice of line ratios used to distinguish the ionizing source, preference is usually given to those that are relatively close in wavelength in order to avoid a significant dependence on internal extinction properties.
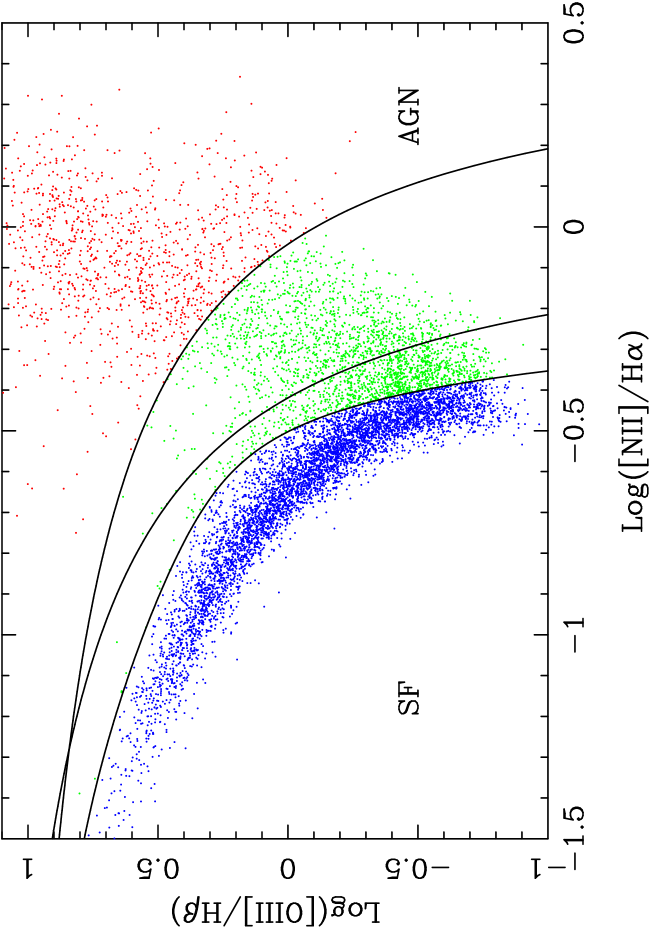
The most commonly used combination of line ratios is [NII]/H versus [OIII]/H, often simply referred to as the BPT diagram after Baldwin, Phillips & Terlevich (1981). Although galaxies dominated by star-formation and AGN broadly distinguish themselves as two ‘wings’ on the BPT diagram, the precise demarcation is not clear. Using photoionization models, Kewley et al. (2001, K01) proposed a classification scheme that extends into the AGN wing of the BPT diagram. The Kewley et al. (2001) classification includes the most extreme models of starburst galaxies in terms of metallicity and star formation rate. However, galaxies classified as star-forming by the Kewley (2001) system may contain up to 20% contribution from AGN (Stasinska et al. 2006). Stasinska et al. (2006, S06) also model a range of ionization parameters and metallicities, but with updated model atmospheres, resulting in a more stringent demarcation between AGN and star-forming galaxies. Between these extremes, Kauffmann et al. (2003a, K03) have proposed an empirical distinction between AGN and HII-region dominated galaxies, based on a sample of 23,000 galaxies from the SDSS.
3.2 Application to the SDSS sample
Galaxies in our sample are classified as AGN based on the ratios of strong emission lines, or based on their spectral classification as QSOs (specclass=3). Emission line fluxes are taken from the MPA/JHU catalogues. The catalogue fluxes are already corrected for underlying stellar absorption and Galactic extinction. Galaxies not present in the MPA/JHU catalogues are discarded (this includes some specclass=3 QSOs, most notably those with large Balmer line widths). Fluxes are further corrected for internal extinction using the ratio of H/H and an SMC extinction curve (Pei 1992). The minimum criterion for AGN classification is the detection at of H , [OIII] 5007, H and [NII] . There are also cuts on the flux error and continuum error of the emission lines that clip spurious measurements, see Scudder et al. (in preparation) for full details.
In this paper, we will investigate all three of the common BPT classification schemes: Kewley et al (2001), Kauffmann et al. (2003a) and Stasinska et al. (2006). The distinction between AGN and star-forming galaxies for the 3 schemes are given in equations 1 (K01), 2 (K03) and 3.2 (S06).
| (1) |
| (2) |
| (3) |
Figure 1 shows how these boundaries map on to the standard emission line diagram for our control sample. We consider galaxies classified by the K01 scheme as AGN, to be ‘pure’ AGN and galaxies classified by S06 as star-forming to be ‘pure’ star-forming. Galaxies classified as AGN by S06 and star-forming by K01 are considered as ‘composite’ (e.g. Ho, Filippenko & Sargent 1993) objects as they may contain contributions from both AGN and HII region spectra. Galaxies may also reside in the composite zone if they have particularly high star-formation rates, high metallicities or harbour shock-excited gas. AGN may themselves be divided into Seyfert galaxies and those that exhibit weaker, low ionization emission lines, the so-called ‘low ionization nuclear emission line region’ objects (LINERs, Heckman 1980). Although the excitation mechanism for LINERs is itself ambiguous, it is likely to originate from a non-stellar process (Ho et al. 1993). In this paper, we do not consider these finer AGN classifications or the effects of shock excitation. Although the latter may be present in mergers, the SDSS spectra can not easily diagnose its presence (Rich et al. 2010, 2011).
4 The AGN fraction in galaxy pairs
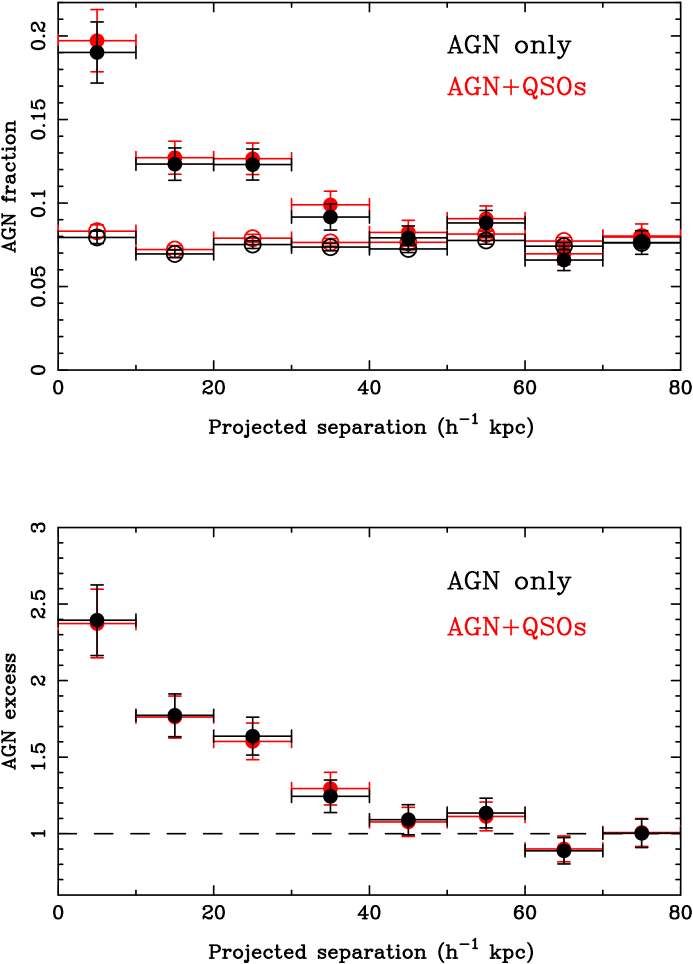
We begin simply, by using the BPT diagram to classify galaxies as AGN or non-AGN. For this exercise, we first use the S06 diagnostic to distinguish between the two galaxy classes, as it includes even a modest amount of nuclear activity. Galaxies with a QSO classification are also included in the AGN sample. Figure 2 shows the AGN fraction of pairs as a function of projected separation (). Note that we quote the AGN fraction of the full pairs sample, which contains both emission line galaxies that can be classified as AGN on the BPT diagram, and quiescent galaxies with no strong emission lines. For comparison, we show results both with and without the minority of galaxies with a QSO classification. There is a steady increase towards small projected separation in the AGN fraction for pairs with kpc. The control galaxies show no such dependence on , where the projected separation for the control galaxies reflects the value of the pairs to which they are matched. This result qualitatively supports the findings of Alonso et al. (2007) who found a 10% increase in AGN fraction at kpc (see also Woods & Geller 2007 and Rogers et al. 2009). However, we note that the actual fractional increase in AGN is not comparable between ours and previous works, whose samples contain only emission line galaxies (see Section 6 for further discussion). The lower panel of Figure 2 shows the ratio of the AGN fraction in pairs relative to the control, i.e. the excess of AGN in the pairs. At the closest separations ( kpc) AGN are 2.5 times more common in pairs than in the control sample. The inclusion of QSOs makes a negligible impact on these statistics.
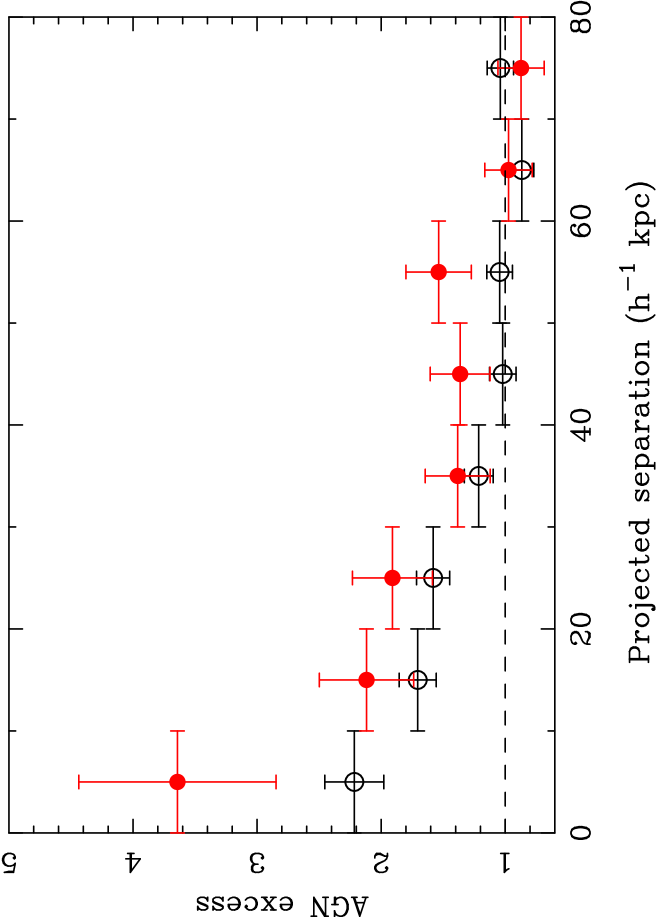
By splitting the sample by redshift at a value of 0.1, we show in Figure 3 the AGN excess in two redshift bins. The sample has a slightly higher AGN excess at all values of , but the significance is except at the smallest separations ( kpc). Any increase in AGN fraction in the higher redshift bin is unlikely to be due to the effect of covering fraction for two reasons. First, the AGN excess is relative to a mass- and redshift-matched control sample, so that we expect the covering fraction to be approximately the same between a given pair galaxy and its controls. Second, the higher covering fraction of high redshift galaxies should lead to a lower fractional contribution from AGN, rather than an enhanced AGN fraction. Although Figure 3 may therefore indicate some dependence of AGN fraction on redshift, the redshift interval probed by our sample is too narrow to allow a rigourous investigation of the redshift dependence of the merger-AGN connection.
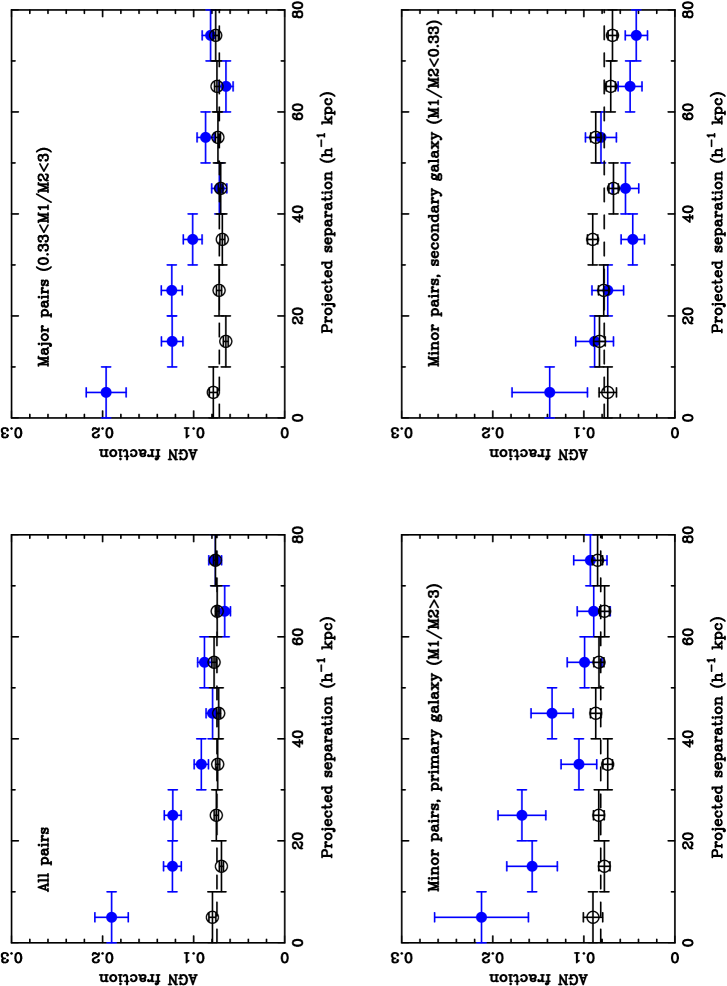
In Figure 4 we plot the AGN fraction of paired galaxies as a function of projected separation for different mass ratios. Once again, the AGN fractions of the control galaxies matched to the pairs in each bin of projected separation are shown for comparison. The major (equal mass) pairs show an enhancement that is very similar to the full sample. However, in minor (unequal mass) pairs, the more massive galaxies show a strong increase in the AGN fraction, whereas the signal is marginal in the less massive companion. This mass dependence is the inverse of what has been previously observed for triggered star formation in close pairs, where the primary galaxy shows no enhancement, but the secondary galaxy does (Woods & Geller 2007), as predicted by simulations (Cox et al. 2008). None the less, our AGN results agree with those of Woods & Geller (2007) who report a possible (1–2 ) increased AGN fraction for the primary galaxy in a minor merger. On the other hand, in a study of dual AGN, Liu et al. (2011b) find that both [OIII] luminosities and black hole accretion rates are higher in the less massive than the more massive component of a minor pair.
It is interesting to note that in the secondary galaxy of unequal mass pairs in our sample at projected separations kpc there is a hint that the AGN fraction may actually be lower than in the mass matched control. The lack of enhanced AGN fraction in the secondary galaxies is presumably not due to the lack of fuel being supplied to the galactic centre. Simulations predict significnt torques in the secondary galaxy (Cox et al. 2008) and SFRs are indeed observed to be elevated (Woods & Geller 2007). The relative trends of enhanced SFRs and AGN fractions in pairs of different mass ratios may therefore provide some clues to the timescales on which the two phases dominate.
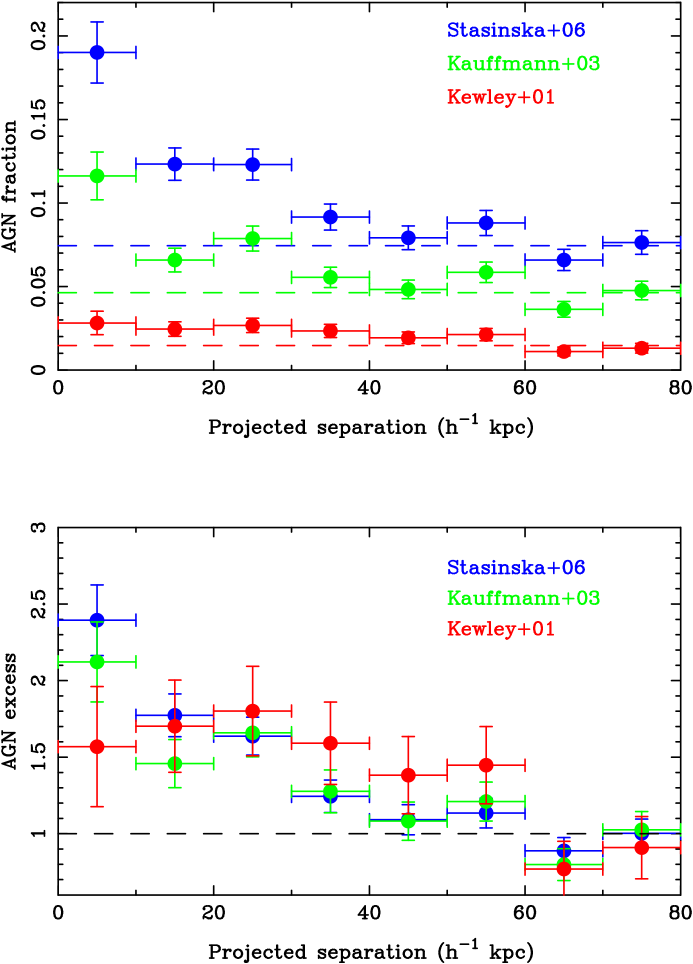
In Figure 5 we investigate how the choice of AGN diagnostic (K01, K03 or S06) influences the AGN fraction as a function of (this figure necessarily excludes QSOs which do not have BPT classifications). As expected, the overall AGN fractions increase from K01 to S06. The lower panel of Figure 5 shows the AGN excess relative to the control sample. Despite some small bin-to-bin differences, the overall trend for all three diagnostics is an increasing AGN fraction towards smaller projected separations with a typical over-abundance of AGN at kpc of a factor of about two.
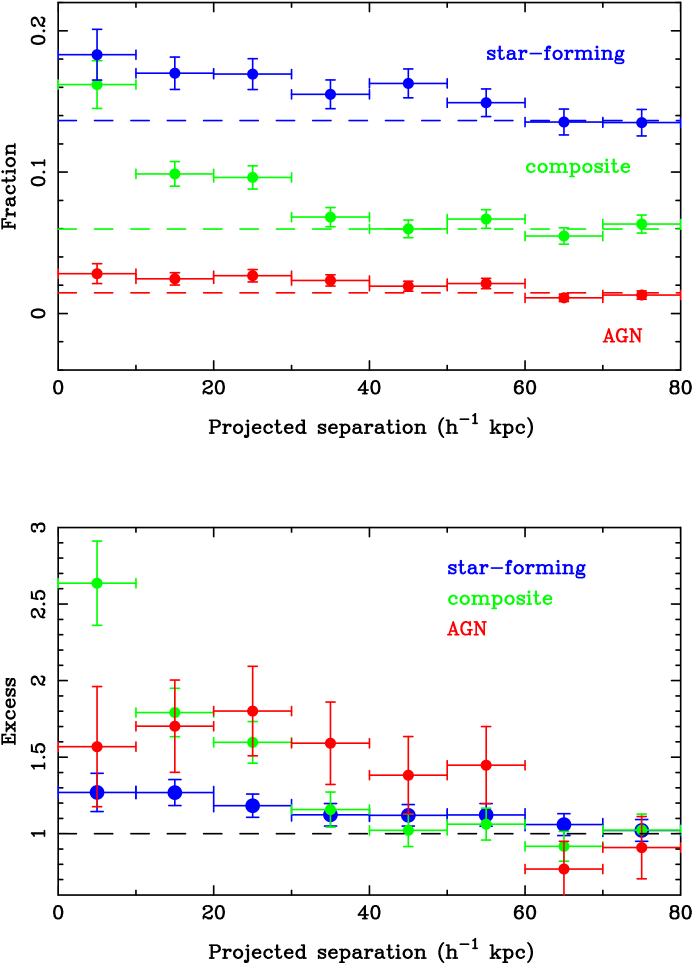
Due to the varying contributions of AGN permitted by the different diagnostics, the three classifications can be combined to classify three populations. ‘Pure’ AGN and ‘pure’ star-forming galaxies are based on the K01 and S06 demarcations. Emission line galaxies located between the K01 and S06 lines are considered to be ‘composite’ in nature. Figure 6 shows the fraction and excesses (relative to the control) of the pure AGN, pure star-forming and composite galaxies. All three categories show an excess at small separations, indicating that the overall emission line fraction is increasing in small separation pairs. Presumably the emission line population is being fed by relatively quiescent galaxies with sufficient residual gas that an interaction can spur them into (star formation or AGN) activity. Interestingly, although one of the best known properties of close galaxy pairs is their high star formation rates, the actual number of galaxies in the pure star-forming category shows the most modest enhancement, increasing by only 20%. The ‘pure’ AGN fraction increases by 50%, but the composite galaxies, which have significant contributions from both AGN and star formation show the largest excess at kpc, by a factor of 2.5. Large fractions of composite (also sometimes referred to as low luminosity AGN or transition objects) have been previously noted in pairs studies by Pastoriza, Donzelli & Bonatto (1999) and Focardi, Zitelli & Marinoni (2008).
5 Double AGN
In Figure 7 we investigate the fraction of close pairs in which both of the galaxies are classified as an AGN. In order to calculate the double AGN in a control sample, we make fake pairs by taking the best matched control galaxy of each galaxy in a pair. In Figure 7 we elect to use the S06 diagnostic, but the same qualitative trend is present for the other classifications. Whereas the overall S06 AGN fraction for galaxies in pairs (Figure 5) increases by a factor of 2.5, the fraction of pairs in which both galaxies are AGN is about 8 times higher than the control. The fraction of double AGN expected at random can be estimated from the square of the overall AGN fraction in a given bin and is shown with grey points in Figure 7. This simple comparison shows that the observed fraction of double AGN is higher than expected in the random case by a factor of about two and hints at simultaneous triggering in at least some of the interacting pairs. Liu et al. (2011b) have recently used correlated properties (such as stellar ages, 4000 Å break strength and H absorption equivalent width) to infer synchronous AGN triggering.
We test for correlated AGN activity within a given pair as a function of separation using a statistical approach. For a given fraction of AGN in a population, , the random (i.e. uncorrelated) fractions of pairs with zero, one or two AGN ( respectively) are:
| (4) |
| (5) |
| (6) |
We now assume that in a given sample with overall AGN (including QSOs) fraction , some fraction, , of the pairs have correlated emission line properties, i.e. the occurrence of an identical classification is not random but induced by the interaction. Therefore, the fraction of uncorrelated pairs is . In this scheme, the correlated pairs could either be both AGN or both star-forming. The fraction of uncorrelated pairs with zero, one or two AGN are then obtained by multiplying the random fractions in equations 4 – 6 by . The fraction of correlated pairs is simply multiplied by either the AGN fraction, (for AGN-AGN pairs) or the star-forming fraction (for SF-SF pairs). Table 1 summarizes the equations for correlated and uncorrelated fractions. Note that in pairs with one AGN only the uncorrelated case is applicable. Finally, the actual observed fraction of pairs with zero, one or two AGN will be the combination of the correlated and uncorrelated fractions (i.e. the sum of the two columns in Table 1):
| (7) |
| (8) |
| (9) |
The observed fractions of pairs with zero, one or two AGN ( respectively) and the observed total AGN fraction () in any given bin can therefore be combined with any of the equations 7 – 9 to determine . For example, from equation 9
| (10) |
| Correlated fraction | Uncorrelated fraction | |
|---|---|---|
| 0 AGN | ||
| 1 AGN | … | |
| 2 AGN |
The fraction of pairs with correlated AGN () is shown as a function of in the lower panel of Figure 7. The errors on are determined with jackknife re-sampling. In each bin is re-calculated after systematically removing the AGN pair in turn and calculating . For the pairs in each bin the error is then .
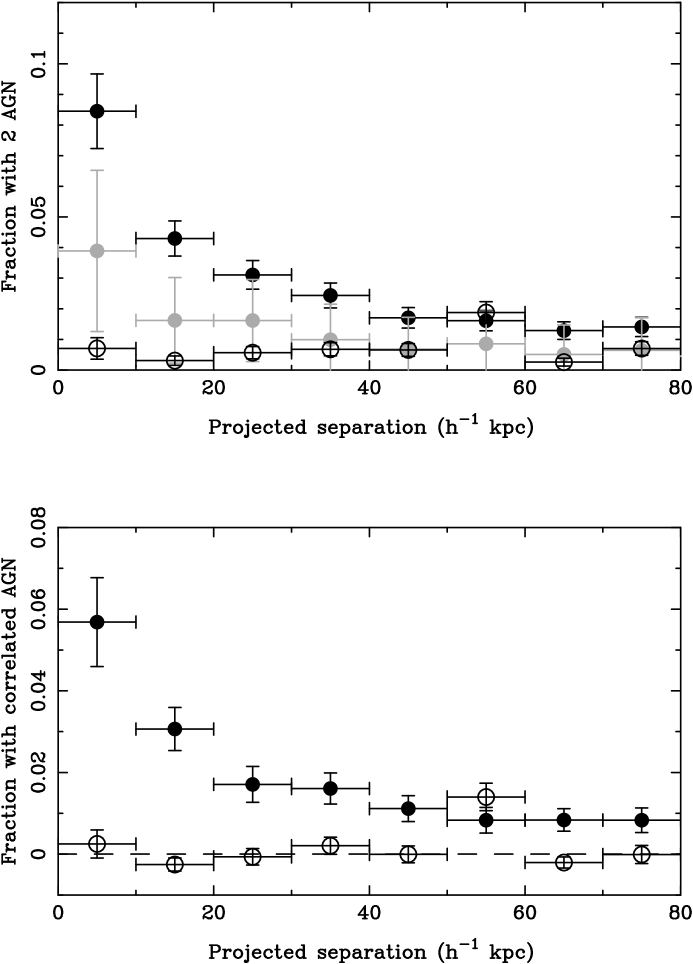
As expected, the correlated fraction of the control sample follows the zero line. For the pairs, there is an increase in the fraction of pairs with correlated double AGN as the projected separation decreases. Even pairs with separations of kpc exhibit a non-zero fraction of double AGN pairs that are correlated. The raw AGN fractions in Figure 2 show a strong excess of AGN only within 40 kpc, with a statistically less robust (1) enhancement out to 60 kpc. However, the sample is likely to become increasingly contaminated by interlopers (galaxies that are not truly interacting) at wider separations. An elevated (but decreasing) AGN fraction at wide separations may therefore become increasingly difficult to detect. The results from the double AGN indicate that the effect of the interaction on nuclear activity may actually be present out to 80 kpc and beyond. This would indicate that the AGN phase lasts for a significant fraction of the oribital time of the merger. Interestingly, Patton et al. (2011) find that the central galaxy colours of pairs remain bluer than their control sample out to similarly wide separations. The blue colours can be explained by elevated star formation rates in pairs with projected separations out to 80 kpc (Scudder et al. in preparation). It would be of great interest to extend star formation and AGN analyses to even wider separations.
6 Discussion
6.1 Comparison to previous work
As reviewed in the Introduction, there has been considerable disagreement in the literature regarding the connection between galaxy mergers and AGN activity. The two main techniques that have previously been used to tackle this connection are 1) through the imaging of AGN host galaxies (to search for morphological disturbances) and 2) the presence of AGN in merger candidates. The former technique has the obvious difficulty of imaging depth and the ability to detect morphological disturbances. These issues have been discussed in the literature and we refer the reader to the papers focused explicitly on this technique for more details (e.g. Ramos Almeida et al. 2011a,b). In this paper, we have taken the second approach: to quantify the AGN fraction in a sample of likely merger candidates. This technique also has its controversies. Even with large samples and carefully matched controls, a disagreement remains as to whether close pairs have a higher AGN fraction (Li et al. 2006, 2008; Alonso et al. 2007; Woods & Geller 2007; Ellison et al. 2008. Darg et al. 2009; Rogers et al. 2009).
Our results can be used to shed light on some of the reasons behind the discrepant results in the literature, as well as some of the selection effects which do not seem to play a major role. For example, the choice of mass ratio has a relatively minor effect on the detection of an enhanced AGN fraction. We find that restricting our analysis to approximately equal mass mergers produces quite similar results to the full 1:10 mass range (Figure 4). The result is also robust to the choice of relative velocity: strong enhancements in the AGN fraction are still seen at small separations even with a relatively relaxed threshold of km s-1. The choice of AGN diagnostic is also not a major factor; we see increasing AGN fractions at smaller projected separations for all three of the standard BPT diagnostics (Figure 5).
One selection criterion that does play a significant role is the S/N imposed on the detection of emission lines. The S/N5 cut used in our work is fairly typical of emission line studies wishing to accurately determine gas-phase metallicities (as reviewed by Kewley & Ellison 2008). However, the location of a galaxy on the BPT diagram may be less sensitive to S/N ratio. Moreover, some authors have argued that imposing S/N cuts biases the sample against low luminosity AGN which preferentially have LINER-like spectra (e.g. Woods & Geller 2007; Cid-Ferandes et al. 2010). We confirm this general trend by calculating the fraction of LINERs in the full SDSS sample as a function of S/N. Although LINERs lie in a slightly different part of the BPT diagram (e.g. Figure 3 of Cid-Fernandes et al. 2010) we classify them using the [OI] diagnostic of Kewley et al. (2006b). The LINER fraction rises from 4 per cent for a S/N 5 to 17 per cent for a S/N1. However, the fraction of AGN in the pairs sample is actually lower for lower S/N cuts. For example, at the closest separations ( kpc), the AGN excess is only 20 per cent for a cut of S/N. When the criterion is increased to S/N 8, the AGN excess is a factor of 3.5 (recall that for our fiducial S/N 5 cut the enhancement is a factor of 2.5). This trend of higher AGN fraction for more stringent S/N criteria indicates that AGN in the pairs sample are not dominated by objects with LINER-like spectra.
One important component of our analysis has been a careful treatment of selection effects. As discussed in Section 2, incompleteness at small separations in the SDSS leads to a biased distribution of masses as a function of projected separation. The AGN fraction is extremely sensitive to galactic stellar mass: for M M⊙ the fraction of emission line galaxies classified as AGN by S06 is 20%, rising to about 75% by M M⊙. There are similarly steep dependences of the AGN fraction when using the K01 and K03 diagnostics, although the overall fraction is lower than with S06. Therefore, even a 0.1 dex bias in mass can change the fraction of emission line galaxies classified as AGN by 10%. We have mitigated this effect through a cull of our wide pairs (to remove mass dependences on projected separation) and a careful matching of a control sample (to facilitate a relative comparison).
The enhanced AGN fraction at close separations is striking when displayed as a function of projected separation (Figure 2). The significance of our result would be diminished if we considered the AGN fraction of the pairs sample as a whole (i.e. not as a function of ) and compared it to the control. Our work has therefore benefitted from a large sample where previous works have calculated AGN fractions for pairs and controls in a wholesale way (e.g. Alonso et al. 2007; Woods & Geller 2007; Ellison et al. 2008). It is also worth noting that our pairs sample differs from these previous works, in that it includes galaxies without strong emission lines. The AGN fractions quoted here are fractions of all galaxies, not fractions of emission line galaxies that are classified as AGN. Repeating our analysis for an emission line only sample shows a much more modest increase in the AGN fraction at small separations, by only about 20% (using the S06 diagnostic). As demonstrated by Figure 6, the overall fraction of galaxies with emission lines (star-forming, composite and AGN) increases in pairs with smaller projected separations. Calculating AGN fractions for a complete galaxy sample therefore accounts for the migration of quiescent galaxies into the emission line regime. Our technique therefore tracks a single sample of galaxies and their changing emission line properties. For an emission line only sample, a changing AGN fraction as a function of is then a combination of the changing size emission line sample, plus the changing fraction of AGN.
6.2 Multiple AGN channels?
The arguments above help to reconcile the disparate results in the AGN fraction of close pairs by demonstrating some of the selection effects that can lead to different AGN fractions. However, our conclusion that mergers can lead to AGN should be distinguished from whether all AGN are the result of mergers. In theory, any process that can funnel gas to the centre of a galaxy may be expected to increase the accretion rate of the black hole and lead to an AGN. Indeed, there is an observational link between enhanced central star formation rates and black hole activity that extends beyond mergers to the general galaxy population (Cid-Fernandes et al. 2001; Kauffmann et al. 2003a; Silverman et al. 2009; Reichard et al. 2009). Other evidence has led to claims that mergers are indeed unlikely to be the sole AGN trigger (e.g. Li et al. 2006; Lutz et al. 2010; Mullaney et al. 2011), which may play a role in explaining why many imaging surveys of AGN hosts detect no signs of (an excess of) recent merger activity (e.g. Grogin et al. 2005; Gabor et al. 2009; Cisternas et al 2011; Kocevski et al. 2011). Two channels for AGN activity are often recognised in simulations, the violent, merger-induced ‘quasar-mode’ and the more gentle ‘maintenance-mode’ (e.g. Di Matteo et al. 2005; Hopkins & Hernquist 2006; Hopkins et al. 2008). There is general observational support for the association of quasars and radio galaxies with mergers (e.g. Canalizo & Stockton 2001; Ramos Almeida et al. 2011a,b and references therein) when suitable control samples are used. However, the work presented here is perhaps more surprising (and challenges the simple two channel model described above) in that we find an excess of relatively low luminosity (mostly Seyfert-like) AGN in interacting pairs.
If there are multiple pathways to creating an AGN, we should distinguish between asking ‘what fraction of close pairs have AGN?’ (the question addressed in the main body of this paper) and ‘what fraction of AGN are associated with mergers?’. The latter question epitomizes the approach of most imaging surveys that have not found a significant difference between the disturbed, or close pair, fractions in AGN and non-AGN samples. We can also ask this second question of our SDSS sample. The same AGN classification criteria described in Section 3 are applied to the complete SDSS main galaxy catalogue. Of the 43,436 galaxies that are classified as AGN, 0.0300.001 have a close companion within 200 km s-1 and 30 kpc. We also define a sample of 43,436 non-AGN galaxies; the best simultaneous match in stellar mass and redshift to each of the AGN galaxies. The fraction of non-AGN with a close companion within 200 km s-1 and 30 kpc is 0.0200.001 (the error is based on simple poisson statistics)333The fraction of galaxies with a close companion in both the AGN and non-AGN samples is not accurate in the absolute sense, due to spectroscopic incompleteness and other selection biases. For this simple comparison, we have not attempted an accurate correction, but assume that both the AGN and non-AGN are affected identically and hence the fraction of AGN and non-AGN with a close companion can be compared in a relative sense.. Therefore, from our sample of pairs we can say that close interactions result in a higher AGN fraction and AGN in the full sample show an excess of close companions. This contrasts with the imaging studies (mostly at higher redshift) listed above which do not find an excess of mergers associated with X-ray selected AGN. However, even accounting for the spectroscopic incompleteness (Patton & Atfield 2008), it is clear that not all AGN in the SDSS sample have a close companion.
If mergers are not the dominant cause of AGN activity, then the next goal is to identify the main mechanism that leads to black hole accretion. Simulations provide some insight here, by investigating the relative efficiencies of direct ‘cold flow’ gas accretion and mergers (e.g. Hopkins & Hernquist 2006; Di Matteo et al. 2011). Indeed, Bournaud et al. (2011) argue that, at least at high redshift where galactic gas fractions are high due to inflows from cold streams, disk instabilities could lead to significant AGN fuelling. This argument is supported by the prevalence of clumpy disks in high redshift galaxies (Elmegreen et al. 2007). However, Wisnioski et al. (2011) do not find any AGN dominated disks in their small sample of clumpy disks. Alternatively, Ellison et al. (2011) have recently demonstrated that barred galaxies with log M M⊙ have SFRs that are enhanced at a similar level as close pairs. However, due to their relative ubiquity, the enhanced SFRs in barred galaxies contribute at least three times more to the central stellar mass build-up than mergers. We will investigate the AGN fractions in barred galaxies in a forthcoming paper (Nair et al. in preparation).
7 Conclusions
We have compiled a large (11,060) sample of close galaxy pairs, selected with careful attention to the photometry at small separations, emission line quality and biases due to small separation incompleteness. The AGN fraction of the pairs sample is compared to a mass- and redshift-matched control sample with 10 controls per pair galaxy.
The main conclusions of this paper are:
-
1.
The AGN fraction in close pairs of galaxies increases by a factor of up to 2.5 at projected separations kpc. Although the increase depends slightly on the choice of AGN diagnostic, elevated AGN fractions are found for closely separated pairs independent of the diagnostic choice.
-
2.
The excess of AGN is larger for more stringent S/N cuts, indicating that the AGN in pairs are not dominated by objects with LINER-like spectra.
-
3.
We discuss how AGN are likely to be triggered by multiple processes, of which mergers are just one channel. However, in contrast to models, our results show that mergers can result in an increase in relatively low luminosity AGN, as well as the powerful radio galaxies and quasars that have been investigated by other studies.
-
4.
The fraction of AGN in close pairs depends mildly on the ratio of stellar masses. The highest enhancements in AGN fraction are seen for the equal mass pairs. The lower mass galaxies in unequal mass pairs show relatively little enhancement AGN fraction.
-
5.
In addition to an increase in the ‘pure’ AGN fraction at decreasing projected separations, both the star-forming and composite fractions also increase. Increases in all three emission line classes indicates that some quiescent galaxies have been transformed during the interaction process.
-
6.
The fraction of pairs in which both galaxies are classified as AGN by the Stasinska et al. (2006) AGN diagnostic is a factor of up to 8 higher than a sample of ‘control pairs’. This exceeds the expected random fraction of double AGN in pairs by around a factor of two, indicative of correlated AGN triggering between the companions.
-
7.
The correlated double AGN fraction is investigated using a statistical approach and found to increase at small separations, but remains elevated out to 80 kpc. This is evidence that the AGN phenomenon may persist in relatively wide separation pairs.
The results of this paper are in clear support of interaction-driven AGN activity that occurs well before final galaxy-galaxy coalescence. Since the merger timescale may be as long as a gigayear (Kitzbichler & White 2008), this does not provide a strong constraint on a delay between triggered star formation and AGN activity. However, the shape of the double AGN fraction as a function of projected separation (Figure 7) is very similar to the colour offsets (Patton et al. 2011) and star formation rate enhancements (Scudder et al. in preparation) in our sample. Scudder et al. compare the observed star formation rates with simulations and demonstrate that they can be reproduced with a burst of star formation occurring after the first pericentric passage, followed by a more significant burst at final coalescence. The similarity between star formation and AGN enhancements as a function of projected separation may be indicative of a similar process for accretion onto the nucleus with a relatively small time lag. Delays of a few hundred million years (Wild et al. 2010; Hopkins 2011) between peaks in star formation and accretion rate correspond to changes in projected separation of order the bin width in our projected separation figures (depending on relative velocity and the orientation). Megayear delays are therefore relatively prompt compared with the resolution provided by the observations presented here. The high fraction of composite galaxies also demonstrates that the AGN and star formation processes are on-going concurrently, with no need to shut down the latter before the former begins (c.f. Li et al. 2008; Schawinski et al. 2009).
Acknowledgments
We are grateful to the MPA/JHU group for access to their data products and catalogues (maintained by Jarle Brinchmann at http://www.mpa-garching.mpg.de/SDSS/). SLE and DRP acknowledge the receipt of an NSERC Discovery grant which funded this research. Frederic Bournaud and Grazyna Stasinska provided insightful comments the manuscript.
Funding for the SDSS and SDSS-II has been provided by the Alfred P. Sloan Foundation, the Participating Institutions, the National Science Foundation, the U.S. Department of Energy, the National Aeronautics and Space Administration, the Japanese Monbukagakusho, the Max Planck Society, and the Higher Education Funding Council for England. The SDSS Web Site is http://www.sdss.org/.
The SDSS is managed by the Astrophysical Research Consortium for the Participating Institutions. The Participating Institutions are the American Museum of Natural History, Astrophysical Institute Potsdam, University of Basel, University of Cambridge, Case Western Reserve University, University of Chicago, Drexel University, Fermilab, the Institute for Advanced Study, the Japan Participation Group, Johns Hopkins University, the Joint Institute for Nuclear Astrophysics, the Kavli Institute for Particle Astrophysics and Cosmology, the Korean Scientist Group, the Chinese Academy of Sciences (LAMOST), Los Alamos National Laboratory, the Max-Planck-Institute for Astronomy (MPIA), the Max-Planck-Institute for Astrophysics (MPA), New Mexico State University, Ohio State University, University of Pittsburgh, University of Portsmouth, Princeton University, the United States Naval Observatory, and the University of Washington.
References
- Alonso et al. (2007) Alonso, M. S., Lambas, D. G., Tissera, P. B., Coldwell, G., 2007, MNRAS, 375, 1017
- Alonso et al. (2004) Alonso, M. S., Tissera, P. B., Coldwell, G., Lambas, D. G., 2004, MNRAS, 352, 1081
- Baldwin, Phillips & Terlevich (1981) Baldwin, J. A,; Phillips, M. M., Terlevich, R., 1981, PASP, 93, 5
- Barton, Geller & Kenyon (2000) Barton, E. J., Geller, M. J., & Kenyon, S. J., 2000, ApJ, 530, 660
- Best et al. (2005) Best, P. N., Kauffmann, G., Heckman, T. M., Brinchmann, J., Charlot, S., Ivezic, Z.,; White, S. D. M., 2005, MNRAS, 362, 25
- Bournaud et al. (2011) Bournaud, F., Dekel, A., Teyssier, R., Cacciato, M., Daddi, E., Juneau, S., Shankar, F., 2011, ApJL, submitted
- Bruzual & Charlot (2003) Bruzual, G., & Charlot, S., 2003, MNRAS, 344, 1000
- Bundy et al. (2008) Bundy, K., et al., 2008, ApJ, 681, 931
- Canalizo & Stockton (2001) Canalizo, G., & Stockton, A., 2001, ApJ, 555, 719
- Cattaneo et al. (2005) Cattaneo, A., Blaizot, J., Devriendt, J., Guiderdoni, B., 2005, MNRAS, 364, 407
- Chabrier (2003) Chabrier, 2003, ApJ, 586, L133
- Choi, Woo & Park (2009) Choi, Y.-Y. Woo, J.-H., Park, C., 2009, ApJ, 699, 1679
- Cid-Fernandes et al. (2001) Cid Fernandes, R., Heckman, T., Schmitt, H., Gonzalez Delgado, R. M., Storchi-Bergmann, T., 2001, ApJ, 558, 81
- Cid-Fernandes et al. (2010) Cid Fernandes, R., Stasinska, G., Schlickmann, M. S., Mateus, A., Vale Asari, N., Schoenell, W., Sodre, L., 2010, MNRAS, 403, 1036
- Cisternas et al. (2011) Cisternas, M., et al. 2011, ApJ, 726, 57
- Coldwell & Lambas (2006) Coldwell, G. V., & Lambas, D. G., 2006, MNRAS, 371, 786
- Combes et al. (2009) Combes, F., Baker, A. J., Schinnerer, E., Garcia-Burillo, S., Hunt, L. K., Boone, F., Eckart, A., Neri, R., Tacconi, L. J., 2009, A&A, 503, 73
- Cox et al. (2008) Cox, T. J., Jonsson, P., Somerville, R. S., Primack, J. R., Dekel, A., MNRAS, 2008, 384, 386
- Dahari (1984) Dahari, O., 1984, AJ, 89, 966
- Darg et al. (2010a) Darg, D. W., et al., 2010a, MNRAS, 401, 1552
- Di Matteo et al. (2011) Di Matteo, T., Khandai, N., DeGraf, C., Feng, Y., Croft, R., Lopez, J., Springel, V., 2011, ApJ, submitted
- Di Matteo et al. (2005) Di Matteo, T., Springel, V., Hernquist, L., 2005, Nature, 433, 604
- Dopita et al. (2000) Dopita, M. A., Kewley, L. J., Heisler, C. A., Sutherland, R. S., 2000, ApJ, 542, 224
- Dultzin et al. (2010) Dultzin, D., Krongold, Y., Gonzalez, J. J., Hernandez-Toledo, H., 2010, ASPC, 421, 115
- Dunlop et al. (2003) Dunlop, J., McClure R., Kukula, M., Baum, S., O’Dea, C., Hughes, D., 2003, MNRAS, 340, 1095
- Ellison et al. (2011) Ellison, S. L., Nair, P., Patton, D. R., Scudder, J. M., Mendel, J. T., Simard, L., 2011, MNRAS, in press
- Ellison et al. (2008) Ellison, S. L., Patton, D. R., Simard, L., McConnachie, A. W., 2008 AJ, 135, 1877
- Ellison et al. (2010) Ellison, S. L., Patton, D. R., Simard, L., McConnachie, A. W., Baldry, I. K., Mendel, J. T., 2010, MNRAS 407, 1514.
- Elmegreen et al. (2007) Elmegreen, D. M., Elmegreen, B. G., Ravindranath, S., Coe, D. A., 2007, ApJ, 658, 763
- Ferrarese & Merritt (2000) Ferrarese, L., & Merritt, D., 2000, ApJ, 539, L9
- Focardi, Zitelli & Marinoni (2008) Focardi, P., Zitelli, V., & Marinoni, S., 2008, A&A, 484, 655
- Gabor et al. (2009) Gabor, J. M., et al., 2009, ApJ, 691, 705
- Gebhardt et al. (2000) Gebhardt, K., et al. 2000, ApJ, 539, L13
- Grogin et al. (2005) Grogin, N. A., 2005, ApJ, 627, L97
- Groves et al. (2006) Groves, B. A., Heckman, T. M., Kauffmann, G., 2006, MNRAS, 371, 1559
- Haan et al. (2009) Haan, S., Schinnerer, E., Emsellem, E., Garcia-Burillo, S., Combes, F., Mundell, C. G., Rix, H.-W., 2009, ApJ, 692, 1623
- Haan et al. (2008) Haan, S., Schinnerer, E., Mundell, C. G., Garcia-Burillo, S., Combes, F., 2008, AJ, 135, 232
- Haehnelt, Natarajan & Rees (1998) Haehnelt, M. G., Natarajan, P., & Rees, M. J., 1998, MNRAS, 300, 817
- Heckman (1980) Heckman, T., 1980, A&A, 87, 152
- Ho, Filippenko & Sargent (1993) Ho, L. C., Filippenko, A. V., & Sargent, W. L. W., 1993, ApJ, 417, 63
- Hopkins (2011) Hopkins, P. F., 2011, MNRAS, submitted
- Hopkins & Hernquist (2006) Hopkins, P. F., & Hernquist, L., 2006, ApJS, 166, 1
- Hopkins et al. (2008) Hopkins, P. F., Hernquist, L., Cox, T. J., Keres, D., 2008, ApJS, 175, 356
- Jahnke et al. (2004) Jahnke, K., Kuhlbrodt, B., Wisotzki, L., 2004, MNRAS, 352, 399
- Kauffmann et al. (2003a) Kauffmann, G., et al., 2003a, MNRAS, 346, 1055
- Kauffmann et al. (2003b) Kauffmann, G., et al., 2003b, MNRAS, 341, 33
- Kauffmann & Haehnelt (2000) Kauffmann, G., & Haehnelt, M., 2000, MNRAS, 311, 576
- Kaviraj et al. (2011) Kaviraj, S., Schawinski, K., Silk, J., Shabala, S. S., 2011, MNRAS, in press
- Keel et al. (1985) Keel, W. C., Kennicutt, R. C., Jr., Hummel, E., van der Hulst, J. M., 1985, AJ, 90, 708
- Kennicutt et al. (1987) Kennicutt, R. C., Jr., Roettiger, K. A., Keel, W. C., van der Hulst, J. M., Hummel, E., 1987, AJ, 93, 1011
- Kewley et al (2001) Kewley, L. J., Heisler, C. A., Dopita, M. A., Lumsden, S., 2001, ApJS, 132, 37
- Kewley et al. (2006a) Kewley, L. J., Geller, M. J., Barton, E. J., 2006a, AJ, 131, 2004
- Kewley et al. (2006b) Kewley, L. J., Groves, B., Kauffmann, G., Heckman, T., 2006b, MNRAS, 372, 961
- Kewley et al (2010) Kewley, L. J., Rupke, D., Jabran Z. H., Geller, M. J., Barton, E. J., 2010, ApJ, 721, L48
- Kitzbichler & White (2008) Kitzbichler, M. G., & White, S. D. M., 2008, MNRAS, 391, 1489
- Kocevski et al. (2011) Kocevski, D., et al. 2011, ApJ, submitted
- Koss et al. (2010) Koss, M., Mushotzky, R., Veilleux, S., Winter, L., 2010, ApJ, 716, L125
- Lambas et al. (2003) Lambas, D. G., Tissera, P. B., Alonso, M. S., Coldwell, G., 2003, MNRAS, 346, 1189
- Li et al. (2008b) Li, C., Kauffmann, G., Heckman, T. M., White, S. D. M., Jing, Y. P., 2008, MNRAS, 385, 1915
- Li et al. (2006) Li, C., Kauffmann, G., Wang, L., White, S. D. M., Heckman, T. M., Jing, Y. P., 2006, MNRAS, 373, 457
- (61) Liu, X., Shen, Y., Strauss, M. A., Hao, L., 2011a, ApJ, submitted
- (62) Liu, X., Shen, Y., Strauss, M. A., 2011b, ApJ, submitted
- Lutz et al (2010) Lutz, D., et al. 2010, ApJ, 712, 1287
- Magorrian et al. (1998) Magorrian, J., et al., 1998, AJ, 115, 2285
- McGurk et al. (2011) McGurk, R. C., Max, C. E., Rosario, D. J., Shields, G. A., Smith, K. L., Wright, S. A., 2011, ApJL, submitted
- Michel-Dansac et al. (2008) Michel-Dansac, L., Lambas, D. G., Alonso, M. S., Tissera, P., 2008, MNRAS, 386, 82
- Mendez et al. (2011) Mendez, A. J., Coil, A. L., Lotz, J., Salim, S., Moustakas, J., Simard, L., 2011, ApJ aubmitted
- Mullaney et al. (2011) Mullaney, J. R., et al., 2011, MNRAS, submitted
- Nikolic, Cullen & Alexander (2004) Nikolic, B., Cullen, H., Alexander, P., 2004, MNRAS, 355, 874
- Pastoriza, Donzelli & Bonatto (1999) Pastoriza, M. G., Donzelli, C. J., & Bonatto, C., 1999, A&A, 1999, 347, 55
- Patton & Atfield (2008) Patton, D. R., & Atfield, J. E., 2008, ApJ, 685, 235
- Patton et al. (2011) Patton, D. R., Ellison, S. L., Simard, L., McConnachie, A. W., Mendel, J. T., 2011, MNRAS, 412, 591
- Pei (1992) Pei, Y., 1992, ApJ, 395, 130
- Rafanelli et al. (1995) Rafanelli, P., Violato, M., Baruffolo, A., 1995, AJ, 109, 1546
- Ramos Almeida et al. (2011b) Ramos Almeida, C., Tadhunter, C. N., Inskip, K. J., Morganti, R., Holt, J.; Dicken, D., 2011b, MNRAS, 410, 1550
- Ramos Almeida et al. (2011a) Ramos Almeida, C., Bessiere, P. S., Tadhunter, C. N., Perez-Gaonzalez, P. G., Barro, G., Inskip, K. J., Morganti, R., Holt, J.; Dicken, D., 2011a, MNRAS, submitted
- Reichard et al. (2009) Reichard, T. A., Heckman, T. M., Rudnick, G., Brinchmann, J., Kauffmann, G., Wild, V., 2009, ApJ, 691, 1005
- Rich et al. (2010) Rich, J. A., Dopita, M. A., Kewley, L. J., Rupke, D. S. N., 2010, ApJ, 721, 505
- Rich et al. (2011) Rich, J. A., Kewley, L. J., Dopita, M. A., 2011, ApJ, accepted
- Richstone et al. (1998) Richstone et al. 1998, Nature, 395, 14
- Rogers et al. (2009) Rogers, B., Ferreras, I., Kaviraj, S., Pasquali, A., Sarzi, M., 2009, MNRAS, 399, 2172
- Rupke, Kewley & Chien (2010) Rupke, D. S. N., Kewley, L. J., Chien, L.-H. 2010, 723, 1255
- Rupke, Veilleux & Baker (2008) Rupke, D. S. N., Veilleux, S., & Baker, A. J., 2008, ApJ, 674, 172
- Salim et al. (2007) Salim, S., et al, 2007, ApJS, 173, 267
- Sanchez & Gonzalez-Serrano (2003) Sanchez, S., Gonzalez-Serrano, J., 2003, A&A, 406, 435
- Schawinski et al. (2007) Schawinski, K., Thomas, D., Sarzi, M., Maraston, C., Kaviraj, S., Joo, S.-J., Yi, S. K., Silk, J., 2007, MNRAS, 382, 1415
- Schawinski et al. (2009) Schawinski, K., Virani, S., Simmons, B., Urry, C. M., Treister, E., Kaviraj, S., Kushkuley, B., 2009, ApJ, 692, L19
- Schmitt (2001) Schmitt, H. R., 2001, AJ, 122, 2243
- Silverman et al. (2009) Silverman, J. D., et al., 2009, ApJ, 695, 171
- Simard et al. (2011) Simard, L., Mendel, J. T., Patton, D. R., Ellison S. L., McConnachie, A. W., 2011, ApJS, in press
- Smirnova et al. (2006) Smirnova, A. A., Moiseev, A. V., Afanasiev, V. L., 2006, AstL, 32, 520
- Springel, Di Matteo & Hernquist (2005) Springel, V., Di Matteo, T., Hernquist, L., 2005, MNRAS, 361, 776
- Stasinska et al. (2006) Stasinska, G., Cid Fernandes, R., Mateus, A., Sodre, L., Asari, N. V., 2006, MNRAS, 371, 972
- Storchi-Bergmann et al. (2001) Storchi-Bergmann, T., Gonzalez-Delgado, R. M., Schmitt, H. R., Cid-Fernandes, R., Heckman, T., 2001, ApJ, 559, 147
- Surace et al. (1998) Surace, J. A., Sanders, D. B., Vacca, W. D., Veilleux, S., Mazzarella, J. M., 1998, ApJ, 492, 116
- van de Voort et al. (2011) van de Voort, F., Schaye, J., Booth, C. M., Dalla Vecchia, C., 2011, MNRAS, submitted
- Veilleux & Osterbrock (1987) Veilleux, S., Osterbrock, D. E., 1987, ApJS, 63, 295
- Villar-Martin et al. (2011) Villar-Martin, M., Tadhunter, C., Humphrey, A., Fraga-Encinas, R., Gonzalez Delgado, R., Perez-Torres, M., Martinez-Sansigre, A., 2011, MNRAS, in press
- Villar-Martin et al. (2010) Villar-Martin, M., Tadhunter, C., Perez, E., Humphrey, A., Martinez-Sansigre, A., Gonzalez Delgado, R., Perez Torres, M., 2010, MNRAS, 407, L6
- Wild, Heckman & Charlot (2010) Wild, V., Heckman, T., Charlot, S., 2010, MNRAS, 405, 933
- Wild et al (2007) Wild, V., Kauffmann, G., Heckman, T., Charlot, S., Lemson, G., Brinchmann, J., Reichard, T., Pasquali, A., 2007, MNRAS, 381, 543
- Wisnioski et al. (2011) Wisnioski, E., et al., 2011, MNRAS in press
- Woods & Geller (2007) Woods, D. F., Geller, M. J., 2007, AJ, 134, 527
- Woods et al. (2006) Woods, D. F., Geller, M. J., Barton, E. J., 2006, AJ, 132, 197