VLT/X-shooter observations of the low-metallicity blue compact dwarf galaxy PHL 293B including a luminous blue variable star††thanks: Based on observations collected at the European Southern Observatory, Chile, ESO program 60.A-9442(A).††thanks: The reduced data in Figures 1 and 2 are available at the CDS via anonymous ftp to cdsarc.u-strasbg.fr (130.79.128.5) or via http://cdsweb.u-strasbg.fr/viz-bin/qcat?J/A+A/533/A25
Abstract
Context. We present VLT/X-shooter spectroscopic observations in the wavelength range 3000 – 23000Å of the extremely metal-deficient blue compact dwarf (BCD) galaxy PHL 293B containing a luminous blue variable (LBV) star and compare them with previous data.
Aims. This BCD is one of the two lowest-metallicity galaxies where LBV stars were detected, allowing us to study the LBV phenomenon in the extremely low metallicity regime.
Methods. We determine abundances of nitrogen, oxygen, neon, sulfur, argon, and iron by analyzing the fluxes of narrow components of the emission lines using empirical methods and study the properties of the LBV from the fluxes and widths of broad emission lines.
Results. We derive an interstellar oxygen abundance of 12+log O/H = 7.71 0.02, which is in agreement with previous determinations. The observed fluxes of narrow Balmer, Paschen and Brackett hydrogen lines correspond to the theoretical recombination values after correction for extinction with a single value (H) = 0.225. This implies that the star-forming region observed in the optical range is the only source of ionisation and there is no additional source of ionisation that is seen in the NIR range but is hidden in the optical range. We detect three = 1-0 vibrational lines of molecular hydrogen. Their flux ratios and non-detection of = 2-1 and 3-1 emission lines suggest that collisional excitation is the main source producing H2 lines. For the LBV star in PHL 293B we find broad emission with P Cygni profiles in several Balmer hydrogen emission lines and for the first time in several Paschen hydrogen lines and in several He i emission lines, implying temporal evolution of the LBV on a time scale of 8 years. The H luminosity of the LBV star is by one order of magnitude higher than the one obtained for the LBV star in NGC 2363Mrk 71 which has a slightly higher metallicity 12+logO/H = 7.87. The terminal velocity of the stellar wind in the low-metallicity LBV of PHL293B is high, 800 km s-1, and is comparable to that seen in spectra of some extragalactic LBVs during outbursts. We find that the averaged terminal velocities derived from the Paschen and He i emission lines are by some 40 – 60 km s-1 lower than those derived from the Balmer emission lines. This probably indicates the presence of the wind accelerating outward.
Key Words.:
galaxies: fundamental parameters – galaxies: starburst – galaxies: ISM – galaxies: abundances – stars: activity1 Introduction
Critical evolutionary phases in the life of massive stars such as the stage of luminous blue variables (LBVs; Conti, 1984) are hard to study due to the exceedingly short time scales involved. To enhance the chance of catching the LBV phenomenon, it is best to observe galaxies known to contain many massive stars. Blue compact dwarf (BCD) galaxies are suitable objects for such studies as their star-forming regions can harbor up to thousands of massive stars (e.g., Thuan & Izotov, 2005). As the mass loss rate depends on the metallicity, BCDs of varying metal deficiency are excellent laboratories to test metallicity effects on mass loss (Izotov et al., 2007).
The prevailing belief is that the efficiencies of stellar winds in massive stars are significantly reduced at low metallicities. However, there is growing evidence suggesting that massive stars do have stellar winds, even in the most metal-deficient BCDs known, with interstellar oxygen abundances 12 + log O/H 7.6. Izotov et al. (1997) and Legrand et al. (1997) discovered a Wolf-Rayet (WR) stellar population in I Zw 18 with an oxygen abundance 12+log O/H = 7.17 0.01 (Izotov et al., 1999). Furthermore, Thuan & Izotov (1997) have observed stellar P Cygni profiles for the Si iv 1394, 1403 absorption lines in the spectrum of the emission-line galaxy SBS 0335–052E with an interstellar oxygen abundance of 12 + log O/H = 7.30 0.01 (Izotov et al., 2007).
Although we do not know the metallicities of these stars, it appears that they were formed in the interstellar medium with an extremely low metallicity and do possess stellar winds. The properties of these stellar winds may significantly differ from those of their high-metallicity counterparts (e.g., Guseva et al., 2000; Crowther & Hadfield, 2006).
To find more objects with observational signatures of massive star outflows, Izotov et al. (2007) have assembled a sample of about 40 emission-line dwarf galaxies which exhibit broad components in their strong emission lines, mainly in H, [O iii] 4959, 5007, and H. Except for four objects which appear to contain massive black holes (Izotov & Thuan, 2008), the broad emission of all the other objects can be attributed to some evolutionary stage of massive stars and to their interaction with the circumstellar and interstellar medium, e.g. WR stars, supernovae, superbubbles or LBV stars. The attention of Izotov et al. (2007) was drawn to the spectrum of the BCD PHL 293B SDSS J2230–0006, with 12 + log O/H = 7.72, which shows broad Balmer hydrogen emission lines with P Cygni profiles, that are characteristic of a LBV star. Several months after this finding, Pustilnik et al. (2008) discovered another bright LBV in the BCD DDO 68 with interstellar 12 + log O/H = 7.14. The study of these newly discovered LBV stars was the focus of the paper by Izotov & Thuan (2009).
The LBV phase represents a transition in the late evolution of all stars with initial masses greater than about 50 from the stage of O stars burning hydrogen on the main-sequence to that of core-helium burning WR stars. During this phase, the stars lose large amounts of mass in recurrent explosive events. In the HR diagram, LBVs lie just to the left of the Humphreys-Davidson limit (Humphreys & Davidson, 1994), beyond which no stars are observed. They define the locus of an instability that prevents further redward evolution, e.g. the “strange mode instability” (Kiriakidis et al., 1993).
The exact mechanism giving rise to a LBV outburst is still unknown (e.g., Maeder & Meynet, 2000; Massey, 2003), even though many LBVs at solar metallicity have been studied (e.g. Clark et al., 2005). The situation is worse at low metallicity. Smith et al. (2011) noted that LBVs are often detected in spiral galaxies but rarely in dwarf galaxies and the metallicities of most of these dwarf galaxies are still unknown. Exceptions are the Small Magellanic Cloud with 12+log O/H 8.0 and the dwarf cometary galaxy NGC 2366 with 12+log O/H = 7.87. In the latter galaxy, the LBV star has been investigated in detail (Drissen et al., 1997, 2001; Petit et al., 2006). Repeating high-quality spectroscopic observations of LBV stars in more extremely metal-deficient galaxies should help to better understand how the LBV phase depends on metallicity.
We present here new VLT/X-shooter spectroscopic observations of PHL 293B over a larger wavelength range of 3000-23000Å as compared to the SDSS ( 3800-9200Å) and VLT/UVES ( 3000-7000Å) optical data discussed by Izotov & Thuan (2009). These new observations allow us to derive element abundances in the H ii region, to study whether any hidden star formation is present in this galaxy, and to obtain emission line parameters of the LBV star for the epoch 8 years after previous observations. The new observations are described in Sect. 2. In Sect. 3 we discuss the properties of the host galaxy. We derive the element abundances, discuss extinction and hidden star formation and excitation mechanisms of the H2 emission in the NIR range. The properties of the LBV broad emission are analysed in Sect. 4. Our conclusions are summarised in Sect. 5.


2 Observations and data reduction
A new spectrum of PHL 293B was obtained using the 8.2 m Very Large Telescope (VLT) on 2009 August 16 [ESO program 60.A-9442(A)]. The observations were performed at an airmass 1.4 using the three-arm echelle X-shooter spectrograph mounted at the UT2 Cassegrain focus. In the UVB arm with wavelength range 3000 – 5595Å, four equal exposures of 900s with a 1″11″ slit were obtained resulting in a total exposure time of 3600s. The angular scale of 1″ at a distance of 22.7 Mpc to PHL 293B taken from the NASA/IPAC Extragalactic Database (NED)111NASA/IPAC Extragalactic Database (NED) is operated by the Jet Propulsion Laboratory, California Institute of Technology, under contract with the National Aeronautics and Space Administration. corresponds to a linear scale of 110 pc. The distance of PHL 293B has been obtained from the radial velocity corrected for Virgo Infall with a Hubble constant of 73 km s-1 Mpc-1. Nodding along the slit was performed according to the scheme ABBA with the object positions A or B differing by 5″ along the slit. In the VIS arm with wavelength range 5595 – 10240Å, eight equal exposures of 450s with a 0911″ slit were obtained requiring a total exposure time of 3600s. Nodding along the slit was performed according to the scheme AABBBBAA. In the NIR arm with wavelength range 10240 – 24800Å, twelve equal exposures of 60s with a 0911″ slit were obtained resulting in a total exposure time of 720s. Nodding along the slit was performed according to the scheme AAABBBBBBAAA. The above instrumental set-up resulted in resolving powers / of 5100, 8800 and 5100 for the UVB, VIS and NIR arms, respectively. The seeing was 1″.
The Kitt Peak IRS spectrophotometric standard star Feige 110 was observed on 2009 August 15 with a slit of 5″11″ for flux calibration and several bright stars with the same slits as those used for PHL 293B were observed on 2009 August 15 to correct for telluric absorption. We use the spectrum of Feige 110 for the flux calibration of the spectra obtained with the UVB and VIS arms. Since this star was observed with a wide slit, no light losses need to be taken into account for the flux calibration. As for the NIR arm, we use the spectrum of one of the telluric stars, Hip 15378, of spectral type A0V with a magnitude of 7.86 mag, to perform the flux calibration. Since there is no available absolute spectral distribution for that star, we adopted the spectral energy distribution of another A0V star, Vega, with a magnitude of 0.0 mag and scaled it to the magnitude of Hip 15378. Spectra of thorium-argon (Th-Ar) comparison arcs were obtained and used for wavelength calibration of the UVB and VIS arm observations. For the wavelength calibration of the NIR spectrum we use night sky emission lines.
The two-dimensional UVB and VIS spectra were bias subtracted and flat-field corrected using IRAF222IRAF is the Image Reduction and Analysis Facility distributed by the National Optical Astronomy Observatory, which is operated by the Association of Universities for Research in Astronomy (AURA) under cooperative agreement with the National Science Foundation (NSF).. The two-dimensional NIR spectra were corrected for a dark current and divided by the flat frames to correct for the pixel sensitivity variations. Cosmic ray hits of all UVB, VIS and NIR spectra were removed using routine CRMEDIAN. The remaining hits were later removed manually after background subtraction. For each of the UVB, VIS and NIR arms we separately coadded spectra with the object at the position A and spectra with the object at the position B. Then, the coadded spectrum at the position B was subtracted from the coadded spectrum at the position A. This resulted in a frame with subtracted background. We used the IRAF software routines IDENTIFY, REIDENTIFY, FITCOORD, and TRANSFORM to perform wavelength calibration and correct for distortion and tilt of each frame. The one-dimensional wavelength-calibrated spectra were then extracted from the two-dimensional frames using the APALL routine. We adopted extraction apertures of 1″25, 0925 and 0925 for the UVB, VIS and NIR spectra, respectively.
The resulting flux-calibrated and redshift-corrected UVB and VIS spectra of PHL 293B are shown in Fig. 1 and the resulting flux-calibrated and redshift-corrected NIR spectrum is shown in Fig. 2. Despite the fact that UVB and VIS spectra, on the one hand, and the NIR spectrum, on the other hand, were flux-calibrated with the use of two different stars observed with different apertures, the levels of the continuum at 10000Å in the VIS and NIR spectra agree to better than 10%. Therefore, no adjustment of the VIS and NIR spectra was applied. Strong broad hydrogen emission lines with P Cygni profiles are present in the UVB and VIS spectra, similar to the ones seen in the UVES spectrum (Izotov & Thuan, 2009). Two hydrogen lines in the NIR spectrum (Fig. 2), Pa and Pa, also show the broad components.
| Line | 100()/(H)a | 100()/(H)b | Line | 100()/(H)a | 100()/(H)b |
|---|---|---|---|---|---|
| 3188 He i | 2.980.22 | 3.730.35 | 6717 [S ii] | 5.280.08 | 4.450.28 |
| 3683 H20 | 0.550.04 | 2.390.28 | 6731 [S ii] | 3.960.07 | 3.330.24 |
| 3687 H19 | 0.470.04 | 2.290.30 | 7065 He i | 2.660.05 | 2.180.19 |
| 3692 H18 | 1.020.04 | 2.920.28 | 7136 [Ar iii] | 4.750.07 | 3.890.26 |
| 3697 H17 | 0.980.04 | 2.900.27 | 7281 He i | 0.660.02 | 0.540.10 |
| 3704 H16 | 0.950.05 | 2.900.28 | 7320 [O ii] | 1.070.03 | 0.870.12 |
| 3705 He i | 0.520.05 | 0.610.12 | 7330 [O ii] | 1.040.03 | 0.840.12 |
| 3712 H15 | 1.210.04 | 2.900.27 | 7751 [Ar iii] | 1.420.03 | 1.110.14 |
| 3722 H14 | 2.570.06 | 4.560.34 | 8392 Pa20 | 0.350.02 | 0.570.10 |
| 3726 [O ii] | 18.420.27 | 21.430.74 | 8413 Pa19 | 0.320.02 | 0.530.09 |
| 3729 [O ii] | 25.560.38 | 29.730.88 | 8438 Pa18 | 0.400.02 | 0.600.10 |
| 3734 H13 | 2.020.06 | 3.970.31 | 8446 O i | 0.130.01 | 0.100.04 |
| 3750 H12 | 2.180.05 | 4.230.32 | 8470 Pa17 | 0.450.02 | 0.650.10 |
| 3770 H11 | 2.920.06 | 4.950.35 | 8505 Pa16 | 0.640.02 | 0.760.11 |
| 3797 H10 | 4.080.09 | 6.390.40 | 8548 Pa15 | 0.650.02 | 0.770.11 |
| 3820 He i | 0.880.07 | 1.020.16 | 8601 Pa14 | 0.900.03 | 0.950.12 |
| 3835 H9 | 5.910.11 | 8.410.45 | 8667 Pa13 | 0.970.02 | 0.990.13 |
| 3868 [Ne iii] | 37.690.55 | 43.181.08 | 8753 Pa12 | 1.280.04 | 1.230.14 |
| 3889 He i+H8 | 17.350.26 | 21.590.74 | 8865 Pa11 | 1.710.04 | 1.540.16 |
| 3964 He i | 0.550.05 | 0.630.12 | 9017 Pa10 | 2.020.04 | 1.730.16 |
| 3967 [Ne iii] | 11.340.17 | 12.830.56 | 9069 [S iii] | 10.700.16 | 8.050.36 |
| 3970 H7 | 12.830.20 | 16.140.63 | 9232 Pa9 | 2.750.06 | 2.250.19 |
| 4026 He i | 1.520.06 | 1.710.20 | 9532 [S iii]c | 16.670.24 | 12.250.46 |
| 4068 [S ii] | 0.540.04 | 0.610.12 | 9549 Pa | 3.940.06 | 3.090.22 |
| 4076 [S ii] | 0.160.03 | 0.180.07 | 10052 Pa | 5.020.13 | 3.780.24 |
| 4101 H | 22.850.33 | 26.840.81 | 10052 Pa(NIR) | 5.750.53 | 4.400.43 |
| 4340 H | 42.910.62 | 47.391.09 | 10829 He i | 27.380.49 | 18.960.60 |
| 4363 [O iii] | 12.360.18 | 13.190.55 | 10941 Pa | 10.020.26 | 7.110.34 |
| 4388 He i | 0.450.03 | 0.480.10 | 12821 Pa | 22.320.46 | 15.070.53 |
| 4471 He i | 3.290.07 | 3.450.28 | 15884 Br14 | 0.490.08 | 0.380.08 |
| 4658 [Fe iii] | 0.260.03 | 0.260.08 | 16114 Br13 | 1.040.11 | 0.740.11 |
| 4686 He ii | 1.720.04 | 1.750.19 | 16412 Br12 | 0.830.09 | 0.600.10 |
| 4711 [Ar iv] | 1.610.04 | 1.630.19 | 16811 Br11 | 0.990.07 | 0.700.10 |
| 4713 He i | 0.450.04 | 0.460.10 | 17006 He i | 0.400.09 | 0.260.07 |
| 4740 [Ar iv] | 1.320.04 | 1.330.17 | 17367 Br10 | 1.230.08 | 0.830.11 |
| 4861 H | 100.001.42 | 100.001.44 | 18179 Br9c | 0.800.08 | 0.510.09 |
| 4921 He i | 1.020.03 | 1.000.14 | 18756 Pac | 2.570.10 | 1.650.15 |
| 4959 [O iii] | 188.622.68 | 184.302.82 | 19451 Brc | 0.640.10 | 0.430.09 |
| 4986 [Fe iii] | 0.330.02 | 0.320.08 | 20337 H2 1-0 S(2) | 0.270.05 | 0.170.05 |
| 5007 [O iii] | 558.587.93 | 542.497.85 | 20586 He ic | 0.660.06 | 0.420.08 |
| 5016 He i | 1.880.04 | 1.820.19 | 21220 H2 1-0 S(1) | 0.670.06 | 0.420.08 |
| 5876 He i | 9.790.15 | 8.740.41 | 21661 Br | 3.620.11 | 2.280.18 |
| 6300 [O i] | 1.140.03 | 0.990.13 | 22195 [Fe iii] | 0.350.09 | 0.220.07 |
| 6312 [S iii] | 1.470.04 | 1.270.15 | 22230 H2 1-0 S(0) | 0.340.10 | 0.210.07 |
| 6363 [O i] | 0.620.07 | 0.530.10 | (H) | 0.225 | |
| 6563 H | 333.334.73 | 284.264.45 | EW(H)d | 112 | |
| 6583 [N ii] | 2.040.05 | 1.730.18 | (H)e | 83.8 | |
| 6678 He i | 3.020.06 | 2.560.21 | EW(abs)d | 1.15 | |
a observed flux.
b flux corrected for extinction and underlying stellar absorption.
c affected by telluric absorption.
d equivalent width of hydrogen absorption lines in Å.
e in units 10-16 erg s-1 cm-2.
| Property | Value |
|---|---|
| (O iii), K | 16690360 |
| (O ii), K | 15220300 |
| (O ii), K | 158201460 |
| (S iii), K | 15550300 |
| (S iii), K | 156403230 |
| (O ii), cm-3 | 6947 |
| (S ii), cm-3 | 76166 |
| (Ar iv), cm-3 | 1680530 |
| O+/H+, (105) | 0.450.03 |
| O2+/H+, (105) | 4.630.25 |
| O3+/H+, (106) | 1.020.15 |
| O/H, (105) | 5.180.25 |
| 12+log O/H | 7.710.02 |
| N+/H+, (106) | 0.120.01 |
| (N)a | 10.8 |
| N/H, (106) | 1.340.12 |
| log N/O | –1.590.05 |
| Ne2+/H+, (105) | 0.860.05 |
| (Ne)a | 1.04 |
| Ne/H, (105) | 0.890.06 |
| log Ne/O | –0.770.03 |
| S+/H+, (106) | 0.070.01 |
| S2+/H+, (106) | 0.590.08 |
| (S)a | 2.30 |
| S/H, (106) | 1.520.17 |
| log S/O | –1.530.05 |
| Ar2+/H+, (107) | 1.470.10 |
| Ar3+/H+, (107) | 1.030.13 |
| (Ar)a | 2.22 |
| Ar/H, (107) | 3.250.38 |
| log Ar/O | –2.200.06 |
| Fe2+/H+, (106)(4658) | 0.050.01 |
| (Fe)a | 16.0 |
| Fe/H, (106)(4658) | 0.760.22 |
| log Fe/O (4658) | –1.830.13 |
| Fe2+/H+, (106)(4986) | 0.060.01 |
| (Fe)a | 16.0 |
| Fe/H, (106)(4986) | 0.930.24 |
| log Fe/O (4986) | –1.750.11 |
a Ionisation correction factor.
3 The properties of the host galaxy
3.1 Element abundances
We derived element abundances from the narrow emission-line fluxes, using a classical semi-empirical method. These lines trace the interstellar medium (ISM) of PHL 293B. The fluxes in all spectra were measured using Gaussian fitting with the IRAF SPLOT routine. The 1 errors of the line fluxes were calculated from the data in the non-flux-calibrated spectra using SPLOT. The method is based on Monte-Carlo simulations, in which random gaussian noise with the dispersion obtained from the continuum near the line is added to the noise-free spectrum. To obtain good error estimates we have run 200 simulations per emission line. These errors were propagated in the calculations of the elemental abundance errors. The fluxes were corrected for both extinction, using the reddening curve of Cardelli et al. (1989), and underlying hydrogen stellar absorption, derived simultaneously by an iterative procedure described by Izotov et al. (1994) and using the observed decrements of the narrow hydrogen Balmer lines in the UVB and VIS spectra. The extinction coefficient (H) and equivalent width of hydrogen absorption lines EW(abs) are derived in such a way as to obtain the closest agreement between the extinction-corrected and theoretical recombination Balmer hydrogen emission-line fluxes normalised to the H flux. It is assumed that EW(abs) is the same for all hydrogen lines. This assumption is justified by the evolutionary stellar population synthesis models of González Delgado et al. (2005). The derived (H) and EWabs are applied for correction of the emission-line fluxes in the entire wavelength range 3000 – 22650Å.
The extinction-corrected total fluxes 100()/(H) of the narrow lines, and the extinction coefficient (H), the equivalent width of the H emission line EW(H), the H observed flux (H), and the equivalent width of the underlying hydrogen absorption lines EW(abs) are given in Table 1. The extinction-corrected fluxes are generally in good agreement with those derived by Izotov & Thuan (2009).
The physical conditions, and the ionic and total heavy element abundances in the H ii region of PHL 293B were derived following Izotov et al. (2006) (Table 2). In particular for O2+, Ne2+, and Ar3+, we adopt the temperature (O iii) directly derived from the [O iii] 4363/(4959 + 5007) emission-line ratio. The electron temperatures (O ii) and (S iii) were derived from the empirical relations by Izotov et al. (2006) based on photoionisation models of H ii regions. By direct methods we derived also (O ii)= 158201460 K from the [O ii](3726+3729)/(7320+7330) emission-line ratio and (S iii)= 156403230 K from the [S iii]6312/9069 emission-line ratio. Despite their higher errors these temperatures are in agreement with the temperatures (O ii) and (S iii) derived from the empirical relations. We used (O ii) for the calculation of O+, N+, S+, and Fe2+ abundances and (S iii) for the calculation of S2+ and Ar2+ abundances. The electron number densities (O ii), (S ii) and (Ar iv) were obtained from the [O ii] 3726/3729, [S ii] 6717/6731 and [Ar iv] 4711/4740 emission-line ratios, respectively. For these low electron number densities (Table 2), the collisional deactivation of the upper levels of forbidden optical and NIR emission lines is negligible as compared to the spontaneous transitions. The element abundances then do not depend sensitively on and the low-density limit holds for the abundance determination in PHL 293B. The ionic and total O, N, Ne, S, Ar, and Fe abundances derived from the forbidden emission lines are given in Table 2. The oxygen abundance 12+log O/H = 7.710.02 and abundance ratios log N/O = –1.590.05 and log Ne/O = –0.770.03 are consistent with the respective values 7.720.01, –1.550.02 and –0.740.02 derived by Izotov & Thuan (2009). All abundance ratios in Table 2 are typical for the low-metallicity emission-line galaxies (Izotov et al., 2006).
| Line | Observations | Modela | |
|---|---|---|---|
| Fluor. | Collis. | ||
| 1.314 H2 3-1 Q(1) | 0.2 | 0.6 | 0.0 |
| 2.034 H2 1-0 S(2) | 0.40.2 | 0.5 | 0.3 |
| 2.122 H2 1-0 S(1) | 1.0 | 1.0 | 1.0 |
| 2.223 H2 1-0 S(0) | 0.40.2 | 0.6 | 0.3 |
| 2.248 H2 2-1 S(1) | 0.3 | 0.5 | 0.0 |
a Model values are from Black & van Dishoeck (1987). We adopt their model 1 for fluorescent lines and model S1 for collisionally excited lines.
3.2 Extinction and hidden star formation
In all previous studies of BCDs except for those of Mrk 59 in Izotov et al. (2009), II Zw 40, Mrk 71, Mrk 996 and SBS 0335–052E in Izotov & Thuan (2011), the NIR spectra of BCDs were obtained in separate observations, and there was no wavelength overlap between the optical and NIR spectra. The fact that the spectrum of PHL 293B has been obtained simultaneously over the entire optical and near-infrared wavelength ranges, avoids adjusting uncertainties and permits us to compare directly the optical and NIR extinctions.
The agreement between the corrected values of the hydrogen line fluxes in both the optical and NIR ranges (Table 1) and theoretical recombination values by Hummer & Storey (1987) implies that a single (H) [or ] can be used over the whole 3000 – 22650Å range to correct line fluxes for extinction. In particular, the extinction-corrected flux of the Br emission line (Br)/(H) = 0.230.02 is in agreement with the Hummer & Storey (1987) recombination value of 0.25 for the electron temperature = 15000K and the electron number density = 100 cm-3. The fact that does not increase when going from the optical to the NIR wavelength ranges implies that the NIR emission lines do not probe more extinct regions with hidden star formation as compared to the optical emission lines. This appears to be a general result for BCDs (e.g. Vanzi et al., 2000, 2002; Izotov et al., 2009; Izotov & Thuan, 2011).
3.3 H2 emission
Molecular hydrogen lines do not originate in the H ii region, but in neutral molecular clouds. In the near-infrared, they are excited through two mechanisms. The first one is a thermal mechanism consisting of collisions between neutral species (e.g., H, H2) resulting from large-scale shocks due to the interaction of stars with molecular clouds or/and cloud-cloud collisions. The second one is the fluorescent mechanism due to the absorption of ultraviolet photons from the hot stars. By comparing the observed line ratios with those predicted by models, such as those calculated by Black & van Dishoeck (1987), it is possible to discriminate between the two processes. In particular, line emission from vibrational levels 2 is virtually absent in collisionally excited spectra, while they are relatively strong in fluorescent spectra.
Three H2 lines, 2.034 m 1-0 S(2), 2.122 m 1-0 S(1) and 2.223 m 1-0 S(0), are detected in the NIR spectrum of PHL 293B. These lines are labelled in Fig. 2 and their fluxes relative to that of the strongest 2.122 m 1-0 S(1) line with the 1 errors are shown in Table 3. The two last columns of the Table show theoretical ratios by Black & van Dishoeck (1987) for fluorescent and collisional excitation, respectively. It is seen from the Table that the observed line flux ratios of the lines from the vibrational level = 1 are in agreement with the values expected for both the fluorescent and collisional excitation. However, no emission lines from the vibrational levels 2 were detected while they should be present if the fluorescent excitation is important.
We show in Table 3 the 1 upper limits of the two strongest H2 emission lines, 1.314 m 3-1 Q(1) and 2.248 m 2-1 S(1), originating from the upper levels 2 and label their location in the spectrum on Fig. 2. In the case of excitation dominated by fluorescence these lines would be as strong as 2.034 m 1-0 S(2) and 2.223 m 1-0 S(0) lines. Therefore, we conclude that H2 vibrational states in the spectrum of PHL 293B are mainly collisionally excited. This is at variance with conclusions made by Vanzi et al. (2000) for SBS 0335–052E, Vanzi et al. (2008) for II Zw 40, Izotov et al. (2009) for Mrk 59, and Izotov & Thuan (2011) for II Zw 40, Mrk 71, Mrk 930, Mrk 996 and SBS 0335–052E. There it has been found that fluorescence is the dominating excitation mechanism of H2 lines in BCDs. Apparently, the difference is related to the low H luminosity of PHL293B that is 6 times lower than that in Mrk 71 and more than one order of magnitude lower than that in other BCDs studied by Vanzi et al. (2000), Vanzi et al. (2008), Izotov et al. (2009) and Izotov & Thuan (2011), indicating a low intensity of the UV radiation in PHL293B.
4 Broad emission from the LBV star
The detection of the LBV star in PHL 293B indicates that high-mass stars are present in its star forming region. The equivalent width of the narrow H emission line EW(H) = 112Å in PHL 293B (Table 1) corresponds to a starburst age of 4.5 Myr for the PHL 293B metallicity (Schaerer & Vacca, 1998). At this age massive stars with masses up to 60 still can be present (Meynet et al., 1994) and one of them was likely evolved to the LBV star we see today. Below we consider the properties of the LBV broad emission lines seen in the VLT/X-shooter spectrum.
4.1 Fluxes
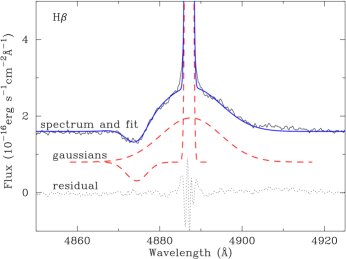
In Table 4 we show the observed fluxes of the broad and narrow components of hydrogen H, H and H emission lines for three epochs encompassing 8 years. For the SDSS and UVES data, we adopted fluxes and respective errors from Izotov & Thuan (2009). For the X-shooter data, using the IRAF/SPLOT routine, we decomposed the H, H and H lines into a narrow emission gaussian component, a broad emission gaussian component and an absorption gaussian component. An example of the line decomposition is shown in Fig. 3 for the H line profile. It is seen from the Figure that the fit nicely reproduces the observed line profile. Fluxes of the broad lines in Table 4 are those corresponding to the fluxes of broad gaussians with the respective errors which are derived similarly to those for narrow lines according to prescriptions in Sect. 3.1. We note that real errors of the fluxes can be significantly larger due to, e.g., uncertainties of the flat-field correction, background subtraction, telluric absorption, flux calibration, which are difficult to be accounted for.
We also note for the first time the presence of broad components of Pa and Pa emission lines in the VLT/X-shooter spectrum with the observed fluxes of (4.70.7)10-16 and (8.10.5)10-16 erg s-1 cm-2, respectively.
A comparison of fluxes in Table 4 for different epochs shows that they vary by 50% and are the lowest for the VLT/UVES observations for both the broad and narrow components. The fluxes of broad components in SDSS and VLT/X-shooter spectra are in agreement, but fluxes of narrow components are higher in the SDSS spectrum. The narrow lines are most likely produced in the H ii region ionised by many O stars. Therefore, we would not expect temporal variations of these lines. Probably, the observational uncertainties and different extraction apertures play a role. The observational uncertainties may be caused by varying weather conditions, uncertainties in acquisition, and different epochs of observation of the object and the standard star. The larger fluxes of narrow emission lines by 25% in the SDSS spectrum can be explained by a larger round 3″ aperture as compared to the smaller extraction aperture for the VLT/X-shooter spectrum. The different apertures, however, should not influence the fluxes of the broad lines because these lines are emitted by the compact expanding envelope around the LBV star. As for the VLT/UVES observations, Izotov & Thuan (2009) do not present extraction apertures. These observations were done under non-photometric conditions, according to the ambient conditions database of the Paranal observatory. This may be the reason why the fluxes of the emission lines in the VLT/UVES spectrum are the lowest.
| Date | Broad line fluxa | Narrow line fluxa | Broad-to-narrow line flux ratio | ||||||||
|---|---|---|---|---|---|---|---|---|---|---|---|
| H | H | H | H | H | H | H | H | H | |||
| 2001.08.22b | … | 26.64.5 | 97.86.3 | 46.12.1 | 104.84.6 | 351.07.0 | … | 0.250.04 | 0.280.02 | ||
| 2002.11.08c | 7.50.2 | 16.70.3 | 55.20.6 | 32.60.5 | 71.60.8 | 213.62.1 | 0.230.01 | 0.230.01 | 0.260.01 | ||
| 2009.08.16d | 7.40.2 | 22.80.3 | 97.00.7 | 36.00.5 | 83.81.2 | 279.34.0 | 0.210.01 | 0.270.01 | 0.350.01 | ||
ain units of 10-16 erg s-1 cm-2.
bfluxes are from the SDSS spectrum obtained with the round aperture of 3″ in diameter (Izotov & Thuan, 2009).
cfluxes from the VLT/UVES spectrum obtained with a 1″ wide slit under non-photometric conditions (Izotov & Thuan, 2009).
dfluxes from the VLT/Xshooter spectra within the apertures 1″25 for the H and H lines and 025 for the H line (this paper).
We also present in Table 4 the broad-to-narrow line flux ratios. At variance to the line fluxes these flux ratios should not be sensitive to the uncertainties in the flux calibration, although they depend on the extraction apertures. The largest differences of the flux ratios are for the H line with the largest value in the X-shooter observations. If, however, the aperture correction by a factor of 1.25 to the narrow H line flux in the X-shooter observations is applied, the broad-to-narrow H line flux ratios in the SDSS and X-shooter data would be in good agreement. The same aperture correction for the UVES data results in a H flux ratio, which is 40% lower. Apparently, some variations of the broad emission-line fluxes in PHL 293B on a time scale of 8 years were present. These temporal variations are followed by variations of the broad line widths, discussed below in Sect. 4.2.
The broad H line luminosity of the LBV in PHL 293B derived from the X-shooter spectrum and corrected for the extinction with (H) = 0.225 is 9.0 1038 erg s-1. It compares well with the broad H luminosity of 1039 erg s-1 derived from the SDSS spectrum adopting (H) = 0.245 from Izotov et al. (2007). Note that the broad H luminosity of the LBV in PHL 293B of 6.0 1038 erg s-1, reported by Izotov & Thuan (2009), was not corrected for extinction. Thus, the H luminosity of the LBV in PHL 293B is one order of magnitude higher than (H) 1038 erg s-1 of the V1 star in NGC 2363, the third lowest-metallicity LBV known (Drissen et al., 2001) after those in PHL 293B and DDO 68, and two orders of magnitude higher than (H) 9.41036 erg s-1 of the LBV in DDO 68. We also can estimate the brightness of the LBV in the continuum. The intensity of, e.g., H and H at the bottom of the blue absorption features in the VLT and SDSS spectra of PHL 293B is 0.8 that of the continuum. Since the light of the LBV star is diluted by the emission of the galaxy and assuming that the intensities at the bottom of these absorption features in the spectrum of the LBV itself are zero (e.g., Kudritzki & Puls, 2000), we adopt that the fraction of the LBV continuum in the total continuum of PHL 293B is 20%. With this fraction and using the apparent SDSS magnitude of 18.2 inside the 3″ fiber aperture of the SDSS spectrum we obtain an apparent magnitude for the LBV of = 19.9, which is not corrected for extincion. This corresponds to an absolute magnitude = –11.9 at a distance = 22.7 Mpc. If the extinction coefficient = 0.225 is taken into account, then the LBV star would be 0.5 mag brighter. Thus, despite these crude estimates, we conclude, that the absolute brightness of the LBV in PHL 293B is one of the highest among the other LBVs and compares well with the brightness of Car, the most luminous LBV in the Milky Way (Massey, 2003; Smith et al., 2011). All this implies that the LBV star in PHL 293B is experiencing a strong outburst.
4.2 Velocities of the stellar wind
One of the most important features of the VLT/X-shooter spectrum is that the P Cygni profiles of the LBV star are seen not only in the Balmer hydrogen lines, but also in the Paschen hydrogen and He i lines. In particular, no He i lines with P Cygni profiles were detected and reported in the SDSS and VLT/UVES spectra of PHL 293B implying some changes in the LBV spectrum after eight years. Examples of the lines with the blue absorption minima are shown in Fig. 4. Earlier Izotov & Thuan (2009) reported the presence of He i lines with P Cygni profiles in the spectrum of another LBV in the extremely metal-deficient BCD DDO 68.
In Table 5, we show the terminal velocities of the stellar winds for the Balmer, Paschen and He i lines and the FWHMs of the broad Balmer and Paschen lines of the PHL 293B LBV, as derived from the X-shooter (this paper) and UVES (Izotov & Thuan, 2009) spectra. The stellar wind terminal velocity is derived from the wavelength difference between the blue absorption minimum and the narrow nebular emission line maximum. The ’s derived from different lines for two different epochs are similar. However, the much larger number of the lines of different species in the VLT/X-shooter spectrum allowed us to uncover some new interesting properties. The examination of Table 5 shows that the terminal velocities derived from the Balmer lines are systematically higher than those derived from the Paschen lines and He i lines. Thus, the averaged terminal velocities for Balmer, Paschen and He i lines are 81820, 78213 and 76234 km s-1, respectively, while the weighted mean terminal velocities for the same lines are 8208, 78322 and 76415 km s-1, respectively. These differences may have important implications for our understanding of the LBV wind properties. The Balmer absorption lines are formed in transitions from the level with the principal quantum number = 2, while for the Paschen line transition the lower level is = 3, which is less populated. Therefore, the Balmer absorption lines are formed in more outer layers of the expanding envelope as compared to the Paschen absorption lines. Probably, the level = 2 for He i is also less populated as compared to that for hydrogen because of its higher energy and lower He abundance. Therefore, the He i absorption lines are formed in more inner layers as compared to the Balmer absorption lines. Then the differences in the terminal velocities for different transitions can be explained by a wind accelerating outward.
| X-shootera | UVESb | ||||
|---|---|---|---|---|---|
| Line | c | FWHMbrc | c | FWHMbrc | |
| 3750 H12 | 83326 | … | … | … | |
| 3770 H11 | 82826 | … | … | … | |
| 3797 H10 | 80624 | … | … | … | |
| 3835 H9 | 80127 | … | … | … | |
| 3888 H8 | 81624 | … | … | … | |
| 3968 H7 | 84824 | … | … | … | |
| 4101 H | 79224 | 87840 | 735 | 47430 | |
| 4340 H | 83624 | 100620 | 871 | 68114 | |
| 4471 He i | 78743 | … | … | … | |
| 4861 H | 83325 | 96616 | 819 | 64912 | |
| 4921 He i | 69739 | … | … | … | |
| 5016 He i | 80230 | … | … | … | |
| 5876 He i | 77755 | … | … | … | |
| 6563 H | 78733 | 91410 | 859 | 71910 | |
| 6678 He i | 75727 | … | … | … | |
| 7065 He i | 75243 | … | … | … | |
| 8753 Pa12 | 76542 | … | … | … | |
| 8865 Pa11 | 79937 | … | … | … | |
| 9017 Pa10 | 78854 | … | … | … | |
| 9232 Pa9 | 77553 | … | … | … | |
| 10941 Pa | … | 1237160 | … | … | |
| 12821 Pa | … | 109355 | … | … | |
aThis paper.
bIzotov & Thuan (2009).
cIn km s-1.

Another important feature of the VLT/X-shooter spectrum is that our derived FWHMs of 1000 km s-1 are by a factor of 1.5 higher than those obtained by Izotov & Thuan (2009), but are consistent with FWHMs derived by Izotov & Thuan (2009) for another low-metallicity LBV in the BCD DDO 68. We also measured ’s and FWHMs of broad H and H emission lines in the lower-resolution SDSS spectrum obtained 1 year earlier than the VLT/UVES spectrum. We find that a of 800 km s-1 in the SDSS spectrum is consistent with the values in Table 5. On the other hand, the FWHMs of the broad H and H emission lines in the SDSS spectrum, 1000 km s-1, are higher than those in the VLT/UVES spectrum but are similar to the values derived from the VLT/X-shooter spectrum. Despite these differences, all FWHMs of the broad lines in the spectra of PHL 293B are significantly broader than those observed in the spectra of high-metallicity LBVs which are about 100-200 km s-1 (e.g. Leitherer et al., 1994). However, they are similar to the FWHMs in some extragalactic LBVs during their outburst phase (Smith et al., 2011). It is possible therefore that the LBV in PHL 293B also experiences a strong outburst.
5 Conclusions
We have studied here the properties of the narrow-line spectrum of the blue compact dwarf (BCD) galaxy PHL 293B and the broad line emission of the luminous blue variable (LBV) star in this galaxy from the VLT/X-shooter spectroscopic observations in the wavelength range 3000 – 22650Å. This data has been compared with the data obtained earlier by Izotov & Thuan (2009) from SDSS and VLT/UVES observations. We have arrived at the following conclusions:
1. The oxygen abundance in PHL 293B is 12+log O/H = 7.71 0.02, in agreement with the 12+log O/H = 7.72 0.01 derived by Izotov & Thuan (2009) from the VLT/UVES spectrum and the 12+log O/H = 7.66 0.04 derived by Izotov et al. (2007) from a lower resolution SDSS spectrum. This BCD is the second lowest-metallicity galaxy with a detected LBV star, after DDO 68.
2. We find that the extinction-corrected fluxes of narrow hydrogen lines in the entire wavelength range 3000 – 22650Å are in good agreement with the theoretical recombination values if the extinction coefficient (H) = 0.225, derived from the narrow-line Balmer decrement, is adopted (Table 1). This implies that no additional star formation is found that is seen in the NIR range but is hidden in the visible range.
3. We detect three = 1-0 emission lines of vibrationally-excited molecular hydrogen. The relative fluxes of these lines and non-detection of = 2-1 and 3-1 emission suggest that H2 is collisionally excited in PHL 293B.
4. Broad hydrogen emission lines are seen in both the optical and NIR spectra of PHL 293B. The broad H luminosity in the LBV is by a factor of 10 higher than the one in the higher-metallicity LBV in NGC 2363 (Drissen et al., 1997, 2001; Petit et al., 2006) and by a factor of 100 higher than in the LBV star in DDO 68 (Izotov & Thuan, 2009). We find some evidence for flux variations of the broad lines on a time scale of 8 years.
5. For the first time we find P Cygni profiles not only from Balmer hydrogen lines, but also from Paschen hydrogen and He i lines in this LBV. We derive a high terminal velocity of the stellar wind. The averaged terminal velocity from Balmer lines (81820 km s-1) is larger than those derived from the Paschen lines (78213 km s-1) and He i lines (76234 km s-1), probably indicating that the wind is accelerating outward. These ’s are several times larger than the of 100 – 200 km s-1 in some high-metallicity counterparts of the Milky Way. However, the high is similar to those observed in some extragalactic LBVs during their outburst phase (Smith et al., 2011).
Acknowledgements.
We thank Dr. G. Stasińska for carefully reading the manuscript and for providing useful comments. Y.I.I., N.G.G. and K.J.F. are grateful to the staff of the Max Planck Institute for Radioastronomy for their warm hospitality and acknowledge support through DFG grant No. FR 325/59-1. This research has made use of the NASA/IPAC Extragalactic Database (NED) which is operated by the Jet Propulsion Laboratory, California Institute of Technology, under contract with the National Aeronautics and Space Administration.References
- Black & van Dishoeck (1987) Black, J. H., & van Dishoeck, E. F. 1987, ApJ, 322, 412
- Cardelli et al. (1989) Cardelli, J. A., Clayton, G. C., & Mathis, J. S. 1989, ApJ, 345, 245
- Clark et al. (2005) Clark, J. S., Larionov, V. M., & Arkharov, A. 2005, A&A, 435, 239
- Conti (1984) Conti, P. 1984, in IAU Symp. 105, Observational Tests of Stellar Evolution Theory, ed. A. Maeder & A. Renzini (Dordrecht: Reidel), 233
- Crowther (2004) Crowther, P. 2004, in Evolution of Massive Stars, Mass Loss and Winds, ed. M. Heydari-Malayeri, Ph. Stee & J.-P. Zahn, EAS Publications Series, v. 13, 119
- Crowther & Hadfield (2006) Crowther, P. A., & Hadfield, L. J. 2006, A&A, 449, 711
- Drissen et al. (1997) Drissen, L., Roy, J.-R., & Robert, C., 1997, ApJ, 474, L35
- Drissen et al. (2001) Drissen, L., Crowther, P. A., Smith, L. J., Robert, C., Roy, J.-R., & D. J. Hillier 2001, ApJ, 546, 484
- González Delgado et al. (2005) González Delgado, R. M., Cerviño, M., Martins, L. P., Leitherer, C., & Hauschildt, P. H. 2005, MNRAS, 357, 945
- Guseva et al. (2000) Guseva, N. G., Izotov, Y. I., & Thuan, T. X. 2000, ApJ, 531, 776
- Hummer & Storey (1987) Hummer, D. G., & Storey, P. J. 1987, MNRAS, 224, 801
- Humphreys & Davidson (1994) Humphreys, R. M., & Davidson, K. 1994, PASP, 106, 1025
- Izotov & Thuan (2008) Izotov, Y. I., & Thuan, T. X. 2008, ApJ, 687, 133
- Izotov & Thuan (2009) Izotov, Y. I., & Thuan, T. X. 2009, ApJ, 690, 1797
- Izotov & Thuan (2011) Izotov, Y. I., & Thuan, T. X. 2011, ApJ, 734, 82
- Izotov et al. (1994) Izotov, Y. I., Thuan, T. X., & Lipovetsky, V. A. 1994, ApJ, 435, 647
- Izotov et al. (1997) Izotov, Y. I., Foltz, C. B., Green, R. F., Guseva, N. G., & Thuan, T. X. 1997, ApJ, 487, L37
- Izotov et al. (1999) Izotov, Y. I., Chaffee, F. H., Foltz, C. B., Green, R. F., Guseva, N. G., & Thuan, T. X. 1999, ApJ, 527, 757
- Izotov et al. (2006) Izotov, Y. I., Stasińska, G., Meynet, G., Guseva, N. G., & Thuan T. X. 2006, A&A, 448, 955
- Izotov et al. (2007) Izotov, Y. I., Thuan, T. X., & Guseva, N. G. 2007, ApJ, 671, 1297
- Izotov et al. (2009) Izotov, Y. I., Thuan, T. X., & Wilson, J. C. 2009, ApJ, 703, 1984
- Kiriakidis et al. (1993) Kiriakidis, M., Fricke, K. J., & Glatzel, W. 1993, MNRAS, 264, 50
- Kudritzki & Puls (2000) Kudritzki, R.-P., & Puls, J. 2000, ARA&A, 38, 613
- Legrand et al. (1997) Legrand, F., Kunth, D., Roy, J.-R., Mas-Hesse, J. M., & Walsh, J.-R. 1997, A&A, 326, L17
- Leitherer et al. (1994) Leitherer, C., et al. 1994, ApJ, 428, 292
- Maeder & Meynet (2000) Maeder, A., & Meynet, G. 2000, ARA&A, 38, 143
- Massey (2003) Massey, P. 2003, ARA&A, 41, 15
- Meynet et al. (1994) Meynet, G., Maeder, A., Schaller, G., Schaerer, D., & Charbonnel, C. 1994, A&A, 103, 97
- Petit et al. (2006) Petit, V., Drissen, L., & Crowther, P. 2006, AJ, 132, 1756
- Pustilnik et al. (2008) Pustilnik, S. A., Tepliakova, A. L., Kniazev, A. Y., & Burenkov, A. N. 2008, MNRAS, 388, L24
- Schaerer & Vacca (1998) Schaerer, D., & Vacca, W. D. 1998, ApJ, 497, 618
- Smith et al. (2011) Smith, N., Li, W., Silverman, J. M., Ganeshalingam, M., & Filippenko, A. V. 2011, MNRAS, in press; preprint arXiv:1010.3718
- Thuan & Izotov (1997) Thuan, T. X., & Izotov, Y. I. 1997, ApJ, 489, 623
- Thuan & Izotov (2005) Thuan, T. X., & Izotov, Y. I. 2005, ApJS, 161, 240
- Vanzi et al. (2000) Vanzi, L., Hunt, L. K., Thuan, T. X., & Izotov, Y. I. 2000, A&A, 363, 493
- Vanzi et al. (2002) Vanzi, L., Hunt, L. K., & Thuan, T. X. 2002, A&A, 390, 481
- Vanzi et al. (2008) Vanzi, L., Cresci, G., Telles, E., & Melnick, J. 2008, A&A, 486, 393