Presently at: ]Joint Research Center, Institute for Reference Materials and Measurement, 2440 Geel - Belgium
Presently at: ]Laboratoire de l’Accélérateur Linéaire, Centre Scientifique d’Orsay, 91898 Orsay - France
Presently at: ]Centre de Spectrométrie Nucléaire et de Spectrométrie de Masse, 91405 Orsay Campus - France
Presently at: ]INFN - Sezione di Roma Tor Vergata, Roma I-00133 - Italy
Presently at: ]Queen’s University, Kingston, ON K7L 3N6 - Canada
Presently at: ]Institut d’Astrophysique Spatial, 91045 Orsay - France
Presently at: ]CEA / Saclay, 91191 Gif-sur-Yvette - France
Presently at: ]Lawrence Livermore National Laboratory, Livermore, CA 94550 - USA
Double-beta decay of 130Te to the first excited state of 130Xe with CUORICINO
Abstract
The CUORICINO experiment was an array of 62 TeO2 single-crystal bolometers with a total 130Te mass of kg. The experiment finished in 2008 after more than 3 years of active operating time. Searches for both and double-beta decay to the first excited state in 130Xe were performed by studying different coincidence scenarios. The analysis was based on data representing a total exposure of N(130Te)t=y. No evidence for a signal was found. The resulting lower limits on the half lives are y (90% C.L.), and y (90% C.L.).
pacs:
23.40.Hc, 23.40.Bw, 21.10.Bw, 27.60.+jI Introduction
Two-neutrino double-beta () decay and neutrinoless double-beta () decay have been known for over 70 years now Goeppert-Mayer (1935); Racah (1937) (a recent review can be found in Avignone et al. (2008)). While experimental evidence for -decay has been found there is still no observation for the -decay, however several limits for the half-life have been set in the past with values greater than y. In both of these processes the lifetime is proportional to the square of the Nuclear Matrix Elements (NME). Two neutrino double beta decay has been detected in ten nuclei on the ground state of the daughter nucleus and in two nuclei on the excited state of it, and the corresponding extracted values for the NME are in reasonable agreement with the theoretical expectation. In the case of -decay their value is very important since it plays the same role in the prediction of the decay time as , the effective neutrino mass Avignone et al. (2008); Rodin et al. (2006, 2007); MEDEX Conference (2011).
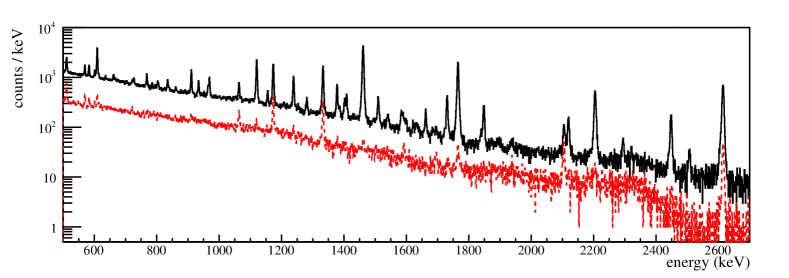
The CUORICINO experiment was an array of 62 TeO2 bolometers operated at a temperature of about mK. A bolometer Enss and McCammon (2008); Booth et al. (1996) detects an energy release as a temperature rise in the absorber crystal. Thermal pulses are converted into electric signals by means of neutron transmutation doped (NTD) thermistors Haller et al. (1984), which are coupled to each absorber. CUORICINO was organized in 13 planes. All of these planes were composed of four crystals with dimensions of cm3 and a mass of g each, except for the and (from top to bottom). Each of these two particular planes had 9 crystals with dimensions of cm3 and a mass of g. Two of these smaller crystals were enriched to 82.3 of 128Te and two others to 75 of 130Te. All the other crystals had the natural isotopic abundance of 130Te (33.8%). A monthly calibration was performed using a 232Th source. The energy spectrum of the events collected by CUORICINO can be seen in Figure 1. A more detailed description of the experiment can be found in Arnaboldi et al. (2008).
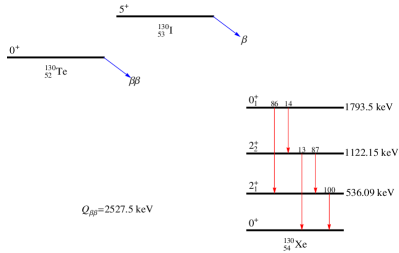
CUORICINO’s geometry provides a unique opportunity to search for and decay to the first excited state in 130Xe in an essentially background-free environment. This is due to the fact that these processes can be studied using a coincidence-based analysis by searching for two lines of well defined energy. As can be seen in Figure 2, the decay to the first excited state in 130Xe differs from the one to the ground state in that it produces a gamma cascade. Given the Q-value of the decay, =2527.5 keV Redshaw et al. (2009); Scielzo et al. (2009); Rahaman et al. (2011), the two electrons are left with a total energy of 734.0 keV. The most probable de-excitation pattern, with a 86% branching ratio, proceeds through the emission of a keV and a keV gamma.
Though and decay both result in the emission of two electrons, the spectra of the sum energy of the two electrons differ drastically. In the first case, the two resulting betas have a continuous spectrum in the range (0734.0) keV, while in the second case, the result is just a monochromatic beta peak centered at 734.0 keV. Theoretical evaluations and experimental limits for these two processes can be found in Table 1. It is important to note that the theoretical calculation for the half life of 2-decay to the first excited state 0+ reported in Table 1 is not the one originally indicated in reference Toivanen and Suhonen (1997) since it was based on a wrong evaluation of the phase-space. The reported value is the one re-elaborated by A.S. Barabash Barabash et al. (2001) on the basis of the correct phase space factor.
| Decay | Transition | Theoretical (y) | Experimental (y) |
|---|---|---|---|
| 0 | 7.51025 Suhonen (2000); Suhonen and Aunola (2003) | 1022 Arnaboldi et al. (2003) | |
| (1.615)1023 Tretyak and Zdesenko (2002) | 1024 Andreotti et al. (2011) | ||
| 2 | (5.114)1022 Barabash et al. (2001); Toivanen and Suhonen (1997)111Corrected values for Toivanen and Suhonen (1997) (discussion in text) | 1021 Barabash et al. (2001) | |
| (1.770)1019 Tretyak and Zdesenko (2002) | 1020 Arnold et al. (2011) |
II Search Strategy and Event Selection
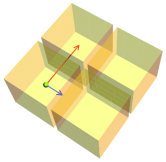
In this analysis, we consider only configurations in which the electrons are contained in the crystal where the decay takes place, and each de-excitation photon is completely absorbed in one crystal. With these requirements, three different scenarios are possible (see Figure 3). Scenario 1 takes place when both gammas escape from the original crystal. In scenario 2, the low-energy gamma (536.09 keV) is trapped in the original crystal with the betas, while the high-energy gamma (1257.41 keV) escapes. Scenario 3 is the opposite of scenario 2: the high-energy gamma (1257.41 keV) is trapped in the original crystal with the betas, while the low-energy one (536.09 keV) escapes. The signatures and the corresponding efficiencies are reported in Table 2. A further explanation of the calculation of the efficiencies can be found in Section III.


| Decay mode | Scenario | Signature (energies in keV) | Efficiency | ||
|---|---|---|---|---|---|
| MC | Instrumental | Total | |||
| 1 | 734 () + 536 () + 1257 () | (0.600.02)% | (862)% | (0.44 0.02)% | |
| 2 | 1257 () + 1270 () | (2.290.04)% | (901)% | (1.77 0.04)% | |
| 3 | 536 () + 1991 () | (1.410.03)% | (901)% | (1.09 0.03)% | |
| 1 | (0 734) () + 536 () + 1257 () | (0.530.02)% | (862)% | (0.39 0.02)% | |
| 2 | (536 1270) () + 1257 () | (3.040.04)% | (901)% | (2.35 0.04)% | |
| 3 | (1257 1991) () + 536 () | (1.280.03)% | (901)% | (0.99 0.03)% | |
The first-level analysis of the CUORICINO data is common to all physics processes to be studied and is described in detail in Andreotti et al. (2011). It starts from raw events and ends with a set of energy-calibrated hits associated with a time, a crystal, and other ancillary information, such as pulse shape parameters. In this phase of the analysis, a channel- and time-dependent energy threshold is applied to the data, based on the performance of each bolometer.
For the processes studied in this paper, the analysis consists of defining signatures according to the three scenarios reported in Table 2, using them to select events from the CUORICINO data and evaluating the corresponding efficiencies from GEANT4-based Monte Carlo simulations Bucci et al. (2009).
Event selection criteria can be grouped into three categories: global, event-based and coincidence-based. Global and event-based cuts are not specific to this analysis, and here we only outline them briefly (refer to Andreotti et al. (2011) for details). Defined a priori, global cuts are used to discard time windows in which one or more detectors performed poorly. This could happen because of external noise or cryogenic instabilities, which in turn result in a bad energy resolution. Event-based cuts allow the exclusion of non-physical pulses (electronic spikes or cryogenic-induced pulses) and physical pulses for which the energy is not estimated correctly (pile-up or excessive noise superimposed on the pulse).
Coincidence-based cuts rely on the properties of a group of events that occurred within a fixed time window. Events can be selected based on the number of involved crystals, the spatial distance among them, the sum energy or the energy of the single hits. In this paper, a 100 ms time window was used to define coincident events. Physical coincidences induced by 130Xe de-excitation occur on much shorter time scales, but such a large time window must be chosen to account for the slow response of the bolometers.
The coincidence-based event selection criteria were decided based on the scenarios described at the beginning of this section. Because the two electrons emitted in the 2 decay have a continuous spectrum, a wide energy window must be chosen for one of the crystals. This has the effect of introducing a much bigger background than is present in the analysis of the 0 decay mode. As a consequence, besides the criteria reported in Table 2, additional restrictions were applied to the events to be included in the 2 analysis. To reduce random coincidences, a cut was imposed on the distance between the crystals involved in the events, as it was seen from the simulation that there is a low chance for the investigated processes to involve crystals that are far apart from each other. The most relevant background from physical processes is due to gamma rays that undergo a Compton interaction in one crystal and are then absorbed in another crystal. While the sum energy of these events is fixed, the energy released in each crystal has a continuous distribution. To reduce this background, events whose sum energy fell into a window of 8 keV around the most intense gamma lines (1729.60 keV, 1764.49 keV, 1847.42 keV, 2118.5 keV, 2204.21 keV and 2447.86 keV from 214Bi, 2505 keV from 60Co and 2615 keV from 208Tl) were removed.
III Analysis
As stated in Section II, Monte Carlo simulations were used to calculate the efficiencies for the processes studied in this paper. This was achieved by comparing the number of events passing the coincidence cuts to the total number of simulated events. The relatively low efficiencies reported in Table 2 arise from the fact that most of the gammas escape the crystals undetected and are absorbed by inert materials surrounding them. Moreover, the signatures sought only consider the case of photons that are completely absorbed in one crystal, thus rejecting events in which at least one photon is absorbed in one crystal after undergoing a Compton interaction in a different one. The computed values reported in the last column of Table 2 also include inefficiencies due to event-based cuts, channel- and time-dependent energy thresholds, and discarded time windows in which one or more detectors were not performing properly (global cuts). Inefficiencies induced by channel based cuts were evaluated on the CUORICINO data in the same way discussed in Andreotti et al. (2011). The effect of global cuts was taken into account by removing the simulated events lying in the time windows that were discarded from the real CUORICINO data, after said time windows were rescaled by the ratio between the total duration of the simulation and the real CUORICINO live time. The same procedure was used to associate energy thresholds to the simulation. Because the effect of global cuts was taken into consideration when determining the efficiencies, the exposure used in this work corresponds to the complete CUORICINO statistics without any subtractions: N(130Te)t = y.
Figure 4 shows the energy spectra obtained from the CUORICINO data after applying the event selection cuts described in Section II. For each scenario, the spectrum was built as follows. Coincidence cuts were applied based on Table 2, requiring that the accepted events be in coincidence with events satisfying each component hit of the signature except for the hit corresponding to the highest-energy . The signal search could then consist of a search in the resultant spectrum for evidence of the highest-energy of the signature, which is the component with the lowest background. Moreover, the acceptance width for each cut was enlarged by 10 keV with respect to the energies and energy ranges listed in Table 2, to account for the finite energy resolution of the detectors (keV; see discussion below). The energy windows used for the spectra were chosen to be much larger than the detector resolution, but small enough that at most one radioactive background peak was included, and the continuum could be assumed to be flat or linear.
No evidence for a signal was found in any of the energy spectra. For the zero-neutrino decay mode, the background is negligible, and no fit was performed. In this case, a condition of zero signal and zero background was assumed. In contrast, the background is not negligible for the 2 decay mode, and therefore a Bayesian maximum likelihood fit was performed for the 2 analyses. The best-fit curves are represented by the blue lines in Figure 4. Depending on the scenario, different background models were adopted for the 2 spectra. The continuum was fitted with a constant (scenarios 1 and 2) or linear shape (scenario 3), while the possible additional peaks (1238 keV from 214Bi for scenario 2, 511 keV for scenario 3) were fitted with a Gaussian shape. The free parameters in the fit were as follows: the number of signal counts, the number of events from the flat background and the number of counts under the additional background peaks (scenarios 2 and 3). The energy resolution was fixed to =1.8 keV. It was evaluated on the 511 keV peak and on the two 60Co peaks at 1173 keV and 1332 keV that are visible in the CUORICINO energy spectrum (see Figure 1), and it was found to be comparable for all three peaks. A summary of the best-fit values for the searches is reported in Table 3. Systematic uncertainties were evaluated by repeating the fitting procedure with different background models, fitting ranges and energy resolutions, and, compared to statistical uncertainties, they were found to be negligible.
| Scenario | ||
|---|---|---|
| [counts] | [counts/keV] | |
| 1 | 1.11.40.29 | 0.120.03 |
| 2 | -0.46.62.6 | 6.310.41 |
| 3 | -3.06.82.8 | 6.730.33 |
IV Results
For each decay mode and for each of the three scenarios, the posterior probability density function (p.d.f.) for the number of signal counts, , was extracted using a Bayesian approach and assuming flat priors in the physical region (). For the 0 decay mode, because there was no evidence of a signal and the background was negligible, a Poisson p.d.f. for zero observed events was assumed for all three scenarios. For the 2 decay mode, the p.d.f.s were obtained as a result of the maximum likelihood fits on the spectra shown in Figure 4. For each decay mode, a global p.d.f. for the decay rate was obtained as the product of the three individual p.d.f.s, . In this formula , where the index runs over the three scenarios and is the corresponding detection efficiency from Table 2. Systematic uncertainties were included in the according to the procedure described in Andreotti et al. (2011). This resulted in the following half life lower limits:
These new limits represent an improvement of almost 2 orders of magnitude, for both the 0 and 2 processes, with respect to the results of past experiments. It is worth noting that the new lower limit on the half life of the 2 decay mode is close to the upper bound of the theoretical calculation presented in Table 1. A more clear picture will be available once CUORE, CUORICINO’s successor Arnaboldi et al. (2004), comes online. This is due to the increase in target mass and improved background reduction that will be achieved in CUORE.
Acknowledgments
The CUORICINO Collaboration owes many thanks to the Directors and Staff of the Laboratori Nazionali del Gran Sasso over the years of the development, construction and operation of CUORICINO, and to the technical staffs of our Laboratories. In particular we would like to thank R. Gaigher, R. Mazza, P. Nuvolone, M. Perego, B. Romualdi, L. Tatananni and A. Rotilio for continuous and constructive help in various stages of this experiment. We are grateful to our colleagues Y.G. Kolomenski and L. Zanotti for help and fruitful discussions. The CUORICINO experiment was supported by the Istituto Nazionale di Fisica Nucleare (INFN), the Commission of the European Community under Contract No. HPRN-CT-2002-00322, by the U.S. Department of Energy under Contract No. DE-AC03-76-SF00098, and DOE W-7405-Eng-48, and by the National Science Foundation Grant Nos. PHY-0139294 and PHY-0500337.
References
- Goeppert-Mayer (1935) M. Goeppert-Mayer, Phys. Rev. 48, 512 (1935).
- Racah (1937) G. Racah, Nuovo Cim. 14, 322 (1937).
- Avignone et al. (2008) F. T. Avignone, S. R. Elliott, and J. Engel, Reviews of Modern Physics 80, 481 (2008).
- Rodin et al. (2006) V. Rodin, A. Faessler, F. Simkovic, and P. Vogel, Nuclear Physics A 766, 107 (2006).
- Rodin et al. (2007) V. Rodin, A. Faessler, F. Simkovic, and P. Vogel, Nuclear Physics A 793, 213 (2007).
- MEDEX Conference (2011) MEDEX Conference (2011).
- Enss and McCammon (2008) C. Enss and D. McCammon, Journal of Low Temperature Physics 151, 5 (2008).
- Booth et al. (1996) N. E. Booth, B. Cabrera, and E. Fiorini, Ann. Rev. Nucl. Part. Sci. 46, 471 (1996).
- Haller et al. (1984) E. E. Haller et al. (Plenum Press, 1984) p. 21.
- Arnaboldi et al. (2008) C. Arnaboldi et al., Phys. Rev. C 78, 035502 (2008).
- Redshaw et al. (2009) M. Redshaw, B. J. Mount, E. G. Myers, and F. T. Avignone, Phys. Rev. Lett. 102, 212502 (2009).
- Scielzo et al. (2009) N. D. Scielzo et al., Phys. Rev. C80, 025501 (2009), arXiv:0902.2376 [nucl-ex] .
- Rahaman et al. (2011) S. Rahaman, V.-V. Elomaa, T. Eronen, J. Hakala, A. Jokinen, A. Kankainen, J. Rissanen, J. Suhonen, C. Weber, and J. yst, Physics Letters B 703, 412 (2011).
- Singh (2001) B. Singh, Nuclear Data Sheets 93, 33 (2001).
- Toivanen and Suhonen (1997) J. Toivanen and J. Suhonen, Phys. Rev. C 55, 2314 (1997).
- Barabash et al. (2001) A. S. Barabash et al., The European Physical Journal A - Hadrons and Nuclei 11, 143 (2001).
- Suhonen (2000) J. Suhonen, Physics Letters B 477, 99 (2000).
- Suhonen and Aunola (2003) J. Suhonen and M. Aunola, Nuclear Physics A 723, 271 (2003).
- Arnaboldi et al. (2003) C. Arnaboldi et al., Physics Letters B 557, 167 (2003).
- Tretyak and Zdesenko (2002) V. Tretyak and Y. G. Zdesenko, Atom.Data Nucl.Data Tabl. 80, 83 (2002).
- Andreotti et al. (2011) E. Andreotti et al., Astropart. Phys. 34, 822 (2011), 1012.3266 [nucl-ex] .
- Arnold et al. (2011) R. Arnold et al. (NEMO-3 Collaboration), Phys.Rev.Lett. 107, 062504 (2011).
- Bucci et al. (2009) C. Bucci et al., The European Physical Journal A - Hadrons and Nuclei 41, 155 (2009), 10.1140/epja/i2009-10805-7.
- Arnaboldi et al. (2004) C. Arnaboldi et al., Nucl. Instrum. Meth. A518, 775 (2004).