Galaxy Disks are Submaximal
Abstract
We measure the contribution of galaxy disks to the overall gravitational potential of 30 nearly face-on intermediate-to-late-type spirals from the DiskMass Survey. The central vertical velocity dispersion of the disk stars () is related to the maximum rotation speed () as , consistent with previous measurements for edge-on disk galaxies and a mean stellar velocity ellipsoid axial ratio . For reasonable values of disk oblateness, this relation implies these galaxy disks are submaximal. We find disks in our sample contribute only 15% to 30% of the dynamical mass within 2.2 disk scale-lengths (), with percentages increasing systematically with luminosity, rotation speed and redder color. These trends indicate the mass ratio of disk-to-total matter remains at or below 50% at 2.2 even for the most extreme, fast-rotating disks ( km s-1), of the reddest rest-frame, face-on color ( mag), and highest luminosity ( mag). Therefore, spiral disks in general should be submaximal. Our results imply that the stellar mass-to-light ratio and hence the accounting of baryons in stars should be lowered by at least a factor of 3.
Subject headings:
galaxies: kinematics and dynamics — galaxies: stellar content — galaxies: halos — galaxies: spiral — galaxies: formation — galaxies: fundamental parameters1. INTRODUCTION
Rotation-curve decomposition is the primary tool for measuring the distribution of dark matter in spiral galaxy halos, but the tool is blunted by uncertainties in the mass-to-light ratio () of the luminous disk and bulge. The ‘maximum-disk hypothesis’ (van Albada & Sancisi 1986; see also Binney & Tremaine 2008) bypasses this mass-decomposition (‘disk-halo’) degeneracy. A disk contributing maximally to the gravitational potential sets a lower limit on the amount of halo dark matter in the inner regions of disk galaxies. Maximum-disk decompositions find the disk mass produces % of the observed rotation velocity at 2.2 disk scale-lengths (; Sackett 1997). Unfortunately, this hypothesis remains unproven, and there have been suggestions to the contrary based on the lack of surface-brightness dependence in the Tully-Fisher relation (TF; Tully & Fisher 1977) for a wide range of spirals (Courteau & Rix 1999; Courteau et al. 2003; Zwaan et al. 1995). Constraints on from stellar population synthesis (SPS) models are poor due to long-standing uncertainties in the low-mass end of the stellar IMF and late phases of stellar evolution (e.g., TP-AGB stars; Maraston 2005, Conroy et al. 2009).
Direct kinematic evidence for the mass contribution from spiral disks stems from a series of longslit spectroscopic studies (van der Kruit & Freeman 1984; Bottema 1993; Kregel et al. 2005) showing that the ratio of the disk stellar velocity dispersion and the maximum observed rotation speed was much lower than expected for a maximum disk. Bottema (1993) found disks contribute only % of the observed rotation speed. Most of these galaxies are viewed edge-on, however, so that the inference of disk mass requires some uncertain assumptions about the stellar velocity ellipsoid (SVE) and line-of-sight deprojection. Recent results from PNe kinematics of several nearby galaxies suggest disk-maximality may depend on Hubble type (Herrmann & Ciardullo 2009). Constraints on disk maximality from hydrodynamical modeling of observed non-axisymmetric gas flows has conflicted (cf. Weiner et al. 2001 and Kranz et al. 2003). Analyses of one gravitional-lens system (Dutton et al. 2011) and one barred, resonance-ring system (Byrd et al. 2006) indicate the disks in these two galaxies are submaximal. Observational evidence suggests disks are submaximal, but the question is unsettled.
The DiskMass Survey (DMS; Bershady et al. 2010a) breaks the disk-halo degeneracy by obtaining independent measures of the total dynamical mass and dynamical disk-mass surface density from integral-field stellar and gas kinematics of face-on, disk-dominated galaxies. Following the approach of Bottema (1993) and Kregel et al. (2005), in this letter we derive the disk maximality based on the relation between the disk vertical stellar velocity dispersion () and the disk-equatorial circular speed of the potential, making basic assumptions of disk equilibrium and a testable hypothesis about the SVE. We adopt km s-1 Mpc-1 and Vega magnitudes.
2. Data and Measurements
For 30 nearly face-on spiral galaxies covering a range in morphology, mass, color, surface brightness and scale length from our Phase-B sample (Bershady et al. 2010a), the stellar line-of-sight velocity dispersions and gas rotation curves were measured out to . Spectroscopic data in the MgI region (498-538 nm) at resolutions of were collected with the PPak integral field unit (Verheijen et al. 2004; Kelz et al. 2006) of the PMAS spectrograph (Roth et al. 2005) on the 3.5m Calar Alto telescope.111Centro Astronómico Hispano Alemán (CAHA) at Calar Alto, operated jointly by the MPIA and CSIC. Stellar velocity dispersions were measured down to km s-1 for individual fiber spectra via our data-censored cross-correlation software (DC3; Westfall et al. 2011a) using a K1 III stellar template.
The maximum rotation speed of the potential () at is derived by fitting a simple hyperbolic-tangent (tanh) model (e.g., Andersen et al. 2001) to the two-dimensional [OIII] velocity field, deprojected using inclinations () inferred from inverting the Tully-Fisher relations from Verheijen (2001) for the -band. To minimize systematic error, total magnitudes estimation matched the protocol used by Verheijen (2001), using elliptical-aperture surface-photometry of reprocessed 2MASS images (Skrutskie et al. 2006), as described in Westfall et al. (2011b; DMS-IV). Since is derived from the asymptotic velocity of the tanh model, systematic errors arise if the rotation curve is not truly flat. Inspection of each galaxy’s position-velocity diagram shows these errors to be of the same order as the formal errors from the fitting, in most cases. In Figure 1, below, we flag two exceptions: UGC 1862, which still has a rising rotation curve at the outermost point; and UGC 4458, which has a declining rotation curve after reaching due to a prominent bulge. Random errors on (7% on average) are dominated by inclination uncertainties.
The central value of the stellar velocity dispersion of the disk () is found by fitting a radial exponential function to the measurements in a radial range that shows an exponential decline (typically ), e.g., excluding the bulge region, and then extrapolating to . The exponential function is found to fit well in this radial range. Because is expected to scale with the square root of the surface density, the kinematic scale-length () is expected to be for an exponential disk of constant thickness and viewed perfectly face-on. In our fitting, we allow to be a free parameter; the implications for disk gradients are discussed in Martinsson (2011). For present purposes it suffices to state gradients are generally small.
The vertical component of the stellar velocity ellipsoid is extracted from by assuming a constant shape of the SVE and . Following Bershady et al. (2010b; DMS-II) we adopt and , where and are the radial and tangential components of the SVE. These are reasonable values given extant results for external galaxies summarized by van der Kruit & de Grijs (1999), Shapiro et al. (2003), and our own work (Westfall 2009 and DMS-IV). We may then write ; is a projection factor defined in DMS-II as a function of the SVE ratios and inclination. A typical value of is 1.1, with a 10% uncertainty. This factor dominates the error on at small radii and larger inclinations, with the largest contribution from the uncertainty in . Errors contributed by inclination uncertainties are lower but non-negligible; errors contributed by computed from the epicycle approximation are negligible. Measurement error in generally dominate at larger radii and at lower inclinations. Details of the sample, instrumental configurations, data acquisition and reduction, basic data products, and full mass decompositions are presented in Martinsson (2011).
3. Disk Maximality
For an oblate, self-gravitating, exponential disk of constant it can be shown (Freeman 1970, Casertano 1983, Kuijken & Gilmore 1989, DMS-II) that the maximum rotation speed of the disk is related to the disk central mass surface-density, , and :
| (1) |
where to excellent approximation for , and is the oblateness parameter. A comparison of to is an accurate measure of disk maximality regardless of a bulge component. The comparison also provides a good estimate of baryon maximality because occurs at where most bulges do not significantly contribute to .
For a disk in equilibrium , where parameterizes the vertical density distribution with likely values between 1.5 to 2 (exponential to isothermal distributions, respectively; van der Kruit 1988). Because we measure outside of the galaxy center, where the bulge contribution is minimal and it is plausible that the SVE is relatively constant with radius, our estimate of is well-posed. In contrast, central measurements of are contaminated by bulges, bars, and non-circular motions. For a disk embedded in a dark halo, we expect will increase for a given disk (Bottema 1993), hence the estimate is an upper limit.
Combining Equation 1 with the expression for , and normalizing to an exponential density distribution and for an oblateness of a typical disk with a 3.5 kpc scale-length (Equation 1 from DMS-II), we find the following relation between the maximum rotation speed of the disk, disk central velocity dispersion, and disk oblateness:
| (2) |
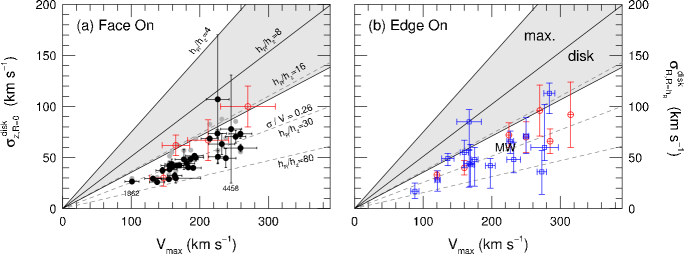
Our expectations are, then, that for a maximum disk where , there should be a linear relation between and with a slope of 0.43.
However, in Figure 1a, the distribution of versus for the DMS sample lie near , a slope well below the expected value of 0.43 for a maximum disk. The disks of our sample galaxies would be maximal if . Based on the compilation from DMS-II (e.g., see Kregel et al. 2002), this oblateness is twice as flat as any observed edge-on disk. For realistic values of , the disk-only rotation curves peak well below the measured . These galaxy disks are sub-maximal.
To test this result, we plot the uncorrected central disk velocity dispersion () as filled gray points in Figure 1a. The corrections for the SVE projection are relatively small. Even without the correction disks still appear to lie in a parameter space that is marginally sub-maximal. This is an upper limit for any reasonable SVE with and within a factor of 2 of the epicyclic value, and considering the above-mentioned impact of a dark halo on .
In Figure 1b we plot versus for the edge-on samples of Bottema (1993) and Kregel et al. (2005). As these authors state, for an exponential disk mass-density distribution of constant SVE with , . The similarity of the relation found for both edge-on and face-on samples demonstrates the accuracy of our basic assumption concerning the average SVE: If were 65% larger on average ( instead of 0.6), then the edge-on sample would be centered in the maximum-disk region of Figure 1. While this check is of primary importance for interpreting the maximality of edge-on disks, it also confirms our second-order corrections to for face-on samples. A corollary, important below, is that the disk-oblateness measurements of these edge-on samples, used for mass-estimates of our face-on sample, are likely also an accurate application.
4. Why we expect all disks are submaximal
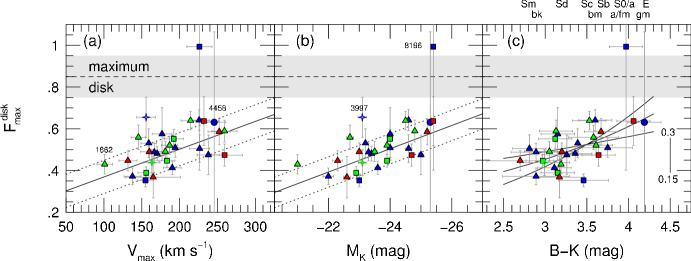
We quantify disk-maximality as , using Equation 2 for and Equation 1 from DMS-II for . Figure 2 shows of the DMS sample versus maximum rotation speed, -band luminosity (), and color (velocity and luminosity are tightly correlated via ). We adjust for the 3 galaxies in our sample earlier than Sb or later than Scd, as discussed in DMS-II. Our value of for UGC 463 agrees well within the errors to the detailed calculation presented in DMS-IV. For the DMS sample (rms), equivalent to % by mass for the disk within , ignoring details of oblateness (the range is marked in Figure 2c). In contrast to Herrmann & Ciardullo (2009), we find little dependence of on morphology (Figure 2c). There is also no significant trend of with disk central surface-brightness [ mag arcsec-2, ranging from 16 to 20 mag arcsec-2; mag arcsec-2 corresponds to a ‘Freeman’ disk for mag], bulge-to-disk ratio (, ranging from 0 to 0.75), or bar classification. As Figure 2 shows, however, galaxies with higher rotation speed (see also Kranz et al. 2003), greater near-infrared luminosity, and redder color are significantly more maximal. Adopting a regression model with intrinsic scatter (Akritas & Bershady 1996), we find km s and , including bootstrap errors. The trend is consistent with disk mass-fractions doubling as (total mass)1/2.
We have modeled the trend with color assuming galaxies have a constant mean surface-brightness with color, and estimating changes in with color based on all SPS models from Bell & de Jong (2001), Portinari et al. (2004) and Zibetti et al. (2009). Salient model variations include treatment of chemical enrichment, star-formation history, and stellar evolutionary tracks (with varying amounts of TP-AGB stars). Different mass zeropoints (e.g., IMFs) are irrelevant here since we normalize the models at at . The curves in Figure 2c show the median and extrema of these model predictions for relative changes in with color. The trends are upper limits since they assume dynamical mass is equivalent to stellar mass, and discount contributions from disk gas.
The dependencies of on color, luminosity and rotation speed are such that even at extrema (maxima) in each quantity, the extrapolated value of . For example, we have labeled the colors for different Hubble and spectral types (Bershady 1995). Our sample spans essentially all of the color range. This means that even the earliest-type, fastest-rotating, reddest disk should still be submaximal on average. Indeed, the most maximal disk from Herrmann & Ciardullo (M94; 2009) has a value of . Calculations for our sample assume , i.e., an exponential disk vertical density distribution. If, for example, disk vertical density distributions are isothermal, then our estimates of decrease by 15%; mass-fractions decrease by 25%.
These results have significant implications for the IMF, stellar evolution, cosmological accounting of baryons, and the formation of galaxy disks. Since a truncated IMF is already required to match for a maximal disk (Bell & de Jong 2001), substantially sub-maximal disks require either uncomfortably top-heavy IMFs, or validates recent suggestions of a surfeit of luminous, low-mass stars (e.g., TP-AGB). A quantitative assessment of this surfeit is forthcoming. Similarly, current accounting of the distribution of stellar mass in cosmological volumes is based on an calibration that either assumes disks are maximal, or agrees with such a calibration (e.g., Li & White 2009, McGaugh et al. 2010). These stellar mass estimates should be lowered by at least a factor of 3 for disks, since represents the total dynamical mass, not just stellar mass. For example, the stellar mass of the disk of UGC 463 is only 60% of the total disk dynamical mass (DMS-IV). Unless the provocative claim for high in elliptical cores (van Dokkum & Conroy 2011) is confirmed and shown to be more wide-spread, our downward revision of is applicable to cosmological samples. Finally, galaxy formation models must reproduce accurate scaling-relations and their scatter (e.g., total mass to luminosity) in the context of submaximal disks. This submaximality must correlate with total mass, luminosity and stellar population, balancing trends of baryon loss from feedback with changes in angular momentum that, by our reckoning, on average must decrease threefold from maximum-disk estimates.
Research was supported by grants NSF/AST-9618849, 997078, 0307417, 0607516, 1009491; NSF/OISE-0754437; Spitzer GO-30894; NWO/614.000.807; LKBF and The Netherlands Research School for Astronomy and U. Wisconsin Ciriacks Faculty Fellowship in Letters & Science.
References
- (1)
- (2) Akritas, M. G., & Bershady, M. A. 1996, ApJ, 470, 706
- (3)
- (4) Andersen, D. R., Bershady, M. A., Sparke, L. S., Gallagher, J. S., Wilcots, E. M. 2001, ApJ, 551, L131
- (5)
- (6) Bell, E. F., & De Jong, R. S. 2001, ApJ, 550, 212
- (7)
- (8) Bershady M. A. 1995, AJ, 109, 87
- (9)
- (10) Bershady M. A., Verheijen M. A. W., Swaters R. A., Andersen D. R., Westfall K. B., & Martinsson T. 2010a, ApJ, 716, 198
- (11)
- (12) Bershady M. A., Verheijen M. A. W., Westfall K. B., Andersen D. R., Swaters R. A., & Martinsson T. 2010b, ApJ, 716, 234
- (13)
- (14) Binney, J., & Tremaine, S. 2008, Galactic Dynamics (Princton: Princeton Univ. Press)
- (15)
- (16) Bottema R., 1993, A&A, 275, 16
- (17)
- (18) Byrd, G. G., Freeman, T., Buta, R. J. 2006, ApJ, 131, 1377
- (19)
- (20) Casertano, S. 1983, MNRAS, 203, 735
- (21)
- (22) Conroy, C., Gunn, J. E., White, M. 2009, ApJ, 699, 486
- (23)
- (24) Courteau, S., Andersen, D. R., Bershady,M. A., MacArthur, L. A., & Rix, H.-W. 2003, ApJ, 594, 208
- (25)
- (26) Courteau, S., & Rix, H.-W. 1999, ApJ, 513, 561
- (27)
- (28) Dutton, A. A., et al. 2011, astro-ph/1101.1622
- (29)
- (30) Freeman K. C., 1970, ApJ, 160, 811
- (31)
- (32) Herrmann, K. A., & Ciardullo, R. 2009, ApJ, 705, 1686
- (33)
- (34) Kelz A. et al. 2006, PASP, 118, 129
- (35)
- (36) Kranz, T., Sylz, A., & Rix, H.-W. 2003, ApJ, 586, 143
- (37)
- (38) Kregel M., van der Kruit P. C., & de Grijs R., 2002, MNRAS, 334, 646
- (39)
- (40) Kregel M., van der Kruit P. C. & Freeman K. C., 2005, MNRAS, 358, 503
- (41)
- (42) Kuijken, K., & Gilmore, G. 1989, MNRAS, 239, 571
- (43)
- (44) Li, C., & White, S. D. M. 2009, MNRAS, 398, 2177
- (45)
- (46) Maraston, C. 2005, MNRAS, 362, 799
- (47)
- (48) Martinsson T. 2011, PhD Thesis, Rijksuniversiteit, Groningen
- (49)
- (50) McGaugh, S. S., Schombert, J. M., de Blok, W. J. G., & Zagursky, M. 2010, ApJ, 708. L14
- (51)
- (52) Portinari, L., Sommer-Larsen, J., & Tantalo, R. 2004, MNRAS, 347, 691
- (53)
- (54) Roth M., Kelz A., Fecher et al. 2005, PASP, 117, 620
- (55)
- (56) Sackett P. D., 1997, ApJ, 483, 103
- (57)
- (58) Shapiro, K., Gerssen, J., & van der Marel, R. P. 2003, AJ, 126, 2707
- (59)
- (60) Skrutskie, M. F., et al. 2006, AJ, 131, 1163
- (61)
- (62) van Albada T. S. & Sancisi R. 1986, RSPTA, 320, 447
- (63)
- (64) van der Kruit, P. C. 1988, A&A, 192, 117
- (65)
- (66) van der Kruit, P. C., & Freeman, K. C. 1984, ApJ, 278, 81
- (67)
- (68) van der Kruit, P. C., & de Grijs, R. 1999, A&A, 352, 129
- (69)
- (70) van Dokkum, P. & Conroy, C. 2011, ApJ, 735, L13
- (71)
- (72) Verheijen M. A. W., 2001, ApJ, 563, 694
- (73)
- (74) Verheijen M. A. W., Bershady M. A., Andersen D. R., Swaters R. A., Westfall K., Kelz A., Roth M. M., 2004, AN, 325, 151
- (75)
- (76) Weiner, B. J., Sellwood, J. A., & Williams, T. B. 2001, ApJ, 546, 931
- (77)
- (78) Westfall, K. B. 2009, PhD thesis, Univ. Wisconsin
- (79)
- (80) Westfall K. B., Bershady M. A., Verheijen M. A. W., 2011a, ApJS, 193, 21
- (81)
- (82) Westfall K. B., Bershady M. A., Verheijen M. A. W., Andersen, D. R., Martinsson, T. P. K., Swaters, R. A., Schechtman-Rook, A. S. 2011b, ApJ, submitted
- (83)
- (84) Zwaan, M. A., van der Hulst, J. M., de Blok, W. J. G., & McGaugh, S. S. 1995, MNRAS, 273, L35
- (85)
- (86) Zibetti, S., Charlot, S., & Rix, H.-W. 2009, MNRAS, 400, 1181
- (87)