Herschel Observations of the T Cha Transition Disk: constraining the outer disk properties
Abstract
T Cha is a nearby (d 100 pc) transition disk known to have an optically thin gap separating optically thick inner and outer disk components. Huélamo et al. (2011) recently reported the presence of a low-mass object candidate within the gap of the T Cha disk, giving credence to the suspected planetary origin of this gap. Here we present the Herschel photometry (70, 160, 250, 350, and 500 m) of T Cha from the “Dust, Ice, and Gas in Time” (DIGIT) Key Program, which bridges the wavelength range between existing Spitzer and millimeter data and provide important constraints on the outer disk properties of this extraordinary system. We model the entire optical to millimeter wavelength spectral energy distribution (SED) of T Cha (19 data points between 0.36 and 3300 m without any major gaps in wavelength coverage). T Cha shows a steep spectral slope in the far-IR, which we find clearly favors models with outer disks containing little or no dust beyond 40 AU. The full SED can be modeled equally well with either an outer disk that is very compact (only a few AU wide) or a much larger one that has a very steep surface density profile. That is, T Cha’s outer disk seems to be either very small or very tenuous. Both scenarios suggest a highly unusual outer disk and have important but different implications for the nature of T Cha. Spatially resolved images are needed to distinguish between the two scenarios.
Subject headings:
circumstellar matter — protoplanetary disks — submillimeter: planetary systems — planetary systems: planet-disk interactions — stars: individual (T Cha)1. Introduction
Transition disks were first identified by the Infrared Astronomical Satellite as objects with little or no excess emission at 10 m and a significant excess at 10 m (Strom et al. 1989). This broad definition encompasses a wide range of SED morphologies (Najita et al. 2007). T Cha belongs to a subclass of transition disks known as cold disks, which are characterized by a steep rise in the SED between 10 and 30 m (Brown et al. 2007; Merín et al. 2010). It is now well established, from both SED modeling and direct (sub)millimeter imaging, that the peculiar SED shapes of cold disks are due to the presence of large inner holes or gaps in their dusty disks. Inner holes can be produced by a number of processes, including grain growth, photoevaporation, and dynamical interactions with (sub)stellar or planetary mass companions (see Williams Cieza, 2011 for a recent review). However, objects such as T Cha, LkCa 15, and UX Tau are believed to have an optically thick inner disk within a much larger inner hole (Olofsson et al. 2011, Espaillat et al. 2010). Optically thin gaps separating optically thick inner and outer disk components are difficult to explain by anything other than the dynamical interaction of substellar or planetary mass objects embedded within the disk. The discovery of what seems to be either a young planet or a brown dwarf surrounded by a significant amount of dust within the gap of the T Cha disk (Huélamo et al. 2011) supports the suspected planetary origin of the gap. Detailed studies of the properties of the T Cha disk thus become highly desirable to further our understanding of protoplanetary disk evolution and planet formation. Using Spitzer photometry and spectroscopy, Brown et al. (2007) first modeled T Cha with an inner disk extending from 0.08 to 0.2 AU and an outer disk extending from 15 to 300 AU. More recently, Olofsson et al. (2011) simultaneously modeled the SED of T Cha and near-IR interferometric observations obtained with the AMBER instrument at the Very Large Telescope Interferometer (VLTI; Scholler 2007). They spatially resolved the narrow inner dusty disk and constrained its inner edge to be 0.1 AU from the star.
Here we present the Herschel photometry (at 70, 160, 250, 350, and 500 m) of T Cha and model its entire optical to millimeter wavelength SED. We focus our analysis on the properties of the outer disk (i.e., beyond the gap), which is the region that is both the best probed by Herschel data and the least constrained by previous studies.
2. Observations
2.1. Herschel observations and data reduction
We obtained far-IR and submillimeter wavelength photometry for T Cha as part of the DIGIT Open Time Herschel Key Program using both the Photodetector Array Camera and Spectrometer (PACS, 70 and 160 m, Poglitsch et al. 2010) and the Spectral and Photometric Imaging Receiver (SPIRE, 250, 350 and 500 m, Griffin et al. 2010). The PACS observations (OBS ID = 1342209063) were obtained on November 5th, 2010, using the Mini Scan Map mode, a repetition factor of 3, and a scan angle of 70 degrees. Similarly, the SPIRE observations (OBS ID = 1342203636) were taken on August 24th, 2010, using the Small Scan Map mode, and a repetition factor of 3. Both the PACS and SPIRE data were processed using HIPE (Herschel Interactive Processing Environment; Ott et al. 2010) version 7.1. The PACS beam sizes at 70, and 160 m are 5.5′′ and 11′′, and the data were resampled to 1′′ and 2′′ pixel images, respectively. SPIRE beam sizes at 250, 350 and 500 m are 18.1, 25.2 and 36.6′′, respectively, and the images were resampled to 6′′, 10′′, and 14′′ pixel images, respectively.
T Cha was detected with good signal to noise ( 15-50) at all PACS and SPIRE wavelengths. PACS and SPIRE fluxes were derived with a psf-fitting routine essentially identical to the c2dphot software used for the c2d Spitzer Legacy Program (Evans et al. 2007). We used the empirical psf’s posted by the NASA Herschel Science Center111https://nhscsci.ipac.caltech.edu/sc/index.php/ and found that they gave a good match to the actual images of T Cha. In addition, we checked that aperture photometry gave similar results and assigned the final uncertainties based on the 10 and 15 error estimated for PACS and SPIRE absolute photometry, respectively. We also added an additional 5 uncertainty to reflect incomplete knowledge of the psf and the agreement between the psf-fitting and the aperture photometry. The resulting Herschel photometry for T Cha is listed in Table 1.
2.2. Photometry data from the literature
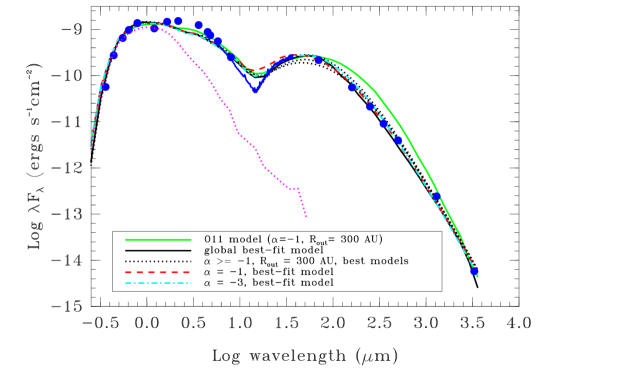
In order to construct the full SED of T Cha, we collected optical, near-IR, mid-IR, and mm wavelength photometry from the literature, which are also listed in Table 1. The full optical to mm wavelength SED for T Cha is shown in Figure 1. There are now a total of 19 photometry points without major gaps in wavelength coverage between 0.36 and 3300 m. In addition to the above photometry, the T Cha SED is well sampled by a Spitzer-IRS spectrum, covering the 5.2 to 38 m region (Brown et al. 2007). The sharp dip in the SED around 15 m indicates the presence of a wide gap in the disk.
3. Disk model
The starting point of our study is the model presented by Olofsson et al. (2011, O11 hereafter). Following O11, we use the Monte Carlo radiative transfer code MCFOST (Pinte et al. 2006; 2009). We parameterize the structure of the T Cha disk with the following parameters: the inner and outer radii (Rin and Rout, respectively), the index for the surface density profile ( (r) = (r/r0)α ) and a disk scale height assuming a vertical gaussian distribution (exp[z2/2H(r)2]), appropriate for a disk in hydrostatic equilibrium. The disk’s flaring is described by a power-law determining the scale height as a function of the radius ( = H0(r/r0)β). The dust content is described by a differential power-law for the grain size distribution (d(a) a pd), between the minimum (amin) and maximum (amax) grain sizes. The total mass of dust in the disk with grain sizes between amin and amax is given by the Mdust parameter. Each of the above parameters can be defined independently for the inner and outer disk components, which are separated by a wide gap.
The main goal of this Letter is to investigate the constraints the Herschel data provide on the outer disk properties of T Cha. As the Herschel data give no new information on the inner regions, we adopt the inner disk parameters from O11, which are listed in Table 2, as fixed values. The stellar parameters for T Cha are also taken from O11 and are listed in Table 2 as well. We also fix the minimum grain size for the outer disk and its inclination. We are thus left with 7 free model parameters, all of which are related to the outer disk: Rin, Rout, , , amax, Mdust, and H50 (the scale height at 50 AU). Motivated by the lack of 10 m silicate emission in the Spitzer-IRS spectra of T Cha, O11 adopted for the inner disk a mixture of astro silicates (Draine Lee 1984) and amorphous carbon (Zubko al. 1996) with a mass ratio of 4:1 between silicate and carbon. For simplicity, we adopt the same silicate and carbon mix for the dust composition of the outer disk, but remind the reader that disk parameters derived from SED fitting are strongly dependent on the choice of dust properties. Although discussing the dependence of each parameter on dust composition is beyond the scope of this Letter, we have verified that our main conclusions remain unchanged if pure astro silicate grains are adopted for the outer disk.
3.1. Model grid and best-fit models
In order to constrain the parameter space consistent with the observed T Cha SED, we ran a grid of models varying the 7 free parameters in our model setup. The values sampled by the grid are listed in Table 3. The parameters and H50 are sampled linearly, while Rin, and Rout, , amax, and Mdust are sampled logarithmically. The number of values per parameter range from 3 to 10 and the total number of models amount to 126000. The parameters of the best-fit model (i.e., with the minimum 2) are also listed in Table 3. The global best-fit model so derived for the outer disk of T Cha is a narrow ring with an inner radius of 18 AU and a width of only 2 AU. This narrow ring remains optically thick even at (sub)millimeter wavelengths, which explains the very large mass that is allowed by the model. Its SED is shown as a solid black line in Fig. 1.
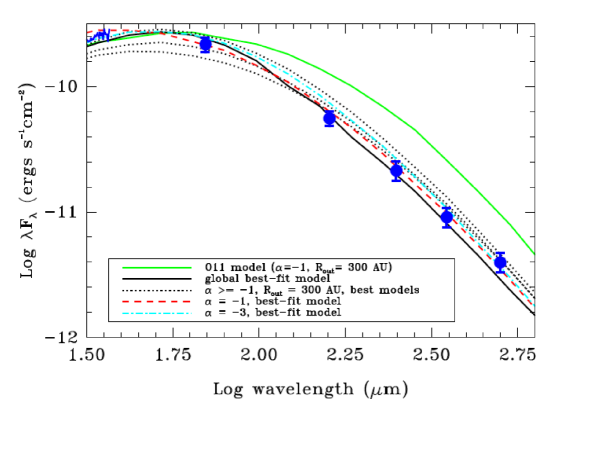
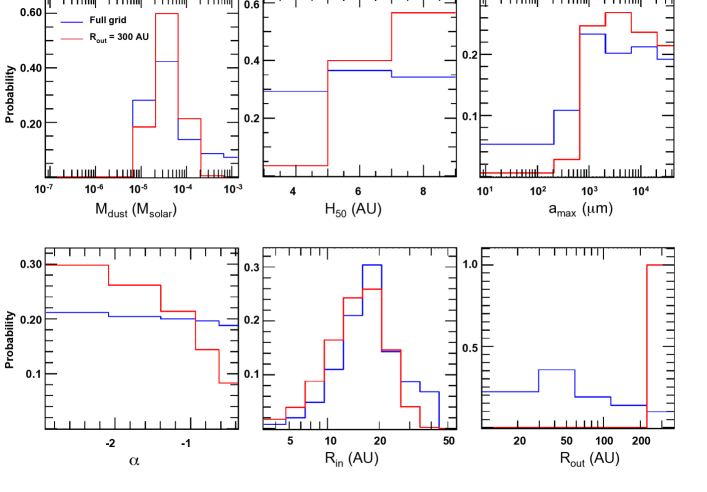
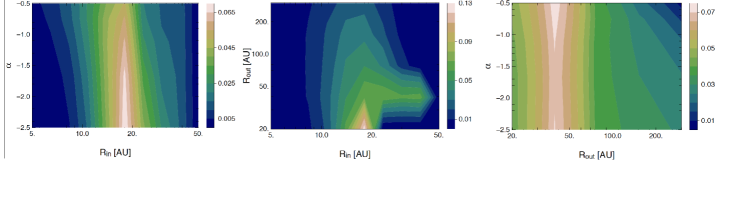
Since SED modeling is known to be highly degenerate, the best-fit model is unlikely to be a unique solution. We therefore adopt the Bayesian method (Press et al. 1992; Pinte et al. 2008) to calculate the probability of different values for each parameter given the available data. We assume that we have no prior knowledge on the model parameter, which implies that the relative probability of a given model is proportional to exp. All probabilities are normalized so the sum of all the probabilities of the models in the grid is equal to 1. The top two panels in Fig. 2 show the probability that each parameter takes a given value from the grid, calculated by summing over the probabilities of all the other parameters. Clearly, the Mdust, amax, and Rin parameters are much better constrained than the others. The lower panels in Fig. 2 show the joint probabilities of the Rin, Rout, and parameters. Models with Rin 18 AU and slightly larger Rout values are clearly favored to best reproduce our observations. There are a large number of narrow ring models that can reproduce the observed T Cha SED relatively well. The best-fit model is an instance of a large family of such models. This can be understood considering that the SED of a narrow ring is little sensitive to parameters such as , , or even Mdust and amax. Wider rings are also allowed, but they require fine-tuning of other parameters (see for example the red dashed line in in Fig. 1 and the model in Table 3) and thus appear as less likely models in the joint probability plots. Large disks (Rout 150 AU) with shallow surface density profiles ( -1) result in a poor fit to the SED. This can be seen in Fig. 2 in the dark region in the upper right corner of the vs Rout plot (lower row) and in the red histogram in the probability distribution (middle row). We find that all such models result in far-IR Herschel colors that are much redder than observed (see bottom panel in Fig. 2). In other words, all disk models with a shallow surface density profile () and a large outer radius (e.g., 150-300 AU) either under-predict the observed 30 and 70 m fluxes and/or over-predict the 250 and 350 m fluxes. This is not surprising considering that a narrow ring around T Cha (like the best-fit model) would be “missing” most of the cool material emitting at 250 and 350 m expected for a large disk with a relatively shallow surface density profile. However, a narrow ring is not the only way to reproduce the far-IR Herschel colors. We also find that the outer disk can be arbitrarily large (e.g., Rout = 300 AU) as long as the surface density profile is sufficiently steep (e.g., ) to quickly reduce the amount of dust at large radii. See for example the alternative model in Table 3, corresponding to the light blue dot-dashed line in Fig. 1. This alternative model falls outside of our parameter grid, but illustrates well the strong degeneracy between the outer radius and the surface density profile of the disk. We note that while the and models have very different Rout values, their Mdust, Rin, amax, , and H50 parameters are much more similar.
Independently of the probability space they occupy in Fig. 2, the 3 models discussed above and listed in Table 3 are fully consistent with all the available data and, individually, can be considered to be equally good descriptions of the T Cha disk. One feature that our models cannot reproduce well is the pronounced V-shape of the Spitzer-IRS spectra around 15 m. The models also underestimate the 2.2 and 3.6 m excesses from the inner disk, which parameters are heavily driven by near-IR interferometry observations. Near-IR variability makes it difficult to simultaneously fit multi-epoch observations in this spectral region (see O11 for a detailed description of the inner disk modeling). Because the inner disk is optically thick, the exact geometry of the inner disk might affect some of the outer disk parameters like H50 and Rin (Mulders et al. 2010), but is unlikely to play any role on the values of and Rout, the key parameters in this study.
4. Discussion
The results from the previous section show that T Cha SED can be modeled with multiple combinations of parameter values. The most likely models can be divided into two broad categories: narrow rings and wider disks with steep surface density profiles. Both families of models suggest a highly unusual outer disk and have important but different implications for the nature of T Cha. A narrow ring would strongly suggest that the outer disk has been truncated by the dynamical interaction of a companion, as is known to be the case in the HD 98800B and Hen 3-600A multiple systems, which have outer radii of only 10 and 20 AU, respectively (Andrews et al. 2010). Very deep imaging of T Cha (Chauvin et al. 2010; Vicente et al. 2011) rule out any stellar companion that could be responsible for the truncation of the outer disk, unless its projected separation is currently less than 0.1′′ (10 AU). Furthermore, recent aperture masking observations by Huélamo et al. (2011) only report a very low-mass companion candidate (either a young planet or a brown dwarf) with a projected separation of 6.20.7 AU. Since this object is the most likely cause of the inner cavity (Rin 10-20 AU based on the SED modeling), its physical separation must be Rin. Any object truncating the outer disk thus must be substellar or planetary in nature.
We speculate that the recently reported companion to T Cha could potentially also provide the explanation for the models with . These unusual values would imply that the disk material is highly concentrated toward the inner edge of the outer disk (i.e., that material is accumulating at the outer edge of the gap, at 15 AU). As a reference, in the canonical Minimum Mass Solar Nebula (Weidenschilling, 1977). T Cha’s outer disk is relatively massive but shows little or no accretion onto the star (Alcala et al. 1993, Schisano et al. 2009). The transport of angular momentum and material across the outermost part of the disk should not be affected by the presence of the low-mass object, but when circumstellar material reaches the outer edge of the gap, it can be accreted by the low-mass object, channeled toward the inner disk, or accumulated at the gap’s edge (Lubow & D’Angelo, 2006). The dynamical interaction between a gas-rich disk and a planetary mass object is a complex hydrodynamic problem that depends on the mass and location of the planet as well as on the properties of the disk (viscosity, disk scale height, etc), but an value of would suggest that it could have an important effect on the surface density of the outer disk. Recent 3-D hydrodynamic models of planet-disk interactions show the accumulation of mm-sized grains in the pressure maxima of the gas caused by the spiral density waves triggered by the planet (Fouchet et al. 2010). This implies that the density enhancement at the edge of the gap of the large grains traced by Herschel could be even larger than it is for the gas. However, given the degeneracy between and Rout, the dynamical effect of the companion on the disk cannot be tested without spatially resolved observations. Our models show that, given the SED data alone and without knowing Rout, the value of for the dust disk could be anywhere between and .
5. Conclusions
New Herschel observations of T Cha reveal a steep spectral slope between 70 and 350 m (i.e., very blue far-IR Herschel colors compared to a “normal disk”). The steeply decreasing far-IR SED is not due to a lack of large grains. In fact, the (sub)millimeter wavelength colors are rather red, and grains larger than 1 mm are needed to simultaneously fit the Herschel and 1.3 and 3.3 mm fluxes. Instead, we find basically two ways to reproduce the observed far-IR Herschel colors: making the outer disk very small (by reducing the value of Rout) or very tenuous (by reducing the value of the surface density profile, ). Both types of models contain little or no dust beyond 40 AU, but each family has a different astrophysical implication: either T Cha has a small outwardly truncated disk or material is accumulating at the inner edge of the gap. Resolved images are mandatory to break the degeneracy between , and the inner and outer disk radii. The Atacama Large Millimeter/submillimeter Array (ALMA) will have both the resolution and sensitivity needed to directly measure the width of the disk as well as its surface density profile and distinguish between the two interpretations. The former result would encourage even deeper searches for a wide-separation low-mass companion (most likely a Jovian planet). The latter scenario would have important implications for the dynamical interaction between the T Cha disk and the recently reported companion as well as on any subsequent planet formation in its highly peculiar outer disk.
References
- Alcala et al. (1993) Alcalá, J. M., Covino, E., Franchini, M., Krautter, J., Terranegra, L., & Wichmann, R. 1993, A&A, 272, 225
- Andrews et al. (2010) Andrews, S. M., Czekala, I., Wilner, D. J., Espaillat, C., Dullemond, C. P., & Hughes, A. M. 2010, ApJ, 710, 462
- Brown et al. (2007) Brown, J. M., et al. 2007, ApJ, 664, L107
- Chauvin et al. (2010) Chauvin, G., et al. 2010, A&A, 509, A52
- Cieza et al. (2010) Cieza, L. A., et al. 2010, ApJ, 712, 925
- Draine Lee (1984) Draine, B. T., & Lee, H. M. 1984, ApJ, 285, 89
- Espaillat et al. (2010) Espaillat, C., et al. 2010, ApJ, 717, 441
- (8) Evans, N. J., II, 2007, Final Delivery of Data from the c2d Legacy Project: IRAC and MIPS (Pasadena: SSC )
- Fouchet et al. (2010) Fouchet, L., Gonzalez, J.-F., & Maddison, S. T. 2010, A&A, 518, A16
- Griffin et al. (2010) Griffin, M. J., et al. 2010, A&A, 518, L3
- Huélamo et al. (2011) Huélamo, N., Lacour, S., Tuthill, P., et al. 2011, A&A, 528, L7
- Lommen et al. (2007) Lommen, D., et al. 2007, A&A, 462, 211
- Lubow & D’Angelo (2006) Lubow, S. H., & D’Angelo, G. 2006, ApJ, 641, 526
- Merín et al. (2010) Merín, B., et al. 2010, ApJ, 718, 1200
- Mulders et al. (2010) Mulders, G. D., Dominik, C., & Min, M. 2010, A&A, 512, A11
- Najita et al. (2007) Najita, J. R., Strom, S. E., & Muzerolle, J. 2007, MNRAS, 378, 369
- Olofsson et al. (2011) Olofsson, J., et al. 2011, A&A, 528, L6
- Ott et al. (2010) Ott, S., Science Centre, H., & Space Agency, E. 2010, AA, 528, L6
- Pinte et al. (2006) Pinte, C., Ménard, F., Duchêne, G., & Bastien, P. 2006, A&A, 459, 797
- Pinte et al. (2008) Pinte, C., et al. 2008, A&A, 489, 633
- Pinte et al. (2009) Pinte, C., Harries, T. J., Min, M., Watson, A. M., Dullemond, C. P., Woitke, P., Ménard, F., & Durán-Rojas, M. C. 2009, A&A, 498, 967
- Poglitsch et al. (2010) Poglitsch, A., et al. 2010, A&A, 518, L2
- Press et al. (1992) Press, W. H., Teukolsky, S. A., Vetterling, W. T., & Flannery, B. P. 1992, Cambridge: University Press, —c1992, 2nd ed.,
- Schechter et al. (1993) Schechter, P. L., Mateo, M., & Saha, A. 1993, PASP, 105, 1342
- Schisano et al. (2009) Schisano, E., Covino, E., Alcalá, J. M., Esposito, M., Gandolfi, D., & Guenther, E. W. 2009, A&A, 501, 1013
- (26) Scholler, M. 2007, New Astronomy Review, 51, 628
- Skrutskie et al. (2006) Skrutskie, M. F., et al. 2006, AJ, 131, 1163
- Strom et al. (1989) Strom, K. M., Strom, S. E., Edwards, S., Cabrit, S., & Skrutskie, M. F. 1989, AJ, 97, 1451
- Vicente et al. (2011) Vicente, S., et al. 2011, arXiv:1107.3141
- Weidenschilling (1977) Weidenschilling, S. J. 1977, Ap&SS, 51, 153
- Williams & Cieza (2011) Williams, J. P., & Cieza, L. A. 2011, ARA&A, 49, 67
- Zubko et al. (1996) Zubko, V. G., Mennella, V., Colangeli, L., & Bussoletti, E. 1996, MNRAS, 282, 1321
| Wavelength | Flux | Error | Telescope | Referencea |
|---|---|---|---|---|
| (m) | (mJy) | (mJy) | ||
| 0.36 | 6.80e+00 | 10 | ESO 50 cm | 1 |
| 0.44 | 4.03e+01 | 10 | ESO 50 cm | 1 |
| 0.55 | 1.12e+02 | 10 | ESO 50 cm | 1 |
| 0.64 | 2.01e+02 | 10 | ESO 50 cm | 1 |
| 0.79 | 3.61e+02 | 10 | ESO 50 cm | 1 |
| 1.2 | 4.20e+02 | 10 | 2MASS | 2 |
| 1.6 | 8.05e+02 | 10 | 2MASS | 2 |
| 2.2 | 1.10e+03 | 10 | 2MASS | 2 |
| 3.6 | 1.49e+03 | 10 | Spitzer | 3 |
| 4.5 | 1.32e+03 | 10 | Spitzer | 3 |
| 5.8 | 1.07e+e3 | 10 | Spitzer | 3 |
| 8.0 | 6.66e+02 | 10 | Spitzer | 3 |
| 70 | 5.06e+03 | 15 | Herschel | 4 |
| 160 | 2.97e+03 | 15 | Herschel | 4 |
| 250 | 1.78e+03 | 20 | Herschel | 4 |
| 350 | 1.06e+03 | 20 | Herschel | 4 |
| 500 | 6.60e+02 | 20 | Herschel | 4 |
| 1300 | 1.05e+02 | 15 | SEST | 5 |
| 3300 | 6.40e+00 | 15 | ATCA | 5 |
Note. — aReferences: (1) Alcalá et al. 1997; (2) Skrutskie et al. (2006); (3) Brown et al. (2007); (4) this work; (5) Lommen et al. (2007)
| Parameter | Adopted value |
|---|---|
| Stellar Teff [K] | 5400 |
| Stellar radius [R⊙] | 1.3 |
| Stellar mass [M⊙] | 1.5 |
| Distance [pc] | 100 |
| Inclination [deg] | 60 |
| Grain size distribution slope, p | 3.5 |
| Inner disk Rin [AU] | 0.13 |
| Inner disk Rout [AU] | 0.17 |
| Inner disk Mdust [M⊙] | 10-9 |
| Inner disk amin [m ] | 0.1 |
| Inner disk amax [m] | 10 |
| Outer disk amin [m ] | 0.01 |
| Parameter | values sampled by grid | best-fit model | = 1 modela | = 3 modela |
|---|---|---|---|---|
| Surf. density prof. () | 1 | 3 | ||
| Rin [AU] | 4, 5.5, 7.5, 11, 15, 18, 25, 30, 40, 50 | 18 | 10.5 | 15 |
| Rout [AU] | 20, 40, 80, 150, 300 | 20 | 30 | 300 |
| Mdust [M⊙] | (10, 3, 1, 0.3, 0.1, 0.01,0.001)10-4 | 1.010-3 | 2.010-5 | 1.810-5 |
| Flaring index () | 1.00, 1.07, 1.15 | 1.15 | 1.1 | 1.1 |
| H50 (H at 50 AU) [AU] | 4, 6, 8 | 4 | 5 | 6 |
| amax [mm] | 0.01, 0.03, 0.1, 0.3, 1, 3, 10, 30 | 3 | 3 | 3 |
Note. — a The best-fit models fixing the value of to or and fine-tuning the other parameters by hand guided by the results from the grid.