The Temperature Structure of Be Star Disks in the Small Magellanic Cloud
Abstract
The temperature structure of Be star circumstellar disks at the sub-solar metallicity appropriate to the Small Magellanic Cloud (SMC) is investigated. It is found that for central stars of the same spectral type, Be star disks in the SMC are systematically hotter by several thousand degrees compared to Milky Way (MW) disks with the same density structure. For early spectral types (B0e – B3e), this results in systematically smaller H equivalent widths for Be stars in the SMC. The implication of this result on Be star frequency comparisons between MW and SMC clusters is shown to be a 5 – 10% lowering of the detection efficiency of Be stars in SMC clusters. These calculations are also compared to the known H equivalent width distributions in the MW and SMC. For the MW, reasonable agreement is found; however, for the SMC, the match is not as good and systematically larger Be star disks may be required.
1 Introduction
Be stars are defined observationally as non-supergiant B stars that have, or have had in the past, emission detected in the Balmer series of hydrogen, most notably in H (Slettebak, 1988). The emission is thought to arise from a thin, equatorial disk of gas surrounding the central star (Porter & Rivinius, 2003). This picture is consistent with many other properties of Be stars, such as an excess of infrared radiation (Coté & Waters, 1987), linear continuum polarization (McLean & Brown, 1978; Poeckert et al., 1979), and interferometric observations that directly resolve the disks (Quirrenback et al., 1997; Tycner et al., 2005).
In the Milky Way about 17% of all non-supergiant B stars are Be stars, although the fraction varies widely with spectral type, reaching a maximum of % at B1 (Zorec & Briot, 1997). Why some B stars, and not others, become Be stars is currently unclear. Rapid rotation of the central B star seems to play a key role (Porter & Rivinius, 2003), but details are still lacking as a definitive determination of the actual rotation rates of the central stars is complicated by the potential effects of gravitational darkening (Townsend et al., 2004; Cranmer, 2005; Frémat et al., 2005).
Also unclear is the exact mechanism(s) that creates Be star disks. Keplerian rotation, now established for Be star disks (Hummel & Vrancken, 2000; Oudmaijer et al., 2008), suggests viscous disks as the correct physical model (Lee et al., 1991; Porter, 1999), but how material is feed into the inner edge of the disk is unknown (Cranmer, 2009; Krtic̆ka et al., 2011). It is possible pulsation plays a critical role (Cranmer, 2009), and there is tantalizing observation evidence supporting this view (Rivinius et al., 1998; Huat et al., 2009). The role of binarity in the Be phenomena is unclear (Porter & Rivinius, 2003), although the majority of Be stars do not seem to be the result of binary evolution (Van Bever & Vanbeveren, 1997). In this current work, we consider only single, isolated Be stars.
Key to understanding the factors that produce the Be phenomenon are cluster studies which allow ages to be assigned to the individual Be stars. Then any trends with evolutionary status can be examined. There have been claims either that the Be phenomenon occurs primarily in the later half of the main sequence (Fabregat & Torrejón, 2000; Fabregat & Gutiérrez-Soto, 2005; McSwain & Gies, 2005; Martayan et al., 2006) or throughout the entire main sequence (Keller et al., 1999; Martayan et al., 2007a). Other studies find Be stars both in very young clusters, Myr, and an enhancement in older clusters, Myr (Wisniewski & Bjorkman, 2006; Mathew et al., 2008), suggesting two effects at work: some Be stars are born as rapid rotators while others become rapid rotators during main sequence evolution due to the internal redistribution of angular momentum (Ekström et al., 2008).
Be stars are also detectable in open clusters in the Large and Small Magellanic Clouds (LMC and SMC), and this allows investigation of the role of metallicity in the Be phenomena. The solar metallicity is while the metallicity of the LMC is about and the SMC, (Maeder et al., 1999). The trend of the fraction of Be stars in a cluster with metallicity seems clear from many studies: the fraction of Be stars tends to rise with decreasing metallicity (Maeder et al., 1999; Wisniewski & Bjorkman, 2006; Martayan et al., 2006, 2007a, 2010). Such a trend may have a natural explanation in the dependence of mass-loss due to stellar winds on the metallicity (Vink et al., 2001; Penny et al., 2004); a lower metallicity results in weaker stellar winds and hence stars in low-metallicity environments rotate more quickly, a fact well established for the SMC (Hunter et al., 2008). Thus the more quickly rotating B star population leads to a higher fraction of Be stars.
Nevertheless, all of these comparative studies between the MW, LMC, and SMC proceed by counting candidate Be stars in the total cluster population, selected either photometrically (see, for example, McSwain & Gies, 2005) or spectroscopically with very low-resolution (see Martayan et al., 2010). Of course not all Be stars in a population can be found this way and detection efficiencies generally point to selection criteria of a H emission equivalent width111We adopt the convention that a positive equivalent width denotes emission. in excess of Å as required to identify a candidate Be star (Martayan et al., 2010). Assumed in all of these studies is that individual Be stars are more or less the same in the MW, LMC, and SMC so that the comparative statistics are not affected by the detection efficiency. However, there are indications that, at some level, this may not be true. For example, the equivalent width distribution of H differs between the MW and SMC, with the SMC distribution peaking at higher equivalent widths (Martayan et al., 2007b).
In this work, we will illustrate a fundamental difference between Be star disks in the MW and the SMC: for the same central star spectral type and disk density distribution, disks in the SMC are much hotter than in the MW. We will quantify this effect over the early Be star spectral types (those for which LMC and SMC samples are reasonably complete), and we will examine how counts of the Be star populations based on the H equivalent width in different metallicity systems might be affected by this systematic temperature difference.
2 Calculations
The thermal structure of the Be star disks was computed with the bedisk code of Sigut & Jones (2007). This code enforces radiative equilibrium in a photoionized circumstellar disk including the heating and cooling processes for the 9 most abundant elements (H, He, CNO, Mg, Si, Ca, & Fe) over several ionization stages. Details of the atomic models and atomic data, as well as an overview of the bedisk code, are given in Sigut & Jones (2007).
The density structure of the disk was assumed to be of the fixed form
| (1) |
where and are the cylindrical co-ordinates for the assumed axisymmetric disk, and is the radius of the central B star. The quantities and are adjustable parameters that fix the density structure of the disk. The function , defined below by Eq. 2, sets the vertical (or ) scale height of the disk. This simple density model has been very successful in interpreting a wide range of Be star observations (Gies et al., 2007; Tycner et al., 2008; Jones et al., 2008). Thus the thermal models of this work are identified first by the spectral type of the central B star (which sets the photoionizing radiation field) and then by the disk density parameters and .
The fundamental parameters assumed for the central B stars are given in Table 1. The mass and radius as a function of spectral type, as well as the MW calibration, are adopted from Cox (2000). Note that we have assumed the same mass and radius as a function of spectral type for the MW and SMC. Stellar evolution calculations have shown that B stars are likely smaller in low metallicity systems such as the SMC. For example, Maeder & Meynet (2001) show that a star (roughly a B0 star) decreases in radius by about 20% as the metallicity is lowered from to . However, we have ignored these differences to ensure both the SMC and MW disk models have the same density structure. The spectral-type – calibration for the SMC is discussed below.
The vertical (or ) dependence of Eq. 1 contains the function which is defined as
| (2) |
Here is the mass of the central B star, is the mean-molecular weight of the disk gas, and is an assumed isothermal disk temperature. Eqs. 1 and 2 follow from the assumption that the disk is in vertical hydrostatic equilibrium set by the component of the stellar gravitational acceleration and an assumed isothermal disk temperature, . Note that is only used in Eq. 2 to fix the vertical density structure of the disk; the actual temperatures in the disk, , are found by enforcing radiative equilibrium.
Sigut et al. (2009) consider consistent models in which the vertical structure of the disk is found by integrating the equation of hydrostatic equilibrium in a manner consistent with the radiative equilibrium disk temperatures; this treatment eliminates the need for the parameter . However, the disk density distribution is now dependent on the temperatures in the disk. As the desire of the current work is to compare the temperature of MW and SMC disks of identical density structure, we have used Eqs. 1 and 2 with the same for each spectral type (namely where is the Milky Way effective temperature at a given spectral type).222Their remains a difference between the MW and SMC density structures due to the different mean-molecular weights of the gas, but this difference is extremely small. We do not expect this assumption to significantly affect our differential comparison.
| Spectral Type | Mass | Radius | ||
|---|---|---|---|---|
| () | () | (K) | (K) | |
| B0 | 17.5 | 7.4 | 30000 | 32000 |
| B0.5 | 15.4 | 6.9 | 28000 | 29600 |
| B1 | 13.2 | 6.4 | 25000 | 28000 |
| B1.5 | 11.0 | 5.9 | 23000 | 26400 |
| B2 | 9.1 | 5.3 | 21000 | 23800 |
| B3 | 7.6 | 4.8 | 19000 | 22000 |
The disk is assumed to be in Keplerian rotation and hence rotationally supported in the direction. Gravitational darkening due to the potential rapid rotation of the central B star is not included, although this process can affect the thermal structure of the disk (McGill et al., 2011).
The main energy input into the disk is assumed to be photoionizing radiation from the central star. For this paper, the older Kurucz (1993) LTE photoionizing fluxes used by Sigut & Jones (2007) were replaced with the newer non-LTE calculations of Lanz & Hubeny (2007). Two grids from these calculations were used, the solar metallicity grid (p00) to compute the MW models, and the solar abundance grid (m10) to compute the SMC models.
The thermal disk models are thus described by three parameters: the spectral type of the central B star (which is assumed to fix the stellar mass, radius and effective temperature), and the two parameters in Eq. 1 that fix the density of the disk, , the base density (in ) and the power-law index . For this set of calculations, spectral types B0, B0.5, B1, B1.5, B2, and B3 were considered as these are the spectral types for which Martayan et al. (2007a) consider their SMC cluster samples complete. Power-law indexes , , and and 11 densities ranging from to were considered.
Two sets of Be star disk models were computed, one appropriate to the MW and one appropriate to the SMC. Three basic changes distinguish between the MW and SMC models:
[1] The abundance table used as input to bedisk was changed to reflect the composition of the gas. The adopted abundances for the MW and SMC are given in Table 2. The solar abundances of Asplund et al. (2005) were assumed for the Milky Way, and the abundance scale for the SMC was taken mostly, although not exclusively, from the VLT-FLAMES survey (Korn et al., 2000; Rolleston et al., 2003; Hunter et al., 2005; Evans et al., 2005; Hunter et al., 2007, 2009). The adopted SMC abundances agree very well with the recent compilation of Evans (2009). The general abundance pattern of the SMC is (Mokiem et al., 2007) but we keep the individual abundances for each element.
[2] The input photoionizing radiation field was taken to be either the Lanz & Hubeny (2007) p00 for MW runs or m10 for the SMC runs. Test calculations at the solar abundances of Table 2 show that very similar temperatures result using either the p00 (solar) or m10 ( solar) photoionizing radiation fields. Hence, the small mismatch between the overall abundances used to compute the photoionizing radiation by Lanz & Hubeny (2007) and actual SMC abundances used here is likely of little consequence to the results.
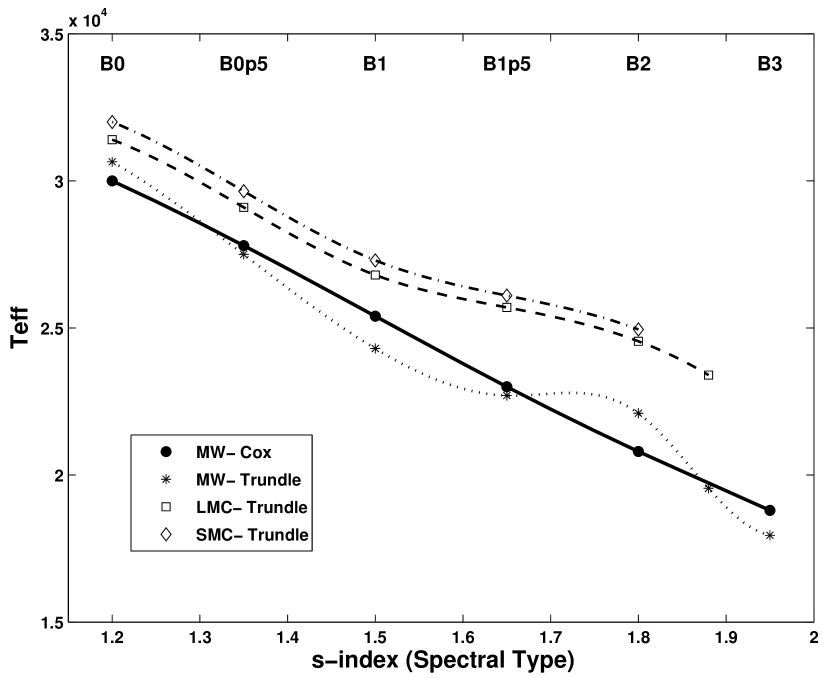
[3] It is well established that the spectral-type – calibration differs between the MW and the SMC, with the SMC early-B stars being hotter (Trundle et al., 2007). This is shown in Figure 1. Here the Milky Way calibration of B dwarfs by Trundle et al. (2007) agrees well with the scale of Cox (2000) (adopted in this work) whereas the LMC and SMC calibrations are systematically hotter by a few thousand degrees. Our adopted scales are given in Table 1. Note that we do not adopt the Trundle et al. (2007) SMC ’s directly but increase our adopted MW calibration of Cox (2000) by the amount found by Trundle et al. (2007). However, the differences between our SMC ’s and that found directly by Trundle et al. (2007) are small.
Of these three differences between MW and SMC models, [1] and [3] have the largest affect on the disk temperatures.
One caveat to our analysis is that we have ignored gravitational darkening of the central B stars due to rotation. As a class, Be stars are well established to be rapid rotators (Porter, 1996; Yudin, 2001; Porter & Rivinius, 2003), although how close to critical rotation (in which the equatorial velocity of the star equals the orbital speed) is still contentious. Townsend et al. (2004) demonstrated that rotation rates above 80% of critical rotation (or ) may be difficult to detect because gravitational darkening leads to a significant cooling of the star’s most rapidly rotating equatorial regions. Nevertheless, Cranmer (2005) used a statistical analysis including the effects of gravitational darkening to demonstrate that the distribution of rotation speeds for early Be stars (in the MW) is fairly uniform between 60 and 100% of critical. Hence for the MW, a representative value of 80%, or , is reasonable. Martayan et al. (2007a) demonstrate that for the SMC field NGC 330, Be stars rotate on average at . Recently, McGill et al. (2011) have demonstrated that Be star disks become systematically cooler as a result of gravitational darkening. Thus any potential difference in mean rotation rates, , between the MW and SMC could result in a systematic decrease in the temperature of SMC Be star disks. Fortunately, we can use the results of McGill et al. (2011) to estimate the expected effect. Taking for the Milky Way and for the SMC (rounding the observed value up for the maximal effect), Figures 4, 5 and 6 in McGill et al. (2011) give a reduction in the density-weighted, global disk temperature of K for an increase in from to . As will be demonstrated in the subsequent sections, this temperature decrease is much smaller (by at least a factor of five) than the temperature increase predicted for SMC disks due to effects [1] and [3] above. As a result, the neglect of gravitational darkening is not a significant source of uncertainty.
| Element | Abundance | |
|---|---|---|
| MW | SMC | |
| He | 10.92 | 10.9 |
| C | 8.39 | 7.34 |
| N | 7.78 | 6.97 |
| O | 8.66 | 8.10 |
| Mg | 7.53 | 6.76 |
| Si | 7.51 | 6.77 |
| Fe | 7.45 | 6.93 |
Note. — The tabulated abundances are given as . The MW (solar) abundances are from Asplund et al. (2005). Sources for the SMC are discussed in the text.
3 Results: Temperature Structure
In this section, we consider how disks of the same, fixed density differ in their thermal structure due to the metallicity of the gas. In order to compare a large number of models of differing spectral types and density parameters, we will construct a single, global measure of the disk temperature, namely the density-weighted, average disk temperature, defined as
| (3) |
Figure 2 shows this density-weighted disk temperature as a function of the central B star’s for both the MW and SMC for all density models with a radial power-law index of in Eq. 1. Figure 3 shows a similar plot but for the slower radial drop-off of . In both figures, the global disk temperature is shown both as an absolute temperature and as a fraction of the stellar (which differs between the MW and SMC). For each , temperatures and temperature ratios are plotted for each of the 11 disk base densities, , considered. Immediately evident from the figures is the significantly lower global disk temperatures for high values of . Dense disks develop a cool equatorial zone near the star (Millar & Marlborough, 1998; Sigut et al., 2009) and this can significantly lower the density-weighted average disk temperature. This effect is particularly noticeable in Figure 3 which includes the densest disks considered in this work ( and ).
For , the MW temperature ratios are reasonable well fit by 333Sigut et al. (2009) suggests a value of 0.6 as most appropriate for Be star disks. However, the models in that work do not have a fixed vertical density structure but self-consistently solve the equation of hydrostatic equilibrium. In addition, they are of an odd type compared to the present work: pure hydrogen/helium disks (i.e. zero metallicity) with a solar metallicity (p00) photoionizing radiation field. wheres the SMC disks are better fit by . Thus the SMC disks are even hotter than expected by the increased effective temperatures of the SMC B stars. This reflects the lower cooling rates in the SMC disks due to the lower metallicity of the gas. Note that the densest disks (the largest symbols) are not well-fit by the general median trend and the fit is particularly poor for the densest disks with (Figure 3); the cool equatorial zone significantly lowers the density-weighted average temperatures.
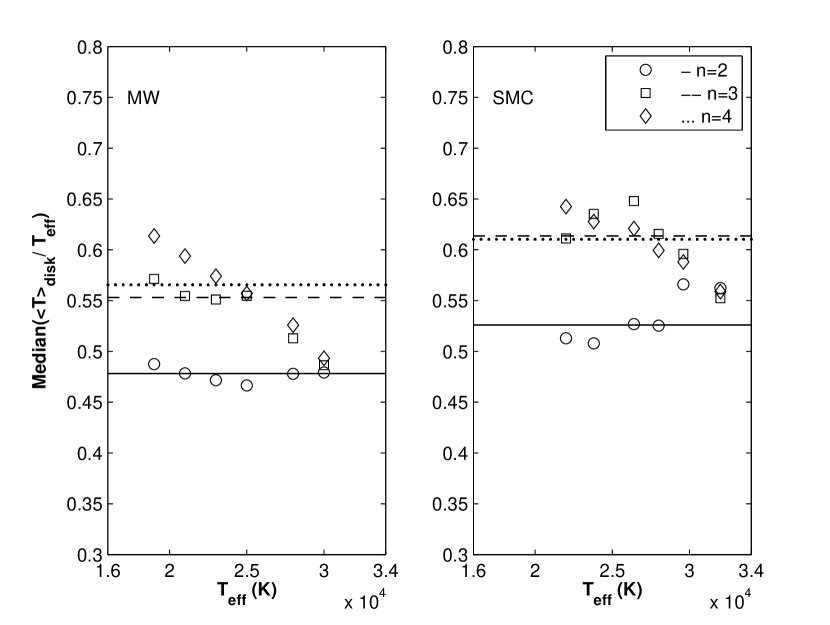
This entire situation is summarized in Figure 4 which shows the disk temperature ratios, averaged over , as a function of for the three power-law indexes considered, , , and . There is little difference between the and models whereas the models are significantly cooler due to their larger densities. Note the median ratio over all considered is always higher in the SMC. The numerical values for the median temperature ratios are given in Table 3.
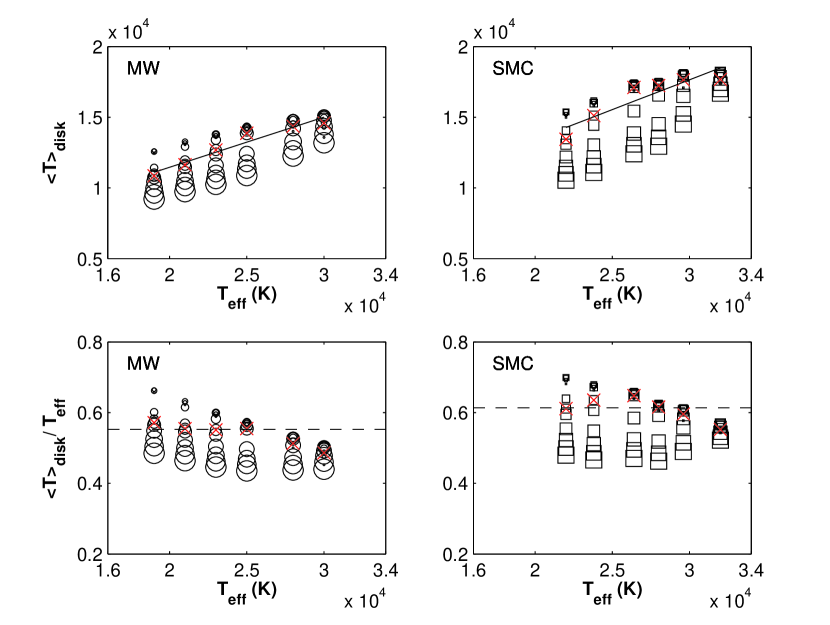
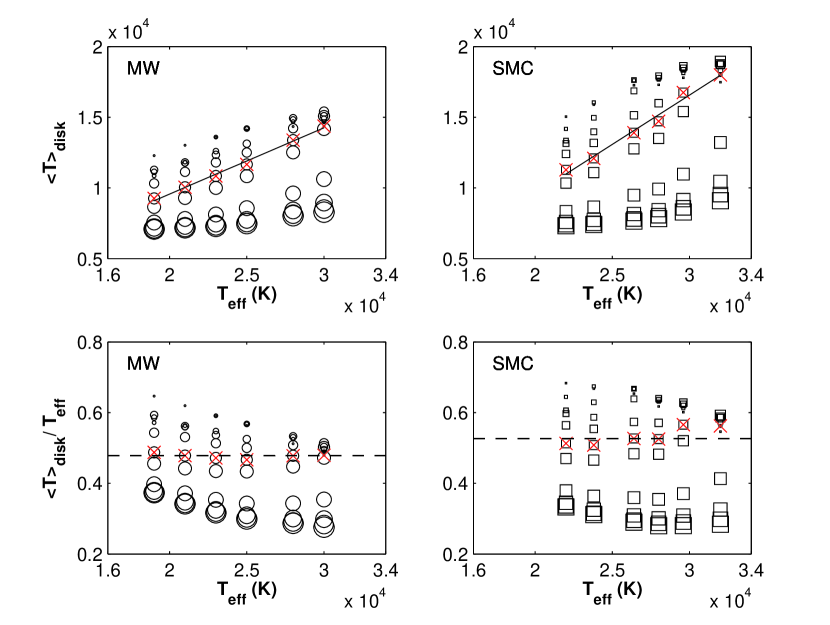
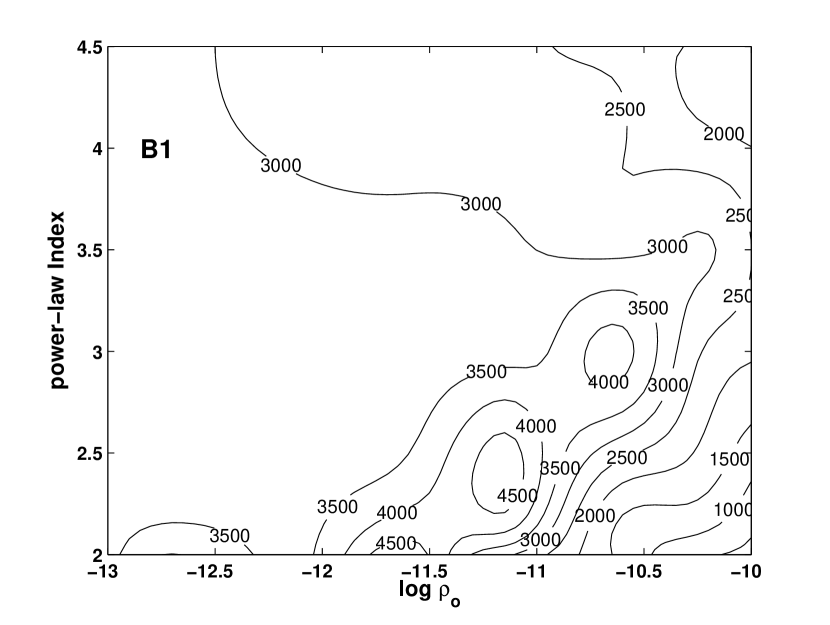
Figure 5 shows as a contour plot of the difference between SMC and MW density-weighted average disk temperature as a function of the disk density parameters and for the spectral type B1. Differences of up to K are seen (SMC hotter) with the largest values occurring for intermediate disk densities . The location of the maximum temperature difference in this plot tends to move to higher for larger . The temperature difference rapidly drops for the densest models considered ( and ) as the density-weighted temperature in this region is dominated by the very cool equatorial zone close to the star; this occurs in the most optically thick portion of the disk where the sensitivity to the gas metallicity is least.
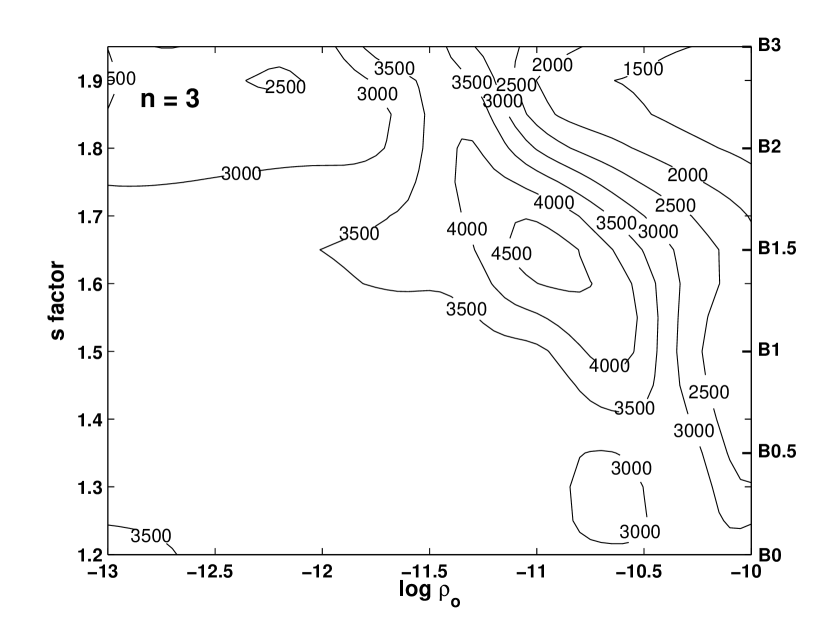
Figure 6 again shows the temperature difference between the SMC and MW models but this time as a function of spectral type and for a fixed power-law index of . The spectral type is plotted as the -factor of de Jager & Nieuwenhuijzen (1987) (namely 1.20 for B0, 1.35 for B0.5, 1.50 for B1, 1.65 for B1.5, 1.80 for B2 and 1.95 for B3). Again the largest temperature differences are for the intermediate density models with the largest absolute differences occurring near spectral type B1.5, near the peak of the Be star distribution with spectral type.
| Index | ||
|---|---|---|
| MW | SMC | |
| 4.0 | ||
| 3.0 | ||
| 2.0 | ||
4 Results: H Equivalent Width
While interesting, the previous results are of limited practical use because the thermal structure of a circumstellar disk is not directly observed. The main observable for Be stars is the equivalent width (in emission) of the H line (Å) in the spectrum. Hence it is of direct practical interest to compare the H emission line equivalent widths between the MW and SMC models. All current methods designed to find and measure the Be star fraction in a stellar cluster implement some technique to select candidate emission-line stars based on a measurement of H. For example, Martayan et al. (2010) use very low-resolution slitless spectroscopy and estimate that their survey of Be stars in SMC clusters detects Be stars with H emission equivalent widths in excess of Å or peak intensities more than twice the adjacent continuum.
To this end, we have used the beray code of Sigut (2010) to compute the H line profile and equivalent width (in Å) for each of the MW and SMC disk models of the previous section. The beray code solves the equation of radiative transfer along a series of rays through the star-disk system to compute both resolved monochromatic images and unresolved spectra. The H calculations used the and level populations of hydrogen from the bedisk thermal solution. Rays that terminate on the stellar surface use the Doppler shifted photospheric LTE H line profiles444These profiles were computed in stellar atmospheres assuming the solar abundance. While the profile corresponding to the required stellar temperature ( or ) was used, this still represents a small inconsistency. We suspect that this effect is smaller than the uncertainty introduced by the use of LTE, as opposed to non-LTE, profiles. Nevertheless as we are really interested only in models with strong emission in H for which the disk dominates, the adopted photospheric profile is not a major source of uncertainty. of Barklem & Piskunov (2003) for the initial boundary condition, while rays that pass entirely through the disk assume no incident radiation. The formal solution to the transfer equation was performed using the H source function and the bound-free and free-free continuous opacity and emissivity sources at the wavelength of H. Electron scattering was also included using the mean intensity at each position in the disk as the source function for the scattering emissivity. The disk was assumed to be in pure Keplerian rotation and the frequency-angle dependent transfer equation was solved in the observer’s frame (Mihalas, 1978).
Calculating the H line profile adds two parameters to the problem, the inclination of the Be system to the line of sight ( indicates a pole-on star/disk, and , an edge-on one) and the outer radius of the disk, (quoted here in units of the stellar radius).555The thermal solution for the disk structure, computed by bedisk, assumed . In beray, smaller choices for were enforced by multiplying all level populations beyond by . The inner radius of all disks was taken to be the stellar radius. Values for these parameters were taken to be , , , , and , and , , , and . For each spectral type, there were a total of 660 models representing all permutations of the parameters , , and .
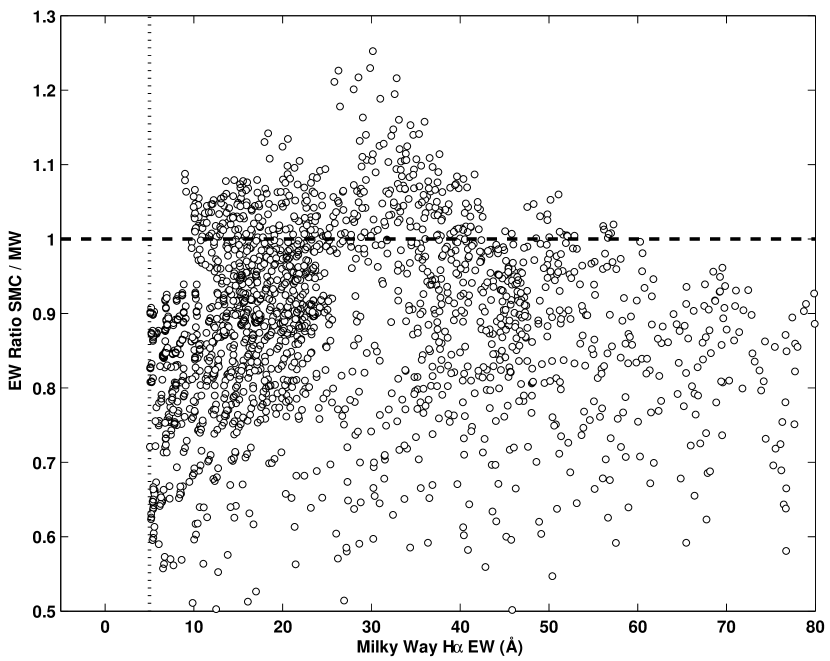
The ratio of the SMC and MW H equivalent widths is shown in Figure 7. The trend is clear: H is generally weaker in the SMC compared to a disk of the same density structure in the MW. Over all models satisfying Å, only 366 out of 2047 models (or 18%) had a stronger H line in the SMC; the median SMC to MW equivalent width ratio is .
For early-type Be stars, disk temperatures usually exceed K and increased temperatures tend to reduce the population of the excited states of hydrogen due to increased ionization. This results in a weaker H line. Nevertheless, the temperature structure of the denser Be disk models is quite complex (see, for example, Sigut et al., 2009) and some of these models can produce a stronger H line in the SMC. Table 4 gives the fraction of the models in which the SMC H equivalent width was larger than the MW model (for an identical disk) as a function of spectral type. This fraction increases strongly for later spectral types (more than doubling over the range considered) showing that the cooler disks around later spectral types have a much larger fraction of increased H strengths in the SMC.
Table 5 shows an additional interesting result. Over all models (spectral type and density structure), there is a very strong dependence of the fraction of models that predict a stronger H EW in the SMC on the viewing angle. Increased emission is essentially eliminated (fraction less than 10%) for models seen more “disk-on” with . Note that the maximum viewing inclination in this work, , does not produce obvious shell-spectra characteristic of Be star disks seen nearly edge-on.666Be shell stars are not considered in the present work. The fraction of Be shell stars in the MW is % (Hanuschik, 1996). The fraction in the SMC is estimated to be % (Martayan et al., 2007b).
| Spectral Type | H Larger | H Smaller | Larger Fraction |
|---|---|---|---|
| B0.5 | 38 | 325 | 10% |
| B1 | 57 | 346 | 14% |
| B1.5 | 82 | 341 | 19% |
| B2 | 81 | 346 | 19% |
| B3 | 108 | 323 | 25% |
Note. — Only models predicting Å emission are included.
| Inclination | H Larger | H Smaller | Larger Fraction |
|---|---|---|---|
| 133 | 332 | 29% | |
| 110 | 316 | 26% | |
| 80 | 347 | 19% | |
| 33 | 345 | 9% | |
| 10 | 341 | 3% |
Note. — Only models predicting Å emission are included.
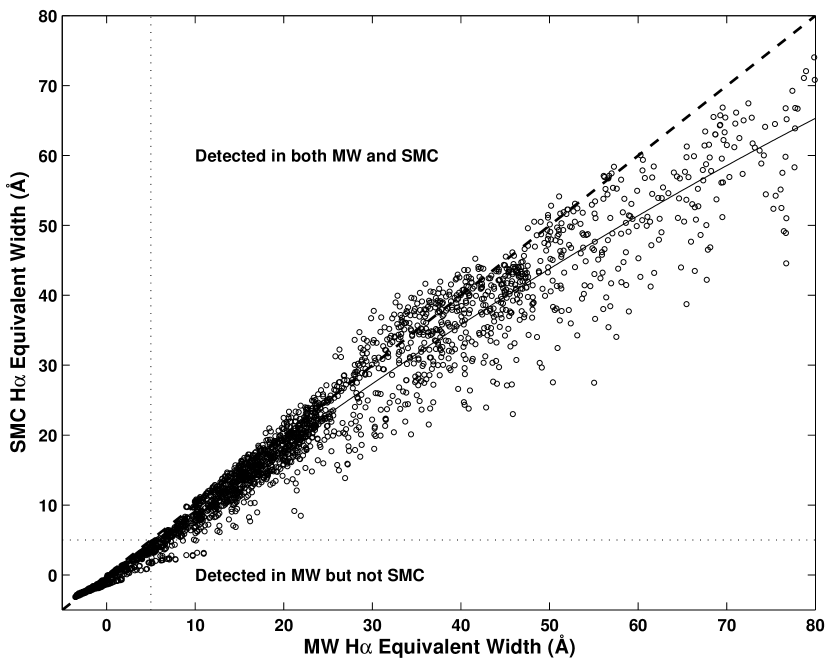
The difference in H equivalent widths between the MW and SMC could potentially affect the comparison of the fraction of Be stars in clusters. Even if both the MW and the SMC had the same distribution of disk density parameters (i.e. , and ), there would nevertheless be a different distribution of H line strengths because of the different temperature structure of the disks. Figure 8 shows the SMC H equivalent width plotted against the MW value for a disk of the same density structure. If one assumes a selection method for candidate Be stars with the same threshold in the MW and SMC, there will be a population of stars with weaker emission in the SMC that fall below the detection limit whereas the MW counterparts would be counted. This effect is quantified in Table 6 which gives the missed percentage of Be stars among the SMC models as a function of H detection thresholds of between and Å. As can be seen, this effect is small with the missed percentage rising to % only for thresholds as large as Å. For thresholds between 5 and Å, the prediction is about 5%. Hence despite the rather large temperature differences between the SMC and MW disks, the systematic difference in the H equivalent widths is not a serious source of bias in Be star candidate counts.
| Threshold EW | Number of Detected Be Stars | Percent Missed | |
|---|---|---|---|
| (Å) | MW | SMC | |
| 2.0 | 2210 | 2157 | 2.4% |
| 5.0 | 2047 | 1939 | 5.2% |
| 10.0 | 1774 | 1670 | 5.9% |
| 15.0 | 1458 | 1324 | 9.2% |
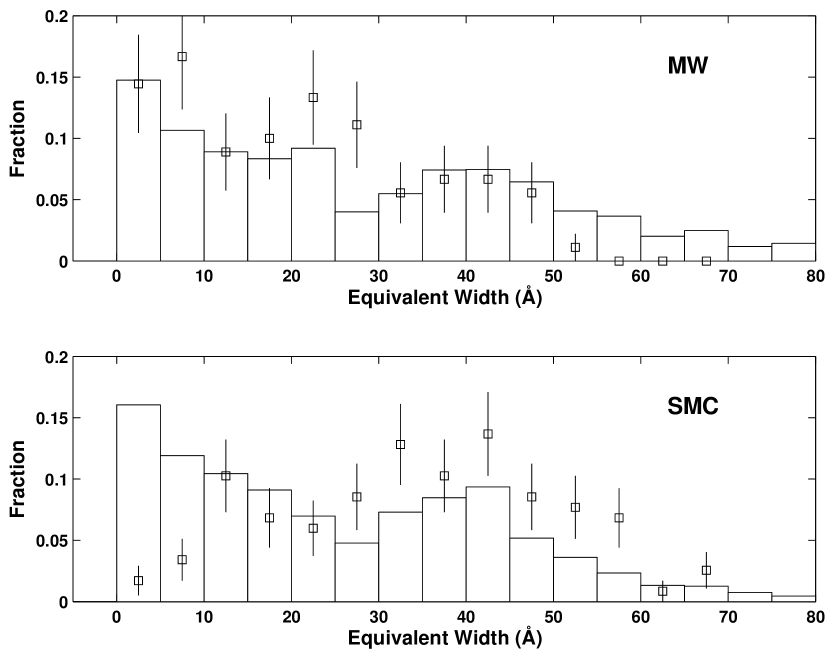
Finally, we compare the H equivalent width distributions predicted by our models of both the MW and SMC with the observational results of Martayan et al. (2007b). In this comparison, we include all models producing emission (i.e. all values of , , and which result in ) except those with the smallest disks, . In constructing the histograms, we have weighted each model based on its inclination as follows: for random inclinations, the probability of observing an inclination between and is . Therefore, we have assumed that each of the five values of considered is the centre of a (non-overlapping) bin and have weighted each model by the fractional area in that bin.777The bins are (in degrees) , , , , and which have fractional areas , , , , and , respectively. As an example, for each 10 stars in the first bin, there should be 50 stars in the last bin.
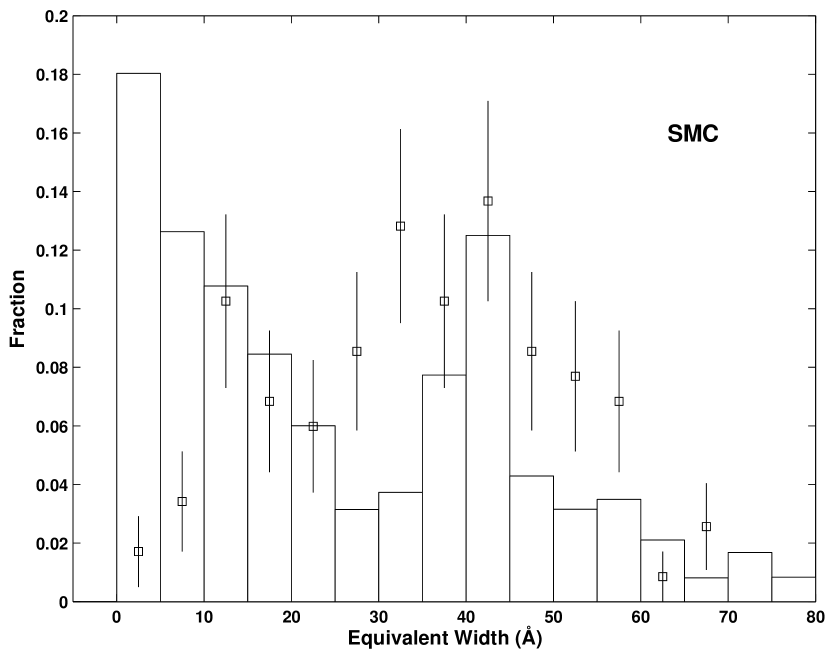
The results are shown in Figure 9. For the Milky Way, Martayan et al. (2007b) adopt the equivalent width measurements of Andrillant & Fenhrenbach (1982), Andrillant (1983), and Dachs et al. (1992). As noted, the only “fine-tuning” of our models is the exclusion of the small disks; these disks produce a large peak for Å which is not seen in the observations. Such small disks, when they seem to occur in nature, are usually attributed to binary truncation (for example see the case of Ara as discussed by Meilland et al., 2009). Given this, the predicted MW equivalent width distribution gives a reasonable match to the observations. However, we do note that the sample of Milky Way observations finds few widths above Å whereas such values are represented in our models. For the SMC, the models produce a poorer match to the observations of Martayan et al. (2007b). We suspect the large mismatch for Å may be incompleteness in the observations. However, the models under-predict the fraction of large equivalent widths (Å) by a significant amount and this difference seems to be a difference between the MW and SMC, as noted by Martayan et al. (2007b). As suggested by these authors, this and other observational evidence suggests that Be star disks are systematically larger in the SMC. Indeed, Figure 10 shows that we can produced a peak in the SMC distribution near Å by restricting the model set to only the largest disks considered, , although the peak is not wide enough. We suspect that including even larger disks might improve the fit.
5 Conclusions
We have computed a large set of Be star disk models appropriate to the average metallicities of the Milky Way and the SMC. We have shown that for a disk of identical density structure, SMC disks are systematically hotter than MW disks, typically by several thousand degrees. This difference is attributable to the higher scale of massive stars in the SMC and the lower metallicity of the SMC disk gas, which reduces its ability to cool. For all of the considered models, the H emission equivalent width is generally smaller in the SMC as compared to MW disks of identical density. However, this systematic difference is not predicted to affect comparisons of Be star fractions between the MW and SMC.
We also show that the H equivalent width distributions of our models is in reasonable agreement with the known MW distribution. However, a similar distribution of underlying parameters does not seem to fit the SMC. We confirm the suggestion of Martayan et al. (2007b) that systematically larger Be stars disks in the SMC may explain this discrepancy. It would be desirable to put this interesting result on a sounder footing by directly determining the disk parameters for a sample of SMC Be star disks via the analysis of high-resolution spectra. Such a study would directly give the distribution of disk parameters (, and ) which could be compared to a similar sample in the MW and would allow a more detailed investigation of how lower metallicity affects these circumstellar disks.
References
- Andrillant (1983) Andrillant, Y. 1983, A&AS, 53, 319
- Andrillant & Fenhrenbach (1982) Andrillant, Y., & Fenhrenbach, C. 1982, A&AS, 48, 93
- Asplund et al. (2005) Asplund, M., Grevesse, N., & Sauval, A. J. 2005 in Cosmic Abundances as Records of Stellar Evolution and Nucleosynthesis in Honour of David Lambert, ed. T. G. Barnes III & F. N. Bash, ASP Conf. Ser. 336, 25
- Barklem & Piskunov (2003) Barklem, P. S., & Piskunov, N. 2003 in IAU Symp. 210, Modelling of Stellar Atmospheres, ed. N. Piskunov, W. W. Wies, & D. F. Gray (San Francisco: ASP), E28
- Coté & Waters (1987) Coté, J., & Waters, L. B. F. M. 1987, A&A, 176, 93.
- Cox (2000) Cox, A.N. 2000, Allen’s Astrophysical Quantities (4 th ed.; New York: Springer)
- Cranmer (2009) Cranmer, S.R. 2009, ApJ, 701, 396
- Cranmer (2005) Cranmer, S.R. 2005, ApJ, 634, 585
- Dachs et al. (1992) Dachs, J., Stich, J., & Hanuschik, R. W., 1992, A&AS, 95, 437
- de Jager & Nieuwenhuijzen (1987) de Jager, C.,& Nieuwenhuijzen, H., 1987, A&A, 177, 217
- Ekström et al. (2008) Ekström, S., Meynet, G., Maeder, A., & Barblan, F., 2008, A&A, 478, 467
- Evans (2009) Evans, C. J. 2009 in The Properties of early-type stars in the Magellanic Clouds, ed. J. T. van Loon & J. M. Oliveira, IAU Symp. 256, 325
- Evans et al. (2005) Evans, C. J., & 25 co-authors, 2005, A&A, 437, 467
- Fabregat & Gutiérrez-Soto (2005) Fabregat, J., & Gutiérrez-Soto, J. 2005, Publ. Astron. Inst. ASCR, 93, 3
- Fabregat & Torrejón (2000) Fabregat, J., & Torrejón, J. M. 2000, A&A, 357, 451.
- Frémat et al. (2005) Frémat, Y., Zorec, J., Hubert, A.-M., & Floquet, M. 2005, A&A440, 305
- Gies et al. (2007) Gies, D. R., and 24 co-authors 2007, ApJ, 654, 527
- Hanuschik (1996) Hanuschik, R. W. 1996, A&A, 308, 170
- Huat et al. (2009) Huat, A.-L., and 21 co-authors 2009, A&A, 506, 95
- Hunter et al. (2009) Hunter, I., and 10 co-authors 2009, A&A, 496, 841
- Hunter et al. (2008) Hunter, I., and 7 co-authors 2008, A&A, 479, 541
- Hunter et al. (2007) Hunter, I., and 8 co-authors 2007, A&A, 466, 277
- Hunter et al. (2005) Hunter, I., and 6 co-authors 2005, A&A, 436, 687
- Hummel & Vrancken (2000) Hummel, W., & Vrancken, M. 2000, A&A, 359, 1075
- Jones et al. (2008) Jones, C. E., Tycner, C., Sigut, T. A. A., Benson, J. A., & Hutter, D. J. 2008, ApJ, 687, 598
- Kurucz (1993) Kurucz, R. F. 1993, Kurucz CD-ROM No. 13. Cambridge, Mass: Smithsonian Astrophysical Observatory
- Keller et al. (1999) Keller, S. C., Wood, P. R., & Bessell, M. S., 1999, A&AS, 134, 489
- Korn et al. (2000) Korn, A. J., Becker, S. R., Gummersbach, C. A., & Wolf, B. 2000, A&A, 353, 655
- Krtic̆ka et al. (2011) Krtic̆ka, J., Owocki, S. P., & Meynet, G. 2011, A&A, 527, A84
- Lanz & Hubeny (2007) Lanz, T. & Hubeny, I. 2007, ApJS, 83, 104.
- Lee et al. (1991) Lee, U., Saio, H., & Osaki, Y. (1999), MNRAS, 250, 342
- Maeder et al. (1999) Maeder, A., Grebel, E. K., & Mermilliod, J.-C. 1999, A&A, 346, 559
- Maeder & Meynet (2001) Maeder, A. & Meynet, G. 2001, A&A, 373, 555
- Martayan et al. (2010) Martayan, C., Baade, D., & Fabregat, F. 2010, A&A, 509, A11.
- Martayan et al. (2007a) Martayan, C., Frémat, Y., Hubert, A.-M., Floquet, M., Zorec, J., & Neiner, C. 2007, A&A, 462, 683
- Martayan et al. (2007b) Martayan, C., Floquet, M., Hubert, A.-M., Gutiérrez-Soto, J., Fabregat, J., Neiner, C., & Mekkas, M. 2007, A&A, 472, 577
- Martayan et al. (2006) Martayan, C., Frémat, Y., Hubert, A.-M., Floquet, M., Zorec, J., & Neiner, C. 2006, A&A, 452, 273
- Martayan et al. (2006) Martayan, C., Hubert, A.-M., Floquet, M., Fabregat, J., Frémat, Y., Neiner, C., Stee, P., & Zorec, J. 2006, A&A, 445, 931
- Mathew et al. (2008) Mathew, B., Subramaniam, S., & Bhatt, B. C. 2008, MNRAS, 388, 1897
- McGill et al. (2011) McGill, M. A., Sigut, T. A. A., & Jones, C. E. 2011, ApJ, to be published
- McLean & Brown (1978) McLean, I. S., & Brown, J. C. 1978, A&A, 69, 291
- McSwain & Gies (2005) McSwain, M.V., & Gies, D.R. 2005, A&AS, 161, 118
- McSwain & Gies (2005) McSwain, M. V., & Gies, D. R. 2005, ApJ, 662, 1052
- Meilland et al. (2009) Meilland, A., Stee, Ph., Chesneau, O., & Jones, C. 2009, A&A, 505, 687.
- Mihalas (1978) Mihalas, D. 1978 Stellar Atmospheres (W. H. Freeman & Company: New York)
- Millar & Marlborough (1998) Millar, C. E., & Marlborough, J. M. 1998, ApJ, 494, 715
- Mokiem et al. (2007) Mokiem, M. R., and 11 co-authors, 2007, A&A, 473, 603.
- Oudmaijer et al. (2008) Oudmaijer, R., Parr, A.M., Baines, D., & Porter, J.M. 2008, A&A, 489, 627
- Penny et al. (2004) Penny, L. R., Sprague, A. J., Seago, G., & Gies, D. R. 2004, ApJ, 617, 1316
- Poeckert et al. (1979) Poeckert, R., Bastien, P., & Landstreet, J. D. 1979, AJ, 84, 812
- Porter & Rivinius (2003) Porter, John M., & Rivinius, T. 2003, PASP, 115, 1153
- Porter (1999) Porter, John M. 1999 A&A, 348, 512
- Porter (1996) Porter, John M. 1996 MNRAS, 280, L31
- Quirrenback et al. (1997) Quirrenback, A., & 8 co-authors, ApJ, 479, 477
- Rivinius et al. (1998) Rivinius, T., Baade D., Stefl, S., Stahl, O., Wolf, B., & Kaufer, A, 1998, A&A, 336, 177
- Rolleston et al. (2003) Rolleston, W. R., Venn, K., Tolstoy, E., Dufton, P. L. 2003, A&A, 400, 21
- Sigut (2010) Sigut, T.A.A. 2010 in IAU Symp. 272, Active OB Stars: structure, evolution, mass loss, and critical limits, ed. C. Neiner, G. Wade, G. Meynet, & G. Peters (Cambridge University Press), 426.
- Sigut et al. (2009) Sigut, T.A.A, McGill, M.A., Jones, C.E. 2009, ApJ, 699, 1973
- Sigut & Jones (2007) Sigut, T.A.A, & Jones, C.E. 2007, ApJ, 668, 481
- Slettebak (1988) Slettebak, A. 2007, PASP, 100, 770
- Townsend et al. (2004) Townsend, R. H. D., Owowki, S. P., & Howarth, D. 2004, MNRAS, 350, 1989
- Trundle et al. (2007) Trundle, C., and 6 co-authors, 2007, A&A, 471, 625.
- Tycner et al. (2008) Tycner, C., Jones, C., Sigut, T. A. A., Scmitt, H. R., Benson, J. A., Hutter, D. J.,& Zavala, R. T. 2008, ApJ, 689, 461
- Tycner et al. (2005) Tycner, C., and 8 co-authors 2005, ApJ, 624, 359
- Van Bever & Vanbeveren (1997) Van Bever, J. & Vanbeveren, D. 1997, A&A, 322, 116.
- Vink et al. (2001) Vink, J. S., de Koter, A., & Lamers, H. G. J. L. M. 2001, A&A, 369, 574
- Wisniewski & Bjorkman (2006) Wisniewski, J.P., & Bjorkman, K.S. 2006, ApJ, 652, 458
- Wade & Rucinski (1985) Wade, R.A., & Rucinski, S.M. 1985, A&AS, 471, 484
- Yudin (2001) Yudin, R. V. 2001, A&A, 368, 912
- Zorec & Briot (1997) Zorec, J., & Briot, D. 1997, A&A, 318 ,443