Substellar Objects in Nearby Young Clusters (SONYC) V: New brown dwarfs in Ophiuchi 111Based in part on data collected at Subaru Telescope, which is operated by the National Astronomical Observatory of Japan. Based in part on observations collected at the European Organisation for Astronomical Research in the Southern Hemisphere, Chile (program 385.C-0450).
Abstract
SONYC – Substellar Objects in Nearby Young Clusters – is a survey program to investigate the frequency and properties of substellar objects with masses down to a few times that of Jupiter in nearby star-forming regions. For the 1 Myr old Ophiuchi cluster, in our earlier paper we reported deep, wide-field optical and near-infrared imaging using Subaru, combined with 2MASS and Spitzer photometry, as well as follow-up spectroscopy confirming three likely cluster members, including a new brown dwarf with a mass close to the deuterium-burning limit. Here we present the results of extensive new spectroscopy targeting a total of 100 candidates in Oph, with FMOS at the Subaru Telescope and SINFONI at the ESO’s Very Large Telescope. We identify 19 objects with effective temperatures at or below 3200 K, 8 of which are newly identified very-low-mass probable members of Oph. Among these eight, six objects have K, confirming their likely substellar nature. These six new brown dwarfs comprise one fifth of the known substellar population in Oph. We estimate that the number of missing substellar objects in our survey area is , down to and for . The upper limit on the low-mass star to brown dwarf ratio in Oph is , while the disk fractions are and for stars and BDs, respectively. Both results are in line with those for other nearby star forming regions.
Subject headings:
stars: circumstellar matter, formation, low-mass, brown dwarfs – planetary systems1. Introduction
Understanding the origin of the stellar initial mass function (IMF) is one of the major topics in astrophysics. The low-mass end of the IMF, in particular, has been subject of numerous observational and theoretical studies over the past decade (see Bonnell et al. 2007). Brown dwarfs (BD; ) are an important class of objects to test the mass dependence in the formation and early evolution of stars and planets. Establishing a census of young substellar objects is a fundamental prerequisite to test the competing theoretical scenarios trying to explain their origin. These scenarios include turbulent fragmentation (Padoan & Nordlund, 2004), ejections from multiple systems (Bate, 2009) or protoplanetary disks (Stamatellos & Whitworth, 2009). Further issues that can be addressed by investigating young brown dwarfs are, among others, the evolution of accretion disks (e.g., the impact of photoevaporation), the formation of multiple systems (Bate, 2009), the mass dependence of planet formation (Payne & Lodato, 2007), and the early regulation of angular momentum (Scholz & Eislöffel, 2004, 2005). Young BDs also provide excellent test-beds for low-gravity atmosphere models (e.g. Kirkpatrick et al., 2008).
Surveys in star-forming regions have revealed the existence of free-floating objects with masses below the Deuterium-burning limit (; Zapatero Osorio et al. 2000; Lucas et al. 2005; Jayawardhana & Ivanov 2006; Luhman et al. 2008a), i.e. comparable to the masses of giant planets. Recently, Sumi et al. (2011) presented evidence for the existence of a population of unbound or distant Jupiter-mass objects in the field, that may have formed in proto-planetary disks and subsequently scattered. Nevertheless, current surveys in star forming regions are incomplete in the substellar regime, which is especially pronounced in the planetary-mass domain. Some of the deepest surveys are biased by design, either because they are based on mid-infrared data and thus will only find objects surrounded by dusty disks (e.g., Luhman et al. 2008a) or because they are carried out using narrow-band methane imaging, which probes only a specific range of spectral types (e.g., Haisch et al. 2010).
SONYC – Substellar Objects in Nearby Young Clusters – is an ongoing project to provide a complete census of the brown dwarf and planetary-mass object (PMO) population in nearby young clusters and to establish the frequency of substellar mass objects as a function of cluster environment. The survey is based on our own extremely deep optical- and near-infrared imaging, combined with the Two Micron All Sky Survey (2MASS) and photometry catalogs, which are combined to create catalogs of substellar candidates and used to identify targets for extensive spectroscopic follow-up. Our observations are designed to reach mass limits of and below, with the specific goal of probing the bottom of the IMF. So far, we have published results for three regions: NGC 1333 (Scholz et al., 2009, 2011), Ophiuchi (Geers et al., 2011), and Chamaeleon-I (Mužić et al., 2011).
Oph is one of the closest regions with active star formation. Its distance is estimated to be pc (de Geus et al., 1989). The main cloud, L1688, is a dense molecular core, with visual extinction up to 50 – 100 mag (Wilking & Lada, 1983). It hosts an embedded infrared cluster of around 200 stars, inferred to have a median age of 0.3 Myr, and surrounded by multiple clusters of young stars with a median age of 2.1 Myr (Wilking et al. 2005 and references therein). Currently, there are spectroscopically confirmed BDs in Oph (Wilking et al., 2008; Alves de Oliveira et al., 2010; Marsh et al., 2010; Geers et al., 2011). The current census is, however, likely incomplete due to strong and variable extinction. When compared to the other two SONYC targets NGC1333 and Cha-I, Oph suffers much stronger extinction (a few tens of magnitudes vs. mag). Oph is not as compact as NGC1333, but is more compact than Cha-I. Finally, Cha-I is slightly older than the other two clusters (2-3 Myrs vs. Myr).
In our earlier paper on Oph (Geers et al., 2011) we spectroscopically confirmed a previously unknown brown dwarf, and identified a number of new candidates based on Spitzer data. In this paper we present the results of a second round of spectroscopy, based on our photometric catalogs and candidate selection presented in the Geers et al. paper. We have obtained about 100 new spectra in L1688, using the multi-object spectrograph FMOS at the Subaru Telescope, and the integral-field spectrograph SINFONI at the ESO’s Very Large Telescope (VLT). This paper is organized as follows. Photometry and criteria for candidate selection are explained in Section 2, and the spectroscopic follow-up in Section 3. The results are presented in Section 4 and discussed in Section 5. Conclusions are summarized in Section 6.
2. Multi-band photometry and selection of candidates
Observations, data reduction, as well as the cross-correlation of the optical, near-infrared and Spitzer catalogs, are described in detail in Geers et al. (2011). Here we give a summary of the facilities and filters used for the observations, and the description of the photometric catalogs used to select candidates for the follow-up spectroscopy.
The optical images in the SDSS filter were obtained with the Subaru Prime Focus Camera (Suprime-Cam) wide field imager (Miyazaki et al., 2002). The Multi-Object Infrared Camera and Spectrograph (MOIRCS; Suzuki et al. 2008) at the Subaru telescope was used to observe Oph in the - and -bands. To increase the dynamic range of the survey in the near-infrared, we retrieved additional photometry from the 2MASS point-source catalog (Skrutskie et al., 2006). We also retrieved the Spitzer IRAC and MIPS photometry of Oph from the Legacy Program data archive available at the Spitzer Science Center, using the “High reliability catalog” (HREL) created by the “Cores to Disks” () Legacy team. The detection limit of our survey is at , , and mag. The completeness limits correspond to , , and mag.
To identify candidates for spectroscopy, we use two different selection procedures:
(1) We start with the catalog of common sources appearing in , , and catalogs.
Low-mass and BD candidates are selected as objects detected in all three bands, and
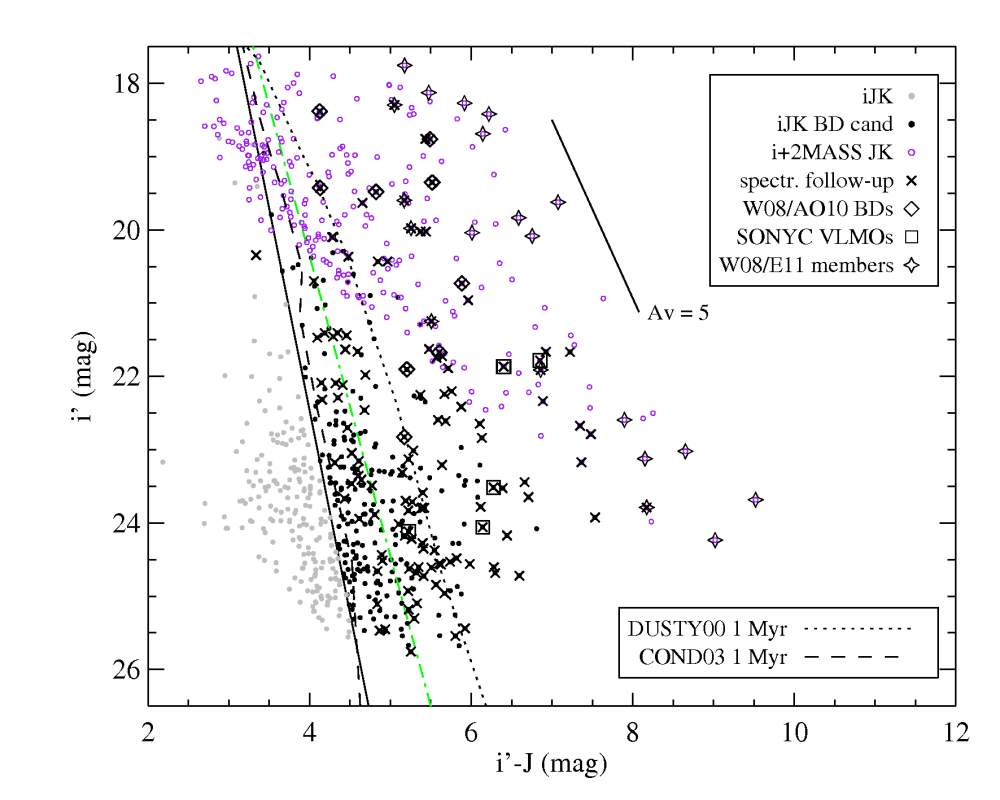
exhibiting a color excess in the (, ) color-magnitude diagram. These are objects
located to the right of the candidate selection cutoff line in Figure 2. This selection results in a catalog of 537 candidate sources
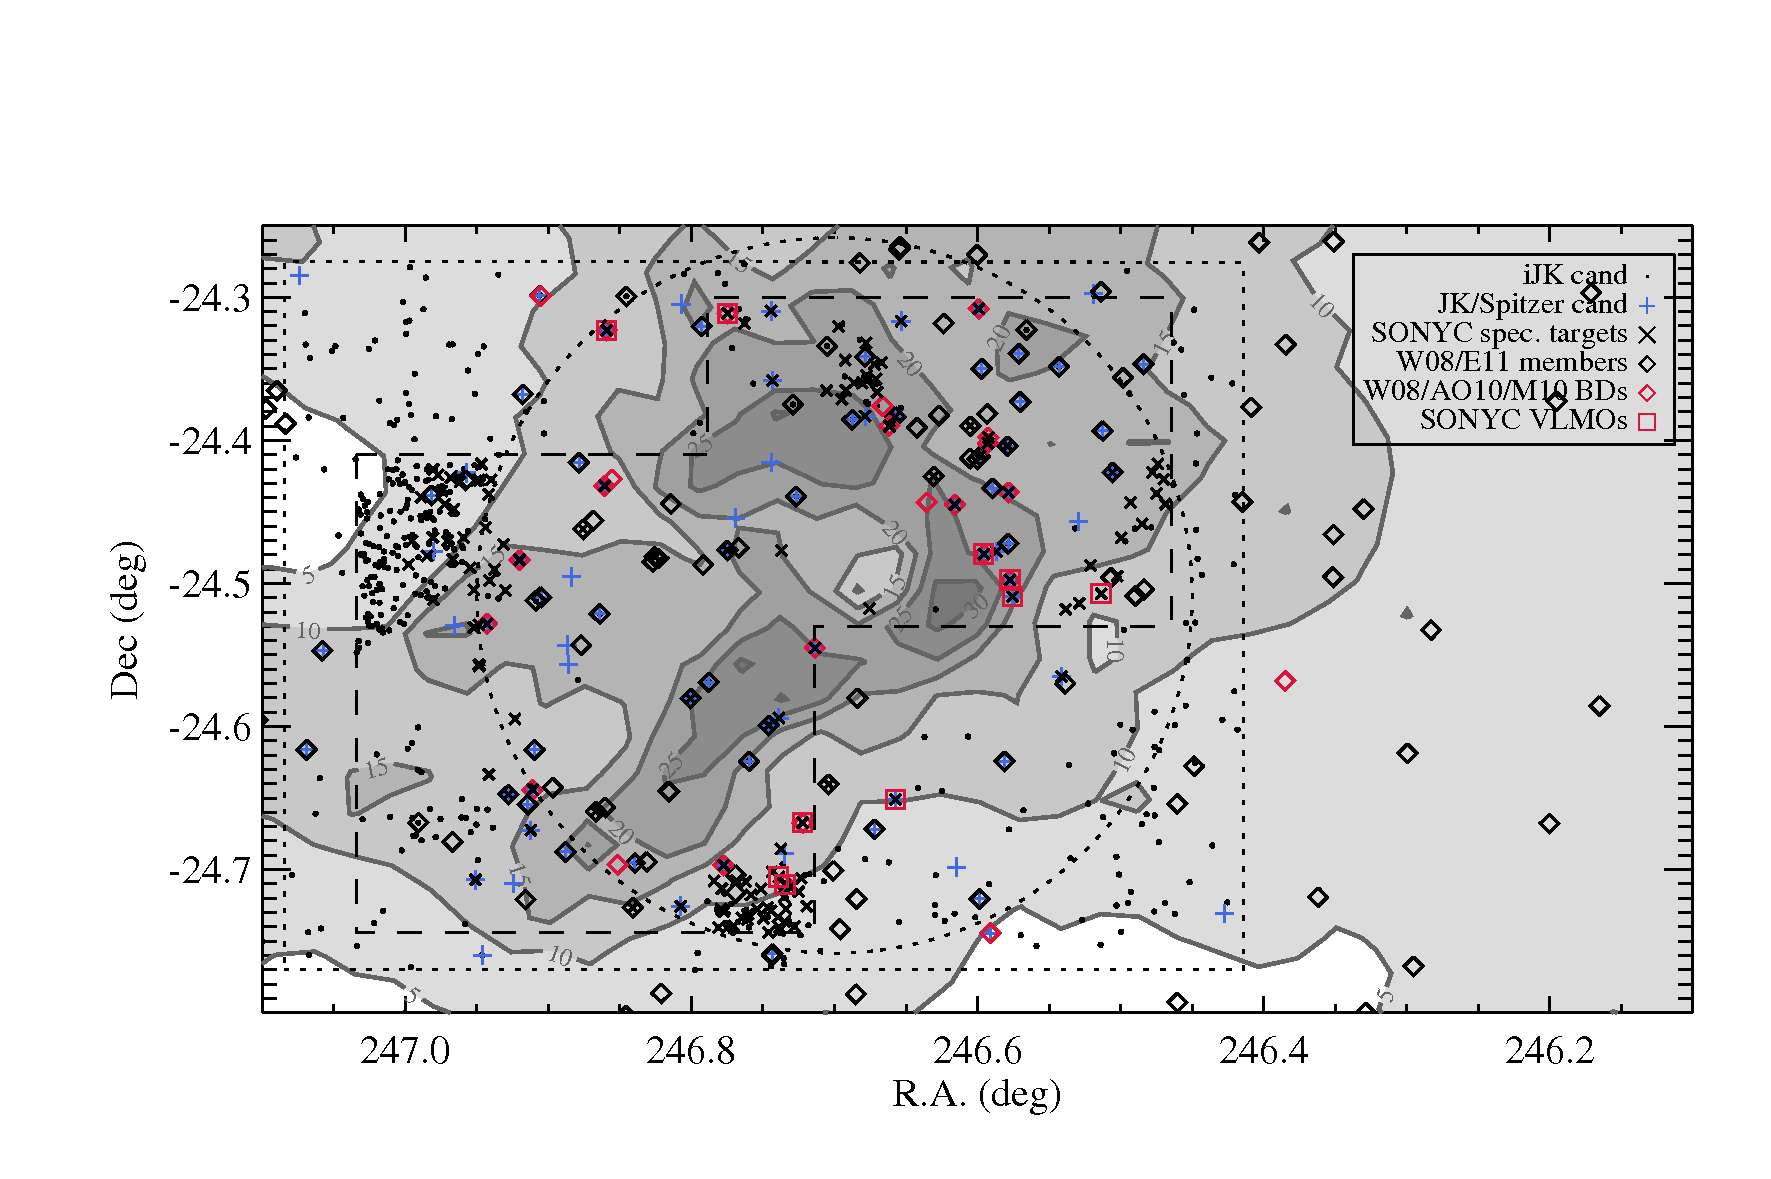
shown as dots in Figure 1. 309 of these sources come from the MOIRCS catalog (black circles in Figure 2), and the rest
from 2MASS (purple circles); and
(2) We cross-match catalogs with the catalog and select objects with IRAC colors consistent with or redder than sources with a circumstellar disk (Figure 6). selection yields 83
candidate members of Oph, within the boundaries of our optical survey. These objects
are marked with ’+’ in Figure 1. 26 of these are found to be BD candidates based on their near-infrared
magnitude and color, with 12/26 designated as spectroscopically confirmed BDs in the literature.
35 out of 83 candidates from the list have an optical counterpart. 33/35 are also identified as candidates in the selection, while the remaining two are located to the left of the candidate selection line in Figure 2. We obtained a spectrum for one of these two sources, and found that it is probably not a member of Oph. We note that the majority (32) of the 35 overlapping candidates are part of the 2MASS-based catalog, and only 3 are from the MOIRCS candidate selection.
3. Follow-up spectroscopy
In our first spectroscopy run in May 2009, we used MOIRCS/Subaru to obtain the spectra of 58 BD candidates selected from our catalog, and one previously known BD candidate member (Geers et al., 2011). The 58 selected candidates all come from the catalog based on the MOIRCS photometry (309 objects). During 2010 we were awarded time at the Subaru Telescope and the VLT that allowed us to obtain spectra of 100 additional substellar candidates in Oph. These new observations, data reduction and number statistics of the observed candidates from the two catalogs are presented in this section. Candidates with spectroscopic follow-up are marked with crosses in Figure 2 and squares in Figure 6.
3.1. FMOS/Subaru
We obtained spectra in the near-infrared - and -bands (0.9 – 1.8 m) using the Fiber Multi Objects Spectrograph (FMOS) at the Subaru Telescope (Kimura et al., 2010). The fiber positioner system of FMOS configures 400 fibers in the 30-arcmin diameter field of view, and the spectra are extracted by the two spectrographs (IRS1 and IRS2). Our data were obtained during the S10A semester in a shared-risk mode, using only one of the spectrographs (IRS1; 200 fibers) in the low-resolution mode (R ). Data reduction was carried out using the software package supplied by Subaru during the observing run. The package consists of IRAF tasks and C programs using the CFITSIO library. The recommended telluric standards for FMOS are stars of spectral type F, G or early K, at a known (and preferably low) extinction. As the stars in our science field suffer strong extinction, we observed an additional field at the same average airmass as Oph, containing several G0V stars that were used for telluric correction.
We observed Oph during the two nights of June 2010, and obtained in total 81 spectra. 14 of the objects came from the candidate list, 46 from the -based candidate selection, and the remaining fibers were placed on a number of known members of spectral type K and M, to serve as a reference. We note that the candidate selection is based only on the MOIRCS catalog (309 objects).
3.2. SINFONI/VLT
The spectra of 13 objects from the candidate list were obtained using the integral-field spectrograph SINFONI at the ESO/VLT, in the - and -bands (program ID 385.C-0450). Two of the objects have also been observed with FMOS. The observations were carried out one object at a time, using the largest available FOV offered by SINFONI () and in the no-AO mode. The spectral resolution delivered by the H+K setting of the instrument is R . Data reduction was performed using the SINFONI pipeline supplied at ESO. Telluric correction was performed with the help of standard stars observed before and after our targets. Standard stars were all of the early B-type, which exhibit a large number of hydrogen lines throughout the - and -bands. Some of the lines can be manually removed from the standard-star spectra (e.g. Br, Br 10, Br 11), while others appear blended with the telluric features and thus cannot be easily removed. Some residuals due to uncorrected hydrogen lines appear in our spectra, but do not affect the results, as we are interested only in broad features. These residuals mainly mimic emission lines in the 1.55 – 1.65 m region in some of the SINFONI spectra.
4. Spectral analysis
4.1. Spectral fitting procedure
The spectral analysis is identical to the one presented in Scholz et al. (2009) and Geers et al. (2011). Spectra of young objects later than M5 show a characteristic broad peak in the -band (Cushing et al., 2005). The feature is caused by water absorption on both sides of the -band and its depth depends strongly on effective temperature. While the -band peak appears round in old field dwarfs, it is unambiguously triangular in young, low-gravity sources (e.g. Brandeker et al., 2006; Kirkpatrick et al., 2006). In addition, young BDs are expected to have flat or increasing -band spectra with CO absorption bands at m, and a sharp drop in flux at the edge of the -band (m), again due to water absorption.
The spectra were first assessed through visual inspection. Very noisy spectra ( of all spectra) and those lacking the above mentioned features characteristic for BDs ( of all spectra) are discarded. The latter sources exhibit smooth, featureless spectra, which make it difficult to constrain their nature. The majority of these objects are expected to be background late-type giant or dwarf stars. Some of them could be embedded YSOs with spectral types earlier than M, although we do not have any evidence for youth. This selection yields 21 VLM candidates.
In a second step, we estimate the effective temperatures of the selected VLM candidates by fitting model spectra from the DUSTY series (Allard et al., 2001), following the procedure outlined in Scholz et al. (2009). Since extinction and effective temperature are difficult to determine separately with low-resolution, low signal-to-noise spectra, we started by adopting the as determined from the colors, assuming an intrinsic BD photospheric color of 1 mag. We apply the extinction law from Cardelli et al. (1989), assuming = 4. We vary the effective temperature from 1800 K to 3900 K, in steps of 100 K, keeping the extinction at a fixed value. The best fit temperature is determined from a analysis. Although in almost all cases this procedure results in a decent match between the observed spectra and the best-fit models, we note that small adjustments to the value of the extinction () can slightly improve the quality of the fit. This adjustment is determined by changing in steps of 1 around the value derived from the color, rounded to the closest integer. For 21 out of 23 entries in Table 1 either a zero or a small adjustment (up to =2) is required, while in the remaining two cases results in a better fit. Both values of are listed in Table 1.
As demonstrated in Scholz et al. (2009), it is often difficult to reliably distinguish between two models with . However, for there are discernible differences between models and observations, combined with a clear increase in . Thus, a conservative estimate for a typical uncertainty in is K. In cases where an equally good fit is obtained using two models separated by 100 K, as the best-fit in Table 1 we list the average value, while in Figures 3 and 4 we plot the model with the lower . Although the temperature fitting grid extends up to 3900 K, we note that our fitting scheme does not work that well above 3200 K. The reason is the shape of the H-band peak that becomes flat, making it difficult to discriminate between the models at higher temperatures. The situation is further complicated by high extinctions typically encountered in the Oph region. We find spectra of three objects to be consistent with effective temperatures of 3200 K or somewhat above. We set 3200 K as a lower temperature limit for these objects in Table 1.
4.2. Results of the spectral fitting
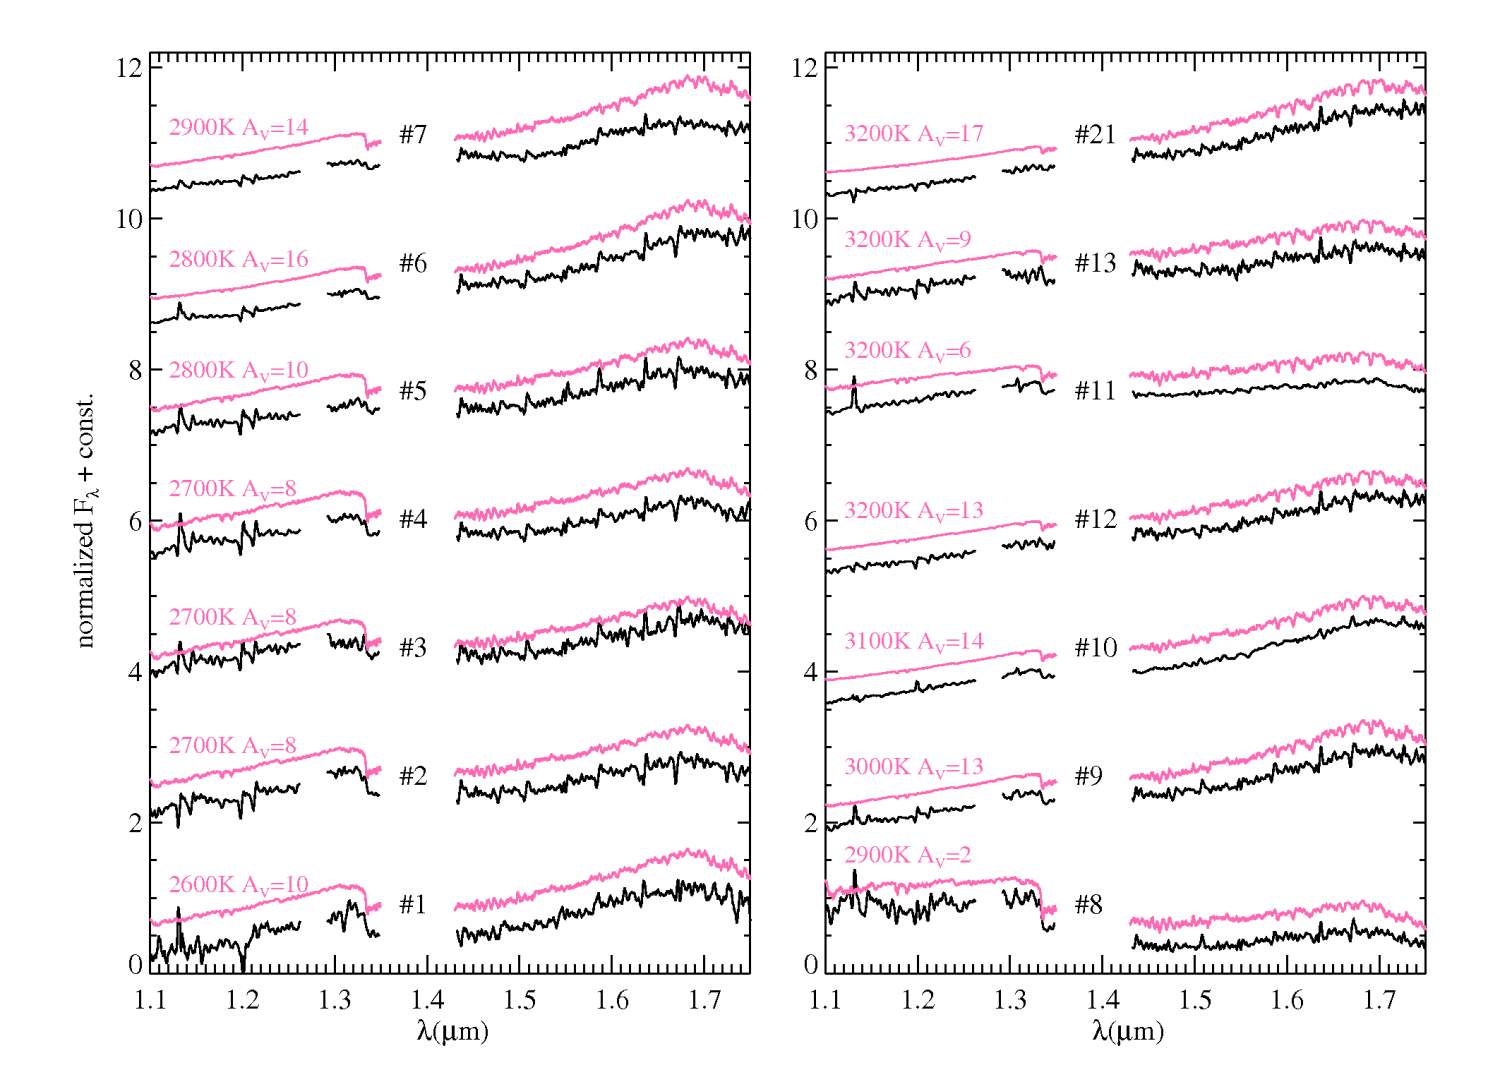
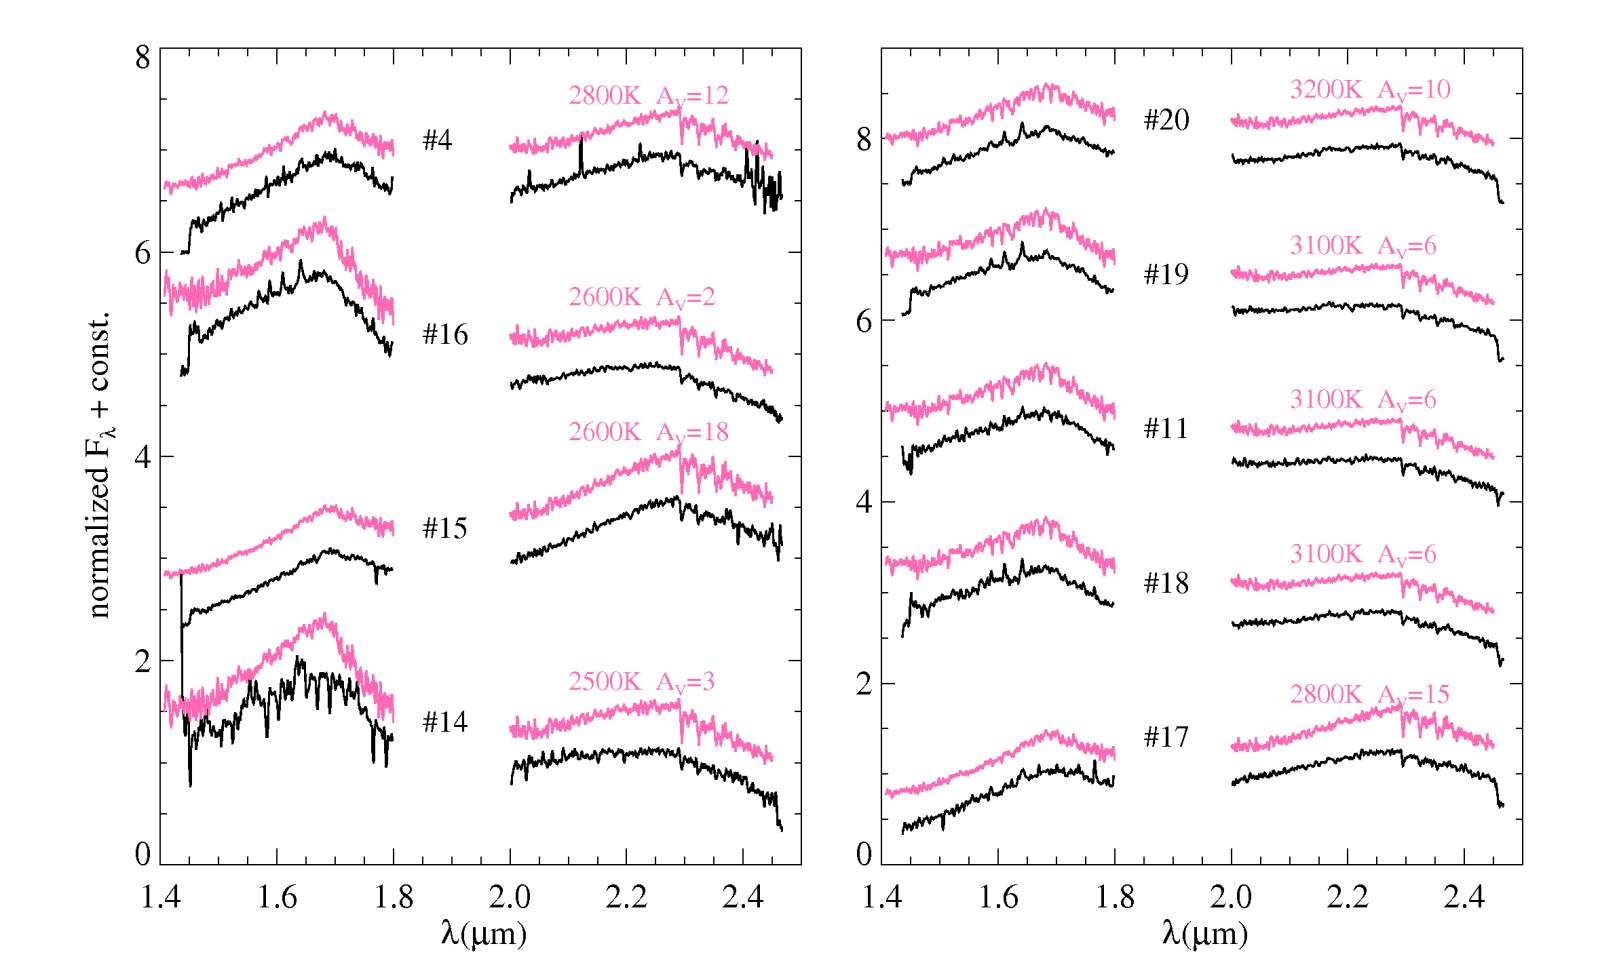
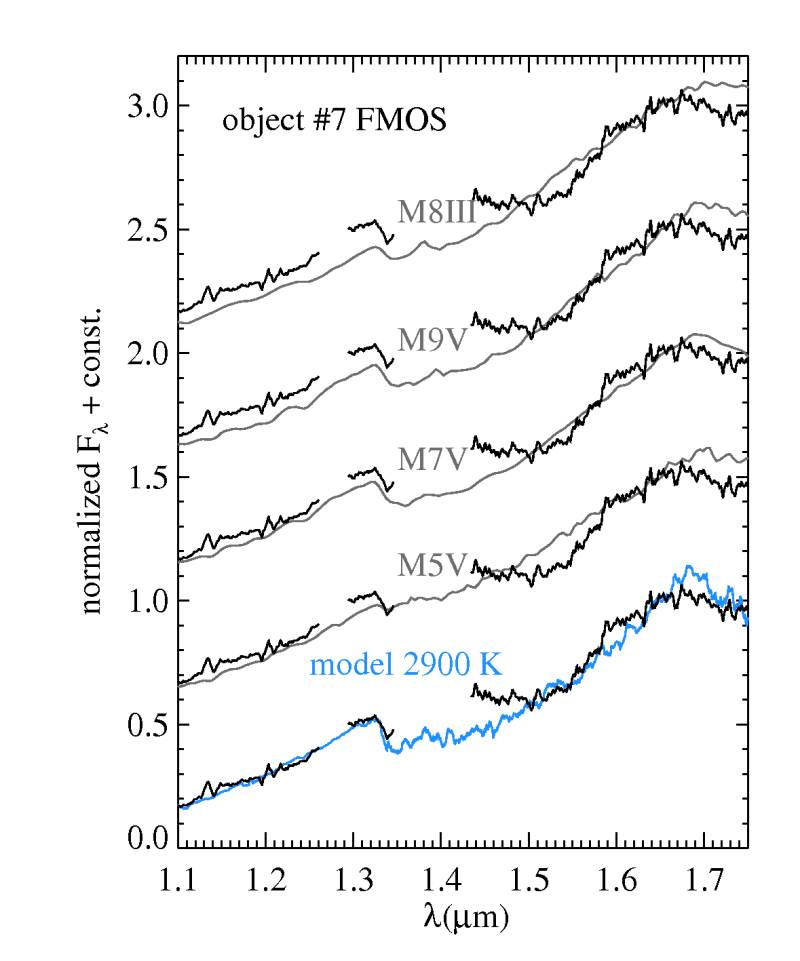
The spectra of 21 BDs and very-low-mass objects (VLMO) are shown in Figure 3 (FMOS) and Figure 4 (SINFONI). Two objects appear in both datasets (4 and 11), The best fit resulting from the two independent fits are consistent, differing by only 50 K and 100 K, respectively. Spectra are shown in black and the best-fit models in color. For clarity, the models are slightly offset from the spectra. Both models and spectra have been smoothed with the boxcar function of 30 Å prior to plotting, to make it easier to appreciate the quality of the broad-band fit. The 21 BDs and VLMOs with SINFONI and/or FMOS spectra are listed in Table 1, including the best model fit parameters.
Our observations result in 13 probable substellar members (defined here as objects with K) and 8 very-low-mass stars (3000 K K). Among these objects, we report 6 new likely BDs and 2 new very-low-mass stars. We label those objects SONYC-RhoOph-3 to 10, following the nomenclature of Geers et al. (2011) who published the first two discoveries. The six new BDs have effective temperatures between 2600 K and 3000 K, which, according to the 1Myr DUSTY and COND isochrones, correspond to the masses between 0.03 M⊙ and 0.1 M⊙.
The H-band spectrum of the object (SONYC-RhoOph-5) appears to have a slightly rounded shape when compared to the spectra of other objects in Figure 3. However, neither the comparison with the spectra of field dwarfs or giants provides a satisfactory match with the observed spectrum (see Figure 5). The source is detected in all four IRAC bands and shows a clear mid-IR excess: with II2 and II4 , it resides within the class-II object area in Figure 6. We thus conclude that SONYC-RhoOph-5 is a probable new BD member of the cluster.
The H-band peak around 1.68m in the spectrum of the object might not appear as sharp as expected for a young BD with K, but this can be attributed to the strong noise in this spectrum. In Alves de Oliveira et al. (2010) one can clearly see that this source exhibits the sharp H-band peak characteristic for young BDs. They classify the source as M8.25, which is consistent both with the effective temperature obtained from our fits, and the spectral type derived from various indices (see Section 4.3 and Table 2).
In this paper and in previous papers of the SONYC series, we have chosen to draw a line between the stellar and substellar regime either at K or at SpT = M6. According to the COND03 and DUSTY models, a 1 Myr old object at the substellar boundary will have an effective temperature of about 3000 K. In the scale defined by Luhman et al. (2003), this limit corresponds to a spectral type M6. However, the relation between the effective temperature and spectral type for young VLMOs is not that well established. There are two objects that have at least once been classified as brown dwarfs in the literature (M6 or later) and that we do not define as substellar. The first one is the source which we find to have K. Wilking et al. (1999) and Luhman & Rieke (1999) classify this source as M7 and M6.5, respectively. Based on our fits, we identify this source a very-low-mass star, rather than a BD.
The second object where we find discrepancy with the literature classification is found at (, )2000=(16:26:31.36, -24:25:30.2) and was classified as M6 by Wilking et al. (1999) from the NIR data, but also as M5 (NIR; Luhman & Rieke 1999) and M3.75 (optical, Wilking et al. 2005). We find the H-band spectrum to be much flatter than in BD spectra, resulting in clearly above 3200 K. Thus, we discard this object as a potential BD, and conclude that our spectrum is more consistent with the earlier spectral classification from the literature.
| # | (J2000) | (J2000) | insaaInstrument used for spectroscopy. F: FMOS/Subaru, S: SINFONI/VLT | AVbbVisual extinction in magnitudes, and calculated from color, assuming the intrinsic of 1. | AVccBest-fit extinction from spectral fitting, in magnitudes. | (K) | SpT | RefddSpectral-type references: [1] Wilking et al. (1999); [2] Luhman & Rieke (1999); [3] Natta et al. (2002); [4] Luhman et al. (1997); [5] Cushing et al. (2000); [6] Wilking et al. (2005); [7] Alves de Oliveira et al. (2010) [8] Wilking et al. (2008). | name(s)eeReferences for identifiers: GY: Greene & Young (1992); CFHTWIR: Alves de Oliveira et al. (2010); CRBR: Comeron et al. (1993); ISO-Oph: Bontemps et al. (2001). |
|---|---|---|---|---|---|---|---|---|---|
| 1 | 16 26 03.28 | -24 30 25.8 | F | 8.4 | 10 | 2650 | SONYC-RhoOph-7 | ||
| 2 | 16 27 05.93 | -24 18 40.2 | F | 7.8 | 8 | 2700 | SONYC-RhoOph-6 | ||
| 3 | 16 27 38.63 | -24 38 39.2 | F | 6.6 | 8 | 2750 | M8.5, M7, M6 | 1 2 3 | GY310 |
| 4 | 16 26 22.27 | -24 24 07.1 | F | 9.7 | 8 | 2750 | M6.5, M8.5 | 1 3 | GY11 |
| 4 | 16 26 22.27 | -24 24 07.1 | S | 9.7 | 12 | 2800 | M6.5, M8.5 | 1 3 | GY11 |
| 5 | 16 26 18.82 | -24 26 10.5 | F | 9.4 | 10 | 2850 | M7.5, M5.5, M7 | 1 2 3 | CRBR 14; ISO-Oph-23 |
| 6 | 16 26 18.98 | -24 24 14.3 | F | 17.6 | 16 | 2850 | M5 | 1 2 | CRBR 15 |
| 7 | 16 26 22.96 | -24 28 46.1 | F | 13.2 | 14 | 2900 | SONYC-RhoOph-5 | ||
| 8 | 16 26 51.28 | -24 32 42.0 | F | 2.3 | 2 | 2900 | M8, M8.5 | 5 4 | GY141 |
| 9 | 16 26 53.35 | -24 40 02.3 | F | 12.4 | 13 | 3000 | SONYC-RhoOph-3 | ||
| 10 | 16 26 22.19 | -24 23 52.4 | F | 13.8 | 14 | 3100 | M8.5, M6.5 | 1 2 | GY10 |
| 11 | 16 26 27.81 | -24 26 41.8 | F | 6.4 | 6 | 3200 | M5, M6 | 6 1 | GY37 |
| 11 | 16 26 27.81 | -24 26 41.8 | S | 6.4 | 6 | 3100 | M5, M6 | 6 1 | GY37 |
| 12 | 16 26 18.14 | -24 30 33.0 | F | 14.7 | 13 | 3200 | SONYC-RhoOph-4 | ||
| 13 | 16 27 46.29 | -24 31 41.2 | F | 8.3 | 9 | 3200 | M6 | 3 | GY350 |
| 14 | 16 27 40.84 | -24 29 00.7 | S | 3.1 | 3 | 2550 | M8.25 | 7 | CFHTWIR-Oph96 |
| 15 | 16 26 18.58 | -24 29 51.4 | S | 15.0 | 18 | 2600 | SONYC-RhoOph-8, CFHTWIR-Oph16 | ||
| 16 | 16 27 26.58 | -24 25 54.4 | S | 0.9 | 2 | 2650 | M8 | 6 | GY264 |
| 17 | 16 27 26.22 | -24 19 23.0 | S | 13.6 | 15 | 2800 | SONYC-RhoOph-10; CFHTWIR-Oph78 | ||
| 18 | 16 26 37.81 | -24 39 03.2 | S | 6.2 | 6 | 3100 | SONYC-RhoOph-9; CFHTWIR-Oph31 | ||
| 19 | 16 27 06.60 | -24 41 48.8 | S | 3.7 | 6 | 3150 | M5.5, M6 | 6 3 | GY204 |
| 20 | 16 26 23.81 | -24 18 29.0 | S | 8.2 | 10 | 3200 | M6.7, M7 | 5 8 | CRBR 31 |
| 21 | 16 27 05.98 | -24 28 36.3 | F | 14.7 | 17 | 3200 | M7, M6.5 | 1 2 | GY202 |
Note. — Based on AMES-Dusty models (Allard et al., 2001)
4.3. Spectral type indices
| Spectral Type | |||
|---|---|---|---|
| # | HPIaaDerived from the HPI index (Scholz et al., 2011) | QbbDerived from the Q-index (Wilking et al., 1999; Cushing et al., 2000). | H2OccDerived from the H2O-index (Allers et al., 2007) |
| 1 | M9.7 | M9.6 | |
| 2 | M8.6 | M6.9 | |
| 3 | M8.3 | M6.6 | |
| 4 | M8.5, M8.0 | M6.1 | M6.6, M7.8 |
| 5 | M8.5 | M8.0 | |
| 6 | M8.0 | M5.7 | |
| 7 | M7.4 | M5.7 | |
| 8 | M8.0 | M6.3 | |
| 9 | M7.5 | M5.1 | |
| 10 | M7.4 | M5.5 | |
| 11 | M7, M7.1 | M5.8 | M5, M5.8 |
| 12 | M7.0 | M5.0 | |
| 13 | M7.1 | M5 | |
| 14 | M9.3 | M7.1 | |
| 15 | M9.1 | M8.7 | M8.0 |
| 16 | M8.6 | M8.0 | M8.0 |
| 17 | M7.8 | M6.2 | M8.4 |
| 18 | M7.0 | M6.8 | M5.4 |
| 19 | M7.1 | M5.9 | M6.4 |
| 20 | M7.0 | M6.6 | M5.7 |
| 21 | M7 | M5 | |
In this section we attempt to assign spectral types to the VLMOs from our survey, based on various
indices suggested in the literature. The SINFONI spectra are particularly suited for a comparison of different methods,
thanks to the spectral coverage, resolution, and overall quality
of the spectra. We determine spectral types based on the following three indices:
(1) H-peak index (HPI) defined by Scholz et al. (2011) and based on the ratio between the average
fluxes in m and m wavelength regions. The HPI takes advantage of the slope on the blue side
of the H-band peak observed in late-M and L-type objects, and is related to the spectral type as
SpTHPI.
The index is highly sensitive to the spectral type
in the M7 regime, but cannot be used reliably for earlier spectral types where
the slope of the feature becomes too shallow.
(2) Q-index defined in Wilking et al. (1999) as .
F1, F2, and F3 are the average values of the relative
flux densities computed in the three bands , , and m, respectively.
The useful portion of our SINFONI spectra extends only to m. As evident from Figure 4, the
continuum of the spectra longward of m can be approximated by a linear function. We fit a linear function
to the wavelength range m (m in case of the object ) and extrapolate to the m
region. We use and the relation derived for Oph by Cushing et al. (2000, Eq. 1 and 2).
(3) The -index proposed by Allers et al. (2007, Eq. 1). This index is defined as the ratio between the average
fluxes in m and m wavelength regions, and is linearly dependent on spectral
type between M5 and L0.
All spectra have been extinction corrected using the best-fit value of extinction obtained from our model
fits (see Section 4), and assuming the extinction law from Cardelli et al. (1989).
The spectral types resulting from the three indices are shown in Table 2.
The wavelength coverage of the FMOS data does not extend to the K-band, and thus
they cannot be used
to calculate the Q-index.
For the object , one of the narrow band regions used to calculate the -index coincides with
a strong noise feature, which prevent us to use this index to derive a reliable spectral type.
For the objects and , we list spectral type estimates based on their FMOS and SINFONI spectra, in that order.
We can make a comparison between the spectral types derived from different indices, excluding those where we only list the limits on the spectral type. The quoted uncertainties for the spectral types derived from the three indices are for HPI (Scholz et al., 2011), for the H2O-index (Allers et al., 2007), and for the Q-index (Wilking et al., 1999). When comparing the HPI-derived values with those based on the other two indices, we find that our spectral type scheme gives systematically later spectral types (in all cases except one). On average, the difference between the HPI and H2O spectral types is 1.3. The difference is more pronounced for the FMOS data: the average value is 1.6, while for the values derived from the SINFONI data we get better agreement (0.9 spectral types). This can probably be attributed to the better spectral resolution and signal-to-noise of the SINFONI data. The average difference between the HPI and Q-index spectral types is 1.1.
We tested the effect that uncertainties in the fitted have on the derived spectral types. A change in the extinction of results in subtypes, for the spectral types derived from the HPI and the -index, while the Q-index is esentially reddening-independent. The change in the affects the HPI and spectral types for our sample objects in a similar way. A possible explanation for the discrepancies between spectral types derived from the HPI and other two indices might be in the extinctions of the sample from which HPI was derived. HPI was derived for objects with low extinction, i.e. the extinction correction was less problematic. The majority of our objects in Oph are at large extinctions, which will introduce additional uncertainty to the spectral type as derived from the HPI. On the other hand, the sample that was used to derive the index covers a larger range of extinctions.
Given the uncertainties, we conclude that the spectral types derived from the different indices are in agreement, with the HPI spectral types being systematically later by about one spectral subtype from the values derived from the other two indices.
5. Discussion
5.1. Objects with mid-infrared color excess
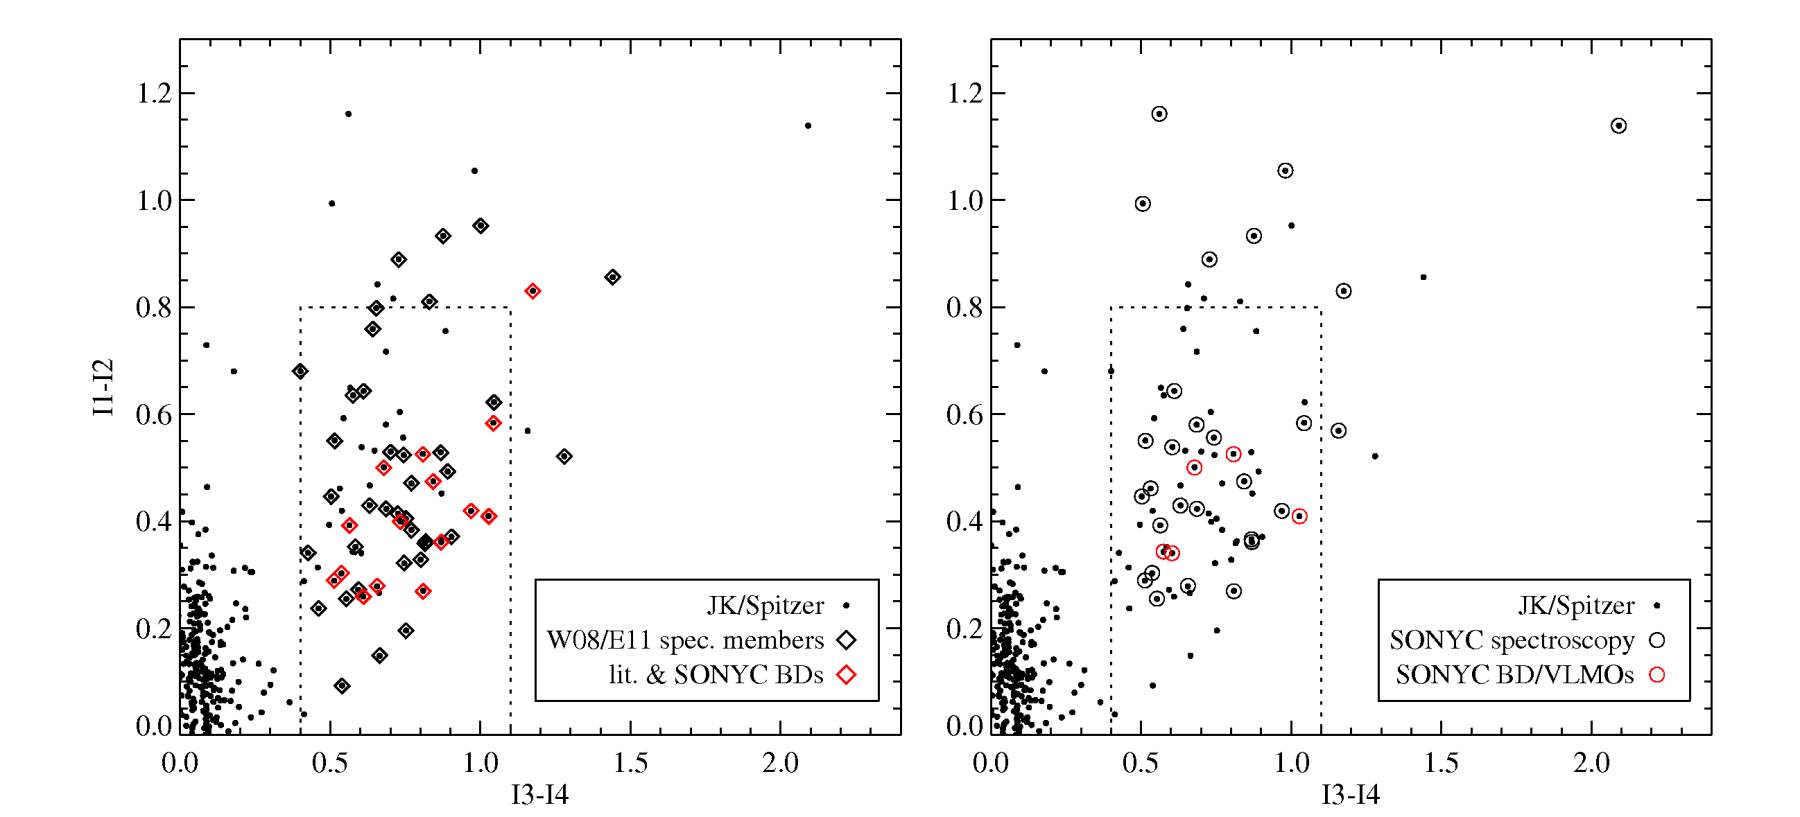
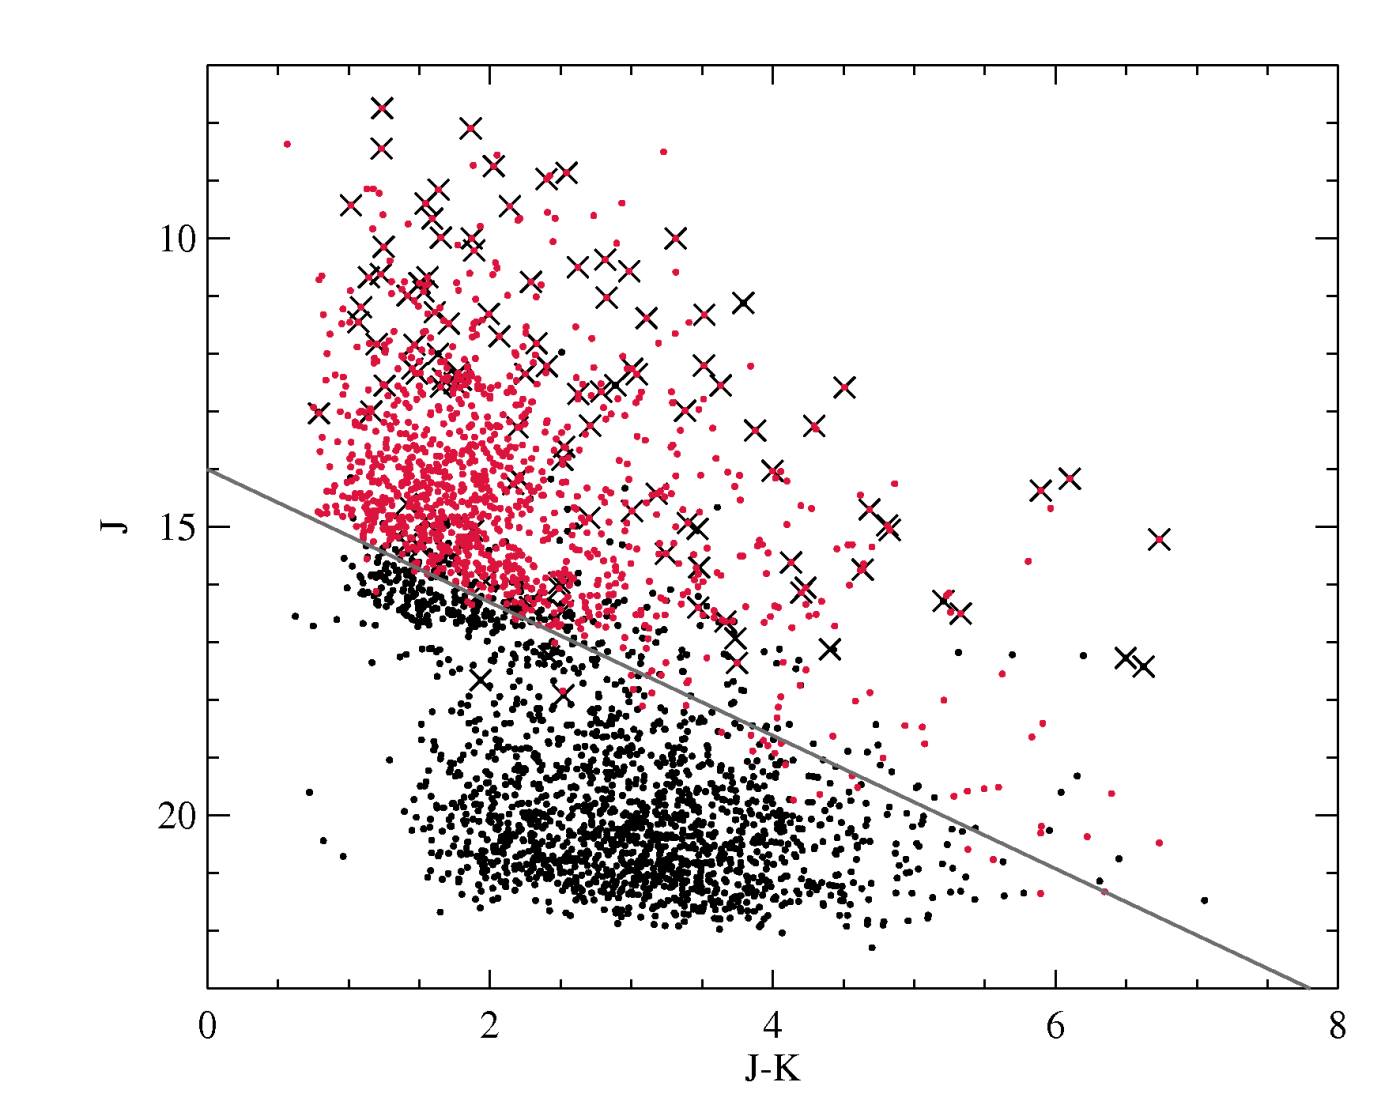
Figure 6 shows a color-color diagram constructed from Spitzer IRAC photometry. The dashed line denotes the area where class II objects are located, based on Allen et al. (2004). For 83 objects, the IRAC colors are consistent with or redder than sources with a circumstellar disk, here defined as (I3 - I4) and (I1 - I2) . 46 of these objects appear in the list of spectroscopically confirmed Oph members (diamonds; Wilking et al. 2008). 33 objects have been observed in the framework of SONYC (black squares). The two samples have 19 objects in common. There are 12 spectroscopically confirmed brown dwarfs from Wilking et al. (2008) and Alves de Oliveira et al. (2010) and 3 identified in this work appearing in this plot. There are 18 objects with Spitzer excess that, to our knowledge, do not have available spectra (objects shown only as crosses to the right of (I3 - I4) = 0.4 in Figure 6).
Of 83 candidate members with mid-infrared excess, 65 have been either observed by us, or have been spectroscopically confirmed as members in the literature. 15 of them have spectral type later than M5 or estimated effective temperature at or below 3000 K. Thus, we conclude that the number of missing brown dwarfs in this sample is . Of course, the total number of missing substellar objects in Oph is probably much higher. Our estimate is valid only for the objects with disks (i.e. exhibiting MIR excess), and down to a certain limit in mass and extinction. This limit is primarily imposed by the sensitivity of the Spitzer data. The solid line in Figure 7 shows the approximate limit of the combined catalog. It corresponds to at and at , based on COND03 (Baraffe et al., 2003) and DUSTY00 (Chabrier et al., 2000) evolutionary models.
Based on the ISOCAM survey of the main Oph core, Bontemps et al. (2001) find that the fraction of objects with disks among the embedded cluster YSO population is . From a small sample of 9 BDs, Jayawardhana et al. (2003) calculate the disk fraction among the BD population of . The number of the missing BDs with disks in our sample is . Accounting for the disk fraction, we estimate that the total number of missing BDs .
5.2. Substellar population in Oph
Based on the results of our survey, and combined with literature data, we can try to put limits on the total number of substellar objects in Oph. However, we must note that Oph, with its high and strongly varying extinction, is a difficult field to search for BDs. All current surveys, including SONYC, have to be considered incomplete.
SONYC was designed to mitigate selection biases that are typically induced by commonly used mid-infrared-based surveys (sources with discs), or narrow-band methane surveys (T-dwarfs). Our primary means of selecting candidates for spectroscopy is broad-band optical and near-infrared imaging that aims to detect the photosphere. This selection is clearly not effective in the areas with high extinction, and is also significantly affected by the background contamination. However, in an attempt to get an estimate of the number of missing substellar objects in our survey area, without being biased towards the disk objects, we base the following discussion only on the optical-NIR candidate selection.
Figure 2 shows the (, ) color-magnitude diagram for all the sources from our catalogs. Black circles show 309 candidates from the MOIRCS selection, while purple open circles show sources with photometry from 2MASS. Crosses show SONYC spectroscopic targets, with confirmed VLMOs shown as squares. Among the SONYC VLMOs, the object found at , is identified as a low-mass star, while the remaining five are BDs. We also show spectroscopically confirmed stellar members (stars) and BDs (diamonds) from the literature. Distribution of the objects with spectra and confirmed substellar member candidates shows that the criterion used for the candidate selection is fairly conservative.
Candidates from the optical-NIR selection that have been spectroscopically followed up come from the catalog based on the MOIRCS photometry. This candidate list contains 309 objects. We have obtained spectra for 102 of these objects. Five were confirmed as likely BDs. Thus, the spectroscopic follow-up suggests that our catalog could contain additional BDs. This number might actually be smaller because, as evident from Figure 2, the confirmed BDs tend to be located to the right of the DUSTY00 1 Myr isochrone. Based on this observation it might be reasonable to shift the selection cutoff line slightly towards the right (green dash-dotted line). The probability of finding any new members in the strip between our old selection line and the new one is expected to be very low. The new selection cutoff was chosen to lie approximately at the same distance from the two isochrones shown in Figure 2. The new candidate list then contains 151 objects, 75 of which have spectra. The expected number of missing BDs is then .
The combined catalog is shallower than the -band catalog and its completeness limit is at . The majority of the optically selected candidates lie in the area with low extinction (see Figure 1): 89% of the candidates are located at , as judged from the COMPLETE map. However, as shown in Figure 5 of Geers et al. (2011), all objects from the MOIRCS catalog, with the exception of only two sources, probably suffer optical extinctions of less than 15. The extinction for each source was calculated based on the observed colors, assuming an intrinsic of 1. Thus, even in the regions with apparently large extinction, our optical-NIR observations seem to be penetrating the cloud only down to a certain depth, corresponding to of about 15. The completeness limit of corresponds to masses for , according to the DUSTY00 and COND03 models for 1 Myr old objects at the distance of Oph. We conclude that the number of missing objects in our survey area down to this mass and extinction limit is 5-10. This number should be added to the number of missing objects estimated from the data in Section 5.1. The analysis presented in this section is based on the 309-candidate MOIRCS catalog and does not include the 2MASS selection. The candidate selection is, on the other hand, almost entirely based on the 2MASS JK photometry (72/83 candidates). In Figure 7, the candidates are mostly found above the grey line, while of the MOIRCS candidates lie below it. The two catalogs overlap for only 3 objects.
In summary, we conclude that the number of missing substellar objects in our survey area is 12-17. The actual number of missing substellar objects is probably higher, as we certainly might be missing objects at lower masses and higher extinctions.
5.3. Ratio of stars to brown dwarfs
Based on the currently available data we can put constraints on the ratio of the number of low-mass stars to the number of BDs in our survey area. Andersen et al. (2008) use a mass range for stars and for BDs; we call this ratio . Other authors use for stars and for BDs, hereafter called (Briceño et al., 2002; Muench et al., 2002; Luhman et al., 2003).
The two most complete estimates of the stellar population in Oph are those from Bontemps et al. (2001) and Wilking et al. (2008). Bontemps et al. (2001) report 123 Class II YSOs, 95 of which are located within the borders of our optical survey. From their Figure 8, we infer 80 YSOs in the mass range , and 84 in the mass range . We scale these numbers with the fraction of all sources located in our FOV (95/123), and correct for the binary fraction of about (Ratzka et al., 2005). The number of stars in our FOV is then and for mass ranges and , respectively. From the member list in Wilking et al. (2008) we discard objects with spectral type M6 or later, restrict the coordinates to match the area covered by our survey, add the three VLMOs discovered in the framework of SONYC, and four stellar-mass members recently identified by Erickson et al. (2011). We count 86 low-mass stars with spectral type estimates between G2 and M6 (i.e. with masses between 0.08 and 1 , and 90 stars in the mass range .
There are currently 26 spectroscopically confirmed probable BDs within the borders of our survey (20 previously known and 6 found in this work).
We calculated absolute J-band magnitudes for the sample of BDs using the estimated from colors, reddening law from Cardelli et al. (1989), and by assuming the distance of 125 pc. We then compare the results with the COND03 and DUSTY00 1 Myr isochrones. There are 21 objects with , and 23 with . Among these there are 8 objects for which we obtain mass estimates above ; 7 come from the list of Wilking et al. (2008) and one is our object SONYC-RhoOph-5. All of these objects have spectral type around M6, i.e. they lie around the boundary separating low-mass stars from BDs. Considering that the mass estimates are subject to a number of uncertainties (arising from the uncertainties in cluster distance, age, extinction, photometry, effective temperature, and the models themselves), all of these 8 objects could in fact be either low-mass stars or BDs.
Thus, for the calculation of the ratios and , we assume the following numbers:
(1) stars with : ,
(2) stars with : ,
(3) BDs with : ,
(4) BDs with : .
To calculate the ratios and we adopt the mean values of the intervals specified above. A reasonable indication of statistical uncertainties associated with these numbers is provided by Poisson statistics, i.e. we assume the standard deviation , where stands for the mean of each interval.
Finally, we arrive at and . This result is in line with the values from the literature (3.3 - 8.5; Andersen et al. 2008), although higher than the value observed in NGC1333 (; Scholz et al. 2011), and in the ONC (; Andersen et al. 2011). Note that the values quoted here and in Andersen et al. (2008) should be treated as upper limits. The total number of BDs is certainly higher than the values given above due to the lower mass cutoff set at and the missing BDs.
5.4. Spatial distribution and disks
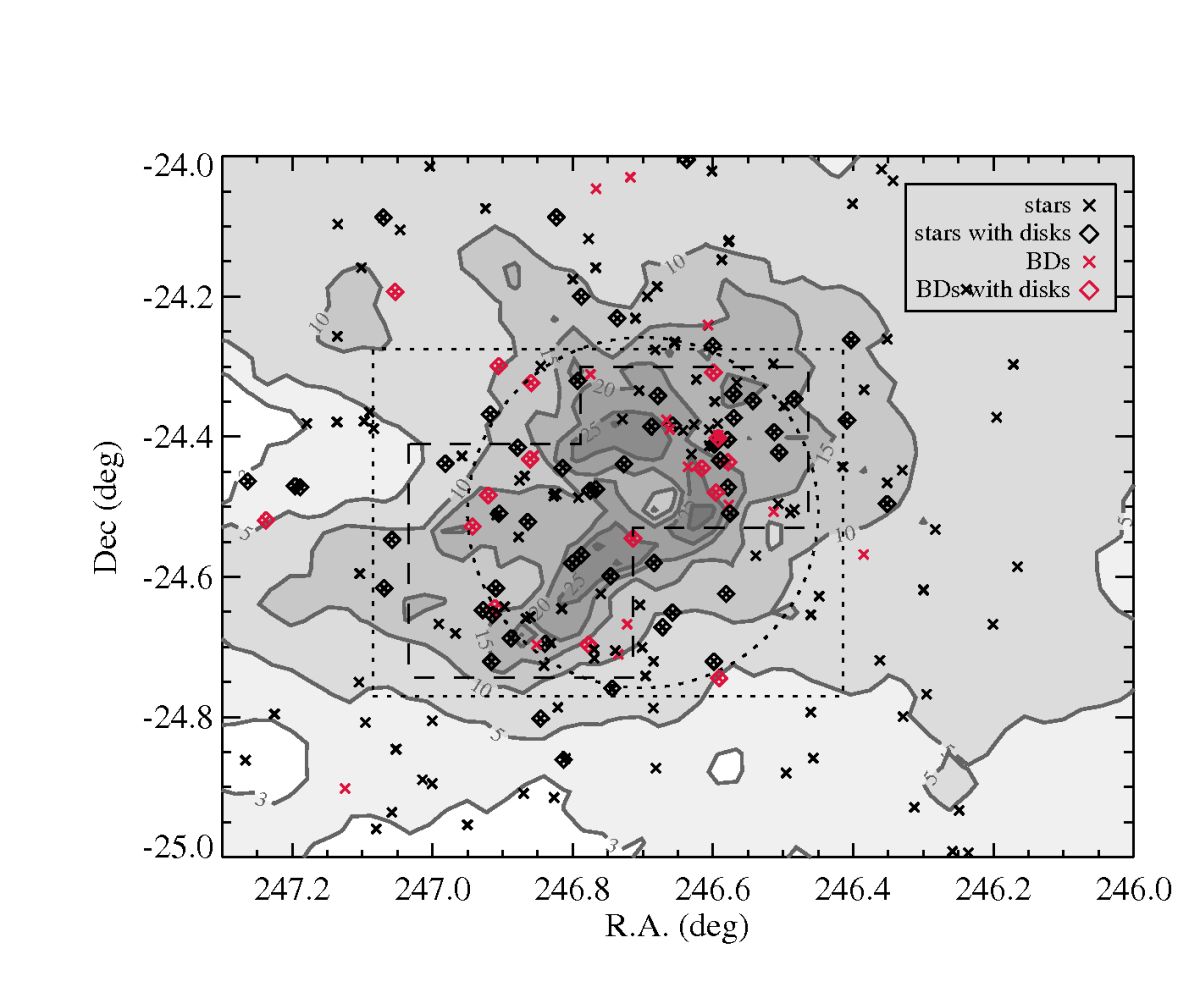
In Figure 8 we show the projected distribution of spectroscopically confirmed stellar members and BDs in Oph. Stellar-mass members (black crosses) are from Wilking et al. (2008) and Erickson et al. (2011), with three additional objects identified as very-low-mass stars in the framework of SONYC. Red crosses show spectroscopically confirmed BDs from Wilking et al. (2008), Alves de Oliveira et al. (2010), Marsh et al. (2010), Geers et al. (2011), Erickson et al. (2011) and this work. Both catalogs of stellar and substellar-mass members were cross-matched with the catalog containing objects showing MIR color-excess, which is interpreted as the evidence for an existence of a circumstellar disk around these objects. The stellar population clearly shows clustering towards the inner part of the L1688 core. There are 80 objects within the boundaries of our optical survey (dotted rectangle), and 65 objects outside of it (in the area roughly twice as large). At a first glance it might seem that even stronger clustering exists among the BD population. However, this can be attributed to the lack of a uniform BD survey in the entire cluster region. Most of the existing BD surveys, including this one, have been concentrated on the inner core of the cloud, and only two surveys actually probed the larger area (Cushing et al., 2000; Wilking et al., 2005). Therefore, the larger star-to-BD ratio in the outskirts of the cluster is probably not real. Within our FOV, there is apparently no significant difference between the spatial distribution of stellar and substellar populations.
A comparison between the two populations can also be made based on the presence of disk excess. Here we again concentrate on the area within the -band survey boundaries. The ratio of the number of stellar members with disks, to the total number of stellar members is . This number probably represents the lower limit for the disk fraction, because of the relatively rigorous criteria on photometry that were applied to the 2MASS data. For the source matching, we request photometric quality flags for to be at least “B”, i .e. we select only detections with and photometric uncertainties below mag. Relaxing this criterion by allowing selection of the flags “C” and “D”, we end up with the stellar disk fraction of . Among the BD population in our FOV, we find that the fraction of sources exhibiting MIR excess is , in agreement with results from Jayawardhana et al. (2003). The YSO sample from Bontemps et al. (2001) includes both stars and BDs, down to . Combining our numbers for stars and BDs, we get the disk fraction of , in agreement with Bontemps et al. (2001).
Similar results were obtained in other star forming regions. For Ori, Chamaeleon-I, and IC 348, disk fractions are found to be and for low-mass stars and brown dwarfs, respectively (Luhman et al., 2008b). In NGC 1333, Scholz et al. (2011) find an upper limit on the BD disk fraction of . Ori, Cha-I, and IC 348 are somewhat older than Oph and NGC 1333 (2-3 Myr vs 1 Myr), indicating that there is no significant change in the disk fractions over the first 3 Myr of the cluster lifetime.
6. Conclusions
In this work we have built upon the large-scale optical and near-infrared survey of the L1688 core in Ophiuchi presented in Geers et al. (2011). From the optical+NIR photometry, 309 objects were selected as candidate substellar cluster members. 58/309 of these objects were targeted for spectroscopy, and one was confirmed as a substellar mass object (Geers et al., 2011). Here we report the second round of spectroscopic follow-up, where we obtained spectra of additional 46 candidates from the same list. Among these, we find 4 candidate substellar objects with K, 3 of which are for the first time reported here (SONYC-RhoOph-3, 6, 7).
From MOIRCS, 2MASS and photometry, Geers et al. (2011) established an additional sample of 26 candidate substellar members with disk excess. 12 of these appear as spectroscopically confirmed BDs with spectral type later than M5 in the literature. We obtained spectra of 17 BD candidates, including 9 previously confirmed BDs. We report 5 newly discovered very-low-mass probable members of Oph, including 3 BDs (SONYC-RhoOph-5, 8, 10). From the list of the previously confirmed objects, we re-confirm 7 out of 9 with K.
In summary, we report the discovery of 8 new very-low-mass candidate members in Oph with between 2550 and 3200 K. Six of these objects are classified as brown dwarfs, and comprise one fifth of the entire currently known substellar population in Oph. While it might be premature to derive the substellar IMF in this cluster, as the high and variable extinction seriously hampers most attempts to detect objects at the lowest masses, we estimate that the upper limit on the ratio of the number of low-mass stars to the number of BDs is in line with other nearby star forming regions. By analysis of the MIR excess among the spectroscopically confirmed members of Oph, we find the disk fractions to be and for stars and BDs, respectively. This is again in line with the results from the other nearby star forming regions.
References
- Allard et al. (2001) Allard, F., Hauschildt, P. H., Alexander, D. R., Tamanai, A., & Schweitzer, A. 2001, ApJ, 556, 357
- Allen et al. (2004) Allen, L. E., Calvet, N., D’Alessio, et al. 2004, ApJS, 154, 363
- Allers et al. (2007) Allers, K. N., Jaffe, D. T., Luhman, et al. 2007, ApJ, 657, 511
- Alves de Oliveira et al. (2010) Alves de Oliveira, C., Moraux, E., Bouvier, et al. 2010, A&A, 515, A75+
- Andersen et al. (2008) Andersen, M., Meyer, M. R., Greissl, J., & Aversa, A. 2008, ApJ, 683, L183
- Andersen et al. (2011) Andersen, M., Meyer, M. R., Robberto, M., Bergeron, L. E., & Reid, N. 2011, ArXiv e-prints
- Baraffe et al. (2003) Baraffe, I., Chabrier, G., Barman, T. S., Allard, F., & Hauschildt, P. H. 2003, A&A, 402, 701
- Bate (2009) Bate, M. R. 2009, MNRAS, 392, 590
- Bonnell et al. (2007) Bonnell, I. A., Larson, R. B., & Zinnecker, H. 2007, Protostars and Planets V, 149
- Bontemps et al. (2001) Bontemps, S., André, P., Kaas, A. A., et al. 2001, A&A, 372, 173
- Brandeker et al. (2006) Brandeker, A., Jayawardhana, R., Ivanov, V. D., & Kurtev, R. 2006, ApJ, 653, L61
- Briceño et al. (2002) Briceño, C., Luhman, K. L., Hartmann, L., Stauffer, J. R., & Kirkpatrick, J. D. 2002, ApJ, 580, 317
- Burgasser et al. (2008) Burgasser, A. J., Liu, M. C., Ireland, M. J., Cruz, K. L., & Dupuy, T. J. 2008, ApJ, 681, 579
- Burgasser et al. (2004) Burgasser, A. J., McElwain, M. W., Kirkpatrick, et al. 2004, AJ, 127, 2856
- Cardelli et al. (1989) Cardelli, J. A., Clayton, G. C., & Mathis, J. S. 1989, ApJ, 345, 245
- Chabrier et al. (2000) Chabrier, G., Baraffe, I., Allard, F., & Hauschildt, P. 2000, ApJ, 542, 464
- Comeron et al. (1993) Comeron, F., Rieke, G. H., Burrows, A., & Rieke, M. J. 1993, ApJ, 416, 185
- Cushing et al. (2005) Cushing, M. C., Rayner, J. T., & Vacca, W. D. 2005, ApJ, 623, 1115
- Cushing et al. (2000) Cushing, M. C., Tokunaga, A. T., & Kobayashi, N. 2000, AJ, 119, 3019
- de Geus et al. (1989) de Geus, E. J., de Zeeuw, P. T., & Lub, J. 1989, A&A, 216, 44
- Erickson et al. (2011) Erickson, K. L., Wilking, B. A., Meyer, M. R., Robinson, J. G., & Stephenson, L. N. 2011, ArXiv e-prints
- Geers et al. (2011) Geers, V., Scholz, A., Jayawardhana, R., et al. 2011, ApJ, 726, 23
- Greene & Young (1992) Greene, T. P. & Young, E. T. 1992, ApJ, 395, 516
- Haisch et al. (2010) Haisch, K. E., Barsony, M., & Tinney, C. 2010, ApJ, 719, L90
- Jayawardhana et al. (2003) Jayawardhana, R., Ardila, D. R., Stelzer, B., & Haisch, Jr., K. E. 2003, AJ, 126, 1515
- Jayawardhana & Ivanov (2006) Jayawardhana, R. & Ivanov, V. D. 2006, Science, 313, 1279
- Kimura et al. (2010) Kimura, M., Maihara, T., Iwamuro, F., et al. 2010, PASJ, 62, 1135
- Kirkpatrick et al. (2006) Kirkpatrick, J. D., Barman, T. S., Burgasser, A. J., et al. 2006, ApJ, 639, 1120
- Kirkpatrick et al. (2008) Kirkpatrick, J. D., Cruz, K. L., Barman, T. S., et al. 2008, ApJ, 689, 1295
- Kirkpatrick et al. (2010) Kirkpatrick, J. D., Looper, D. L., Burgasser, A. J., et al. 2010, ApJS, 190, 100
- Lucas et al. (2005) Lucas, P. W., Roche, P. F., & Tamura, M. 2005, MNRAS, 361, 211
- Luhman et al. (2008a) Luhman, K. L., Allen, L. E., Allen, P. R., et al. 2008a, ApJ, 675, 1375
- Luhman et al. (2008b) Luhman, K. L., Hernández, J., Downes, J. J., Hartmann, L., & Briceño, C. 2008b, ApJ, 688, 362
- Luhman et al. (1997) Luhman, K. L., Liebert, J., & Rieke, G. H. 1997, ApJ, 489, L165+
- Luhman & Rieke (1999) Luhman, K. L. & Rieke, G. H. 1999, ApJ, 525, 440
- Luhman et al. (2003) Luhman, K. L., Stauffer, J. R., Muench, A. A., et al. 2003, ApJ, 593, 1093
- Marsh et al. (2010) Marsh, K. A., Kirkpatrick, J. D., & Plavchan, P. 2010, ApJ, 709, L158
- Miyazaki et al. (2002) Miyazaki, S., Komiyama, Y., Sekiguchi, M., et al. 2002, PASJ, 54, 833
- Muench et al. (2002) Muench, A. A., Lada, E. A., Lada, C. J., & Alves, J. 2002, ApJ, 573, 366
- Mužić et al. (2011) Mužić, K., Scholz, A., Geers, V., Fissel, L., & Jayawardhana, R. 2011, ApJ, 732, 86
- Natta et al. (2002) Natta, A., Testi, L., Comerón, F., et al. 2002, A&A, 393, 597
- Padoan & Nordlund (2004) Padoan, P. & Nordlund, Å. 2004, ApJ, 617, 559
- Payne & Lodato (2007) Payne, M. J. & Lodato, G. 2007, MNRAS, 381, 1597
- Ratzka et al. (2005) Ratzka, T., Köhler, R., & Leinert, C. 2005, A&A, 437, 611
- Ridge et al. (2006) Ridge, N. A., Schnee, S. L., Goodman, A. A., & Foster, J. B. 2006, ApJ, 643, 932
- Scholz & Eislöffel (2004) Scholz, A. & Eislöffel, J. 2004, A&A, 419, 249
- Scholz & Eislöffel (2005) —. 2005, A&A, 429, 1007
- Scholz et al. (2009) Scholz, A., Geers, V., Jayawardhana, R., et al. 2009, ApJ, 702, 805
- Scholz et al. (2011) Scholz, A., Muzic, K., Geers, V., Jayawardhana, R., & Tamura, M. 2011, ApJ, accepted
- Skrutskie et al. (2006) Skrutskie, M. F., Cutri, R. M., Stiening, R., et al. 2006, AJ, 131, 1163
- Stamatellos & Whitworth (2009) Stamatellos, D. & Whitworth, A. P. 2009, MNRAS, 392, 413
- Sumi et al. (2011) Sumi, T., Kamiya, K., Bennett, D. P., et al. & Microlensing Observations in Astrophysics (MOA) Collaboration. 2011, Nature, 473, 349
- Suzuki et al. (2008) Suzuki, R., Tokoku, C., Ichikawa, T., et al. 2008, PASJ, 60, 1347
- Wilking et al. (2008) Wilking, B. A., Gagné, M., & Allen, L. E. Star Formation in the Ophiuchi Molecular Cloud, ed. Reipurth, B., 351–+
- Wilking et al. (1999) Wilking, B. A., Greene, T. P., & Meyer, M. R. 1999, AJ, 117, 469
- Wilking & Lada (1983) Wilking, B. A. & Lada, C. J. 1983, ApJ, 274, 698
- Wilking et al. (2005) Wilking, B. A., Meyer, M. R., Robinson, J. G., & Greene, T. P. 2005, AJ, 130, 1733
- Zapatero Osorio et al. (2000) Zapatero Osorio, M. R., Béjar, V. J. S., Martín, E. L., Rebolo, R., et al. 2000, Science, 290, 103