The stellar, molecular gas and dust content of the host galaxies of two dust obscured quasars.
Abstract
We present optical through radio observations of the host galaxies of two dust obscured, luminous quasars selected in the mid-infrared, at and , including a search for CO emission. Our limits on the CO luminosities are consistent with these objects having masses of molecular gas , several times less than those of luminous submillimeter-detected galaxies (SMGs) at comparable redshifts. Their near-infrared spectral energy distributions (SEDs), however, imply that these galaxies have high stellar masses () The relatively small reservoirs of molecular gas and low dust masses are consistent with them being relatively mature systems at high-.
1 Introduction
The hosts of high redshift quasars and radio galaxies provide an important insight into the formation of the most massive galaxies at high redshifts. In particular, they can be used to study the origin of the black hole mass – bulge mass/velocity dispersion relation (Magorrian et al. 1998, Gebhardt et al. 2000; Ferrarese et al. 2000) and its possible explanation in terms of AGN feedback on star formation in the host galaxy (Silk & Rees 1998; King 2003). Dust obscured quasars play a key role in such models, representing the intermediate stage after the black hole has begun accreting gas from its surroundings, but before AGN driven winds have cleared gas and dust from the line of sight to the quasar (Fabian 1999; Li et al. 2006), in a manner similar to that proposed by Sanders et al. (1988).
In order to test these models, it is particularly important to build up samples of dust-obscured quasars, especially at high redshifts, where an increased amount of quasar obscuration is thought to be due to dust in the host galaxy (e.g. Treister et al. 2009), rather than by a nuclear torus as in the orientation-based unified scheme for local Seyfert and radio galaxies/quasars (Antonucci 1993). Over the past few years, we have been constructing a sample of mid-infrared selected, dust obscured quasars, building on the work of Lacy et al. (2007a). This sample includes objects with redshifts past the peak in number density of the normal quasar population at (Richards et al. 2006 ).
Obscured quasars also have an useful practical advantage over normal quasars, namely that the obscuration of the quasar nucleus by dust allows the host galaxy of the quasar to be characterized much more easily. Only in these obscured quasars is it possible to obtain accurate estimates of host galaxy stellar luminosities and galaxy morphologies (Zakamska et al. 2006; Lacy et al. 2007b).
Despite their importance, obscured quasars remain a relatively poorly studied population. Large numbers have been found in the Sloan Digital Sky Survey (Reyes et al. 2008), but only through mid-infrared selection has it proved possible to find more than a handful of these objects at , where the [Oiii] emission line is redshifted out of the rest-frame optical band (Martínez-Sansigre et a. 2005; Lacy et al. 2007a; Polleta et al. 2006; 2009). Existing observations of high- dust obscured quasars do tend to support a scenario in which a significant fraction of the dusty quasar population is reddened by dust in the host galaxy, rather than a nuclear torus (Martínez-Sansigre et al. 2006; Lacy et al. 2007b), but key unknowns in the observational studies of these objects remain. These include the masses of the molecular gas reservoirs in these objects, and the stellar luminosities of the hosts. From work that has been performed on similar objects, including Ultraluminous Infrared Galaxies (ULIRGs) selected at 24m with Spitzer (Yan et al. 2010), many of which are AGN-dominated, and on a few other type-2 quasars at (Martínez-Sansigre et al. 2009; Polletta et al. 2011), it seems that molecular gas is present in such objects, but how the molecular gas content relates to other host galaxy properties is unclear.
We were thus motivated to study the CO emission from luminous obscured quasars, since it traces the molecular gas content of the galaxy, and hence the reservoir of molecular gas available for star formation. In particular, the low- transitions provide the best tracer for the total gas mass (Papadopoulos & Ivison 2002). The low critical density of these transitions allows them to be seen against the Cosmic Microwave Background in gas with density as low as . To do this, we use the new capabilities of the Extended Very Large Array (EVLA). The VLA has a large collecting area, but has hitherto been restricted through not having receivers in the 30-40GHz range, or a correlator capable of correlating a wide bandwidth. The EVLA, with Ka-band receivers and the wide-band WIDAR correlator provides the opportunity to study these objects in the lowest CO (1-0) transition. When fully commissoned, the WIDAR correlator will be able to correlate an 8GHz bandwidth. It will thus be capable of measuring redshifts for galaxies whose distances are relatively poorly constrained (for example, galaxies with only photometric redshifts), and for galaxies whose emission features in the optical/near-infrared are obscured by dust. For this initial investigation, we used the restricted correlator bandwidth available through the Open Shared Risk Observation (OSRO) program and objects with well-constrained redshifts with relatively narrow (kms-1) emission lines. The combination of these data with newly released archival data from the Herschel telescope allows us to study the gas and dust content of these objects for the first time. We assume a cosmology with and .
2 Sample selection
Our objects were selected in the mid-infrared using the selection technique of Lacy et al. (2004), which finds candidate AGN and quasars, both obscured and unobscured, by virtue of their red mid-infrared continua. Our obscured quasars comprise both dust-reddened type-1 quasars (objects with red continua, but broad permitted lines), and type-2 quasars, selected from the Spitzer SWIRE survey (Lonsdale et al. 2003) and the Extragalactic First Look Survey (XFLS) (Lacy et al. 2005; Fadda et al. 2006).
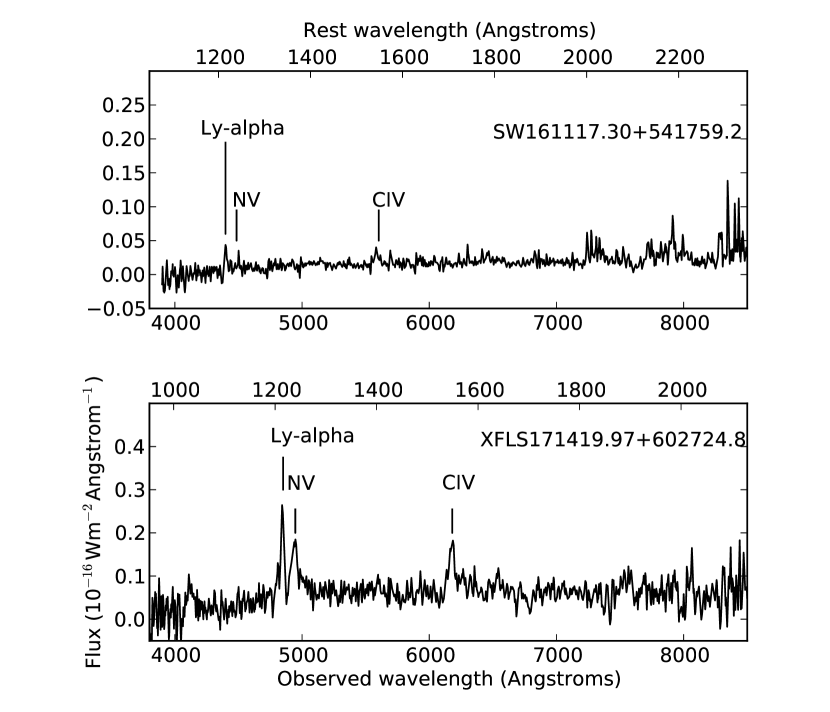
Optical spectra of the first 77 objects in this mid-infrared selected sample were published in Lacy et al. (2007a). A further spectra have now been obtained (Lacy et al. 2012, in preparation). From this list we picked out a pilot sample of two obscured quasars for follow-up with the EVLA in OSRO mode, according to the following criteria: , (to ensure good RAs for night time summer observing) and optical spectroscopic redshifts from multiple emission lines (Figure 1). Unlike most other samples of quasars selected for CO follow-up, our objects were not pre-selected for bright far-infrared emission.
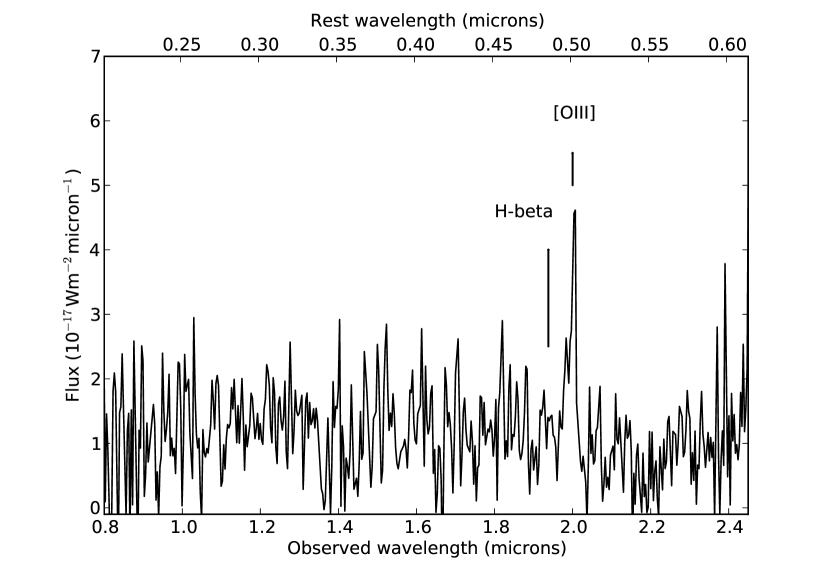
The high redshifts of our sources mean that the available optical spectra sample the rest-frame UV. Our working definition of a type-2 quasar as an object which lacks broad permitted lines in the rest-frame optical. As only XFLS171419.97+602724.8 has a rest-frame optical spectrum (Figure 2), we are only sure of this one as being a type-2 quasar by our definition. However, the spectral energy distribution (SED) of SW161117.30+541759.2 suggests it is dominated by starlight in the rest-frame optical. The spectra are discussed in more detail in Section 3.
3 Optical and infrared observations
XFLS171419.97+602724.8 has had its optical spectrum previously published in Lacy et al. (2007a) (but reproduced here for ease of comparison with the near-infared spectrum presented here). The spectrum of SW161117.30+541759.2 was taken using Hectospec on the MMT during June 2008, we used the 270 groove per mm grating, resulting in a spectral resolution of nm. Approximately 130 fibers were placed on candidate AGN in each setting. The field was observed for for s.
| Object | SW161117.30+541759.2 | XFLS171419.97+602724.8 |
|---|---|---|
| Redshift | 2.618 | 2.986 |
| (AB) | 24.2 | 22.0 |
| (AB) | 24.1 | 21.9 |
| (AB) | 23.7 | 21.5 |
| (AB) | 23.1 | 21.0 |
| (AB) | 22.2 | 20.5 |
| (Vega) | 21.5 | - |
| (Vega) | - | 18.3 |
| (Vega) | 19.4 | - |
| 3.6m (Jy) | 43.4 | 178 |
| 4.5m (Jy) | 86.3 | 248 |
| 5.8m (Jy) | 204 | 495 |
| 8.0m (Jy) | 279 | 1080 |
| 24m (Jy) | 1155 | 5600 |
| 70m (Jy) | 15000 | 26000 |
| 160m (Jy) | 60000 | 59000 |
| 250m (Jy) | 9000 | 18000 |
| 350m (Jy) | 9000 | 15000 |
| 1.4GHz (Jy) | 135 | 1230 |
| 610MHz (Jy) | 200 | 2160 |
The data were analysed using software based on the hsred package of R. Cool, with a small modification to improve the sky subtraction. Details are given in Lacy et al. (2012). The resulting spectrum is shown in Figure 1 (upper panel). In most cases our sky subtraction technique works well, particularly for the discrete sky lines. However, fiber spectra of faint objects are more vulnerable to artifacts due to poor sky subtraction than longslit spectra. We therefore also checked that the redshift was consistent with the continuum SED, especially in the area around the Balmer break in the observed near-infrared (Section 5.2).
A near infrared spectrum of XFLS171419.97+602724.8 was obtained using SpeX (Rayner et al. 2003) at the Infrared Telescope Facility (IRTF) on 2007-06-18 (Figure 2). SpeX was used in low dispersion (prism) mode with a 0.5 arcsec slit, resulting in a resolving power . The object was nodded between two positions along the slit in an ABBABBA… pattern, with 2 min integration times at each nod position, for a total of 1hr of integration time on the object. The airmass was 1.6, and the slit aligned along the parallactic angle. The atmospheric transmission and flux was calibrated on the nearby A0 star HD172728. An -band image was obtained using SpeX in imaging mode on 2007-06-19 using min exposures at an airmass of 1.7, calibrated on the standard P138-C (Persson et al. 1992). XFLS171419.97+602724.8 also has a spectrum in the Spitzer archive, Astronomical Observation Request number 24191744 from Program 40539 (Wu et al. 2010), taken with the Infrared Spectrograph (IRS). The spectrum, which runs from 5-38m, was extracted using the Spice tool from the Spitzer Science Center111http://ssc.spitzer.caltech.edu/dataanalysistools/tools/spice. The spectrum itself is featureless, (in particular, no Polycyclic Aromatic Hydrocarbon [PAH] features are visible), but the overall shape constrains the mid-infrared SED very well (see section 5.2).
Optical magnitudes for these objects were obtained from the Sloan Digital Sky Survey (Adelman-McCarthy et al. 2008), from González-Solares et al. (2011) and from Fadda et al. (2004). Near infrared magnitudes and images in - and -band for SW161117.30+541759.2 were obtained from the UKIRT Infrared Deep Survey (UKIDSS) Deep Extragalactic Survey. Infrared fluxes from Spitzer at 3.6-160m were obtained from SWIRE (data release 2) and the XFLS (Lacy et al. 2005; Fadda et al. 2006; Frayer et al. 2006).
Herschel SPIRE limits at 250 and 350m were obtained from the Level 2 Herschel archival products originally taken as part of the Hermes project (Oliver et al. 2010), using aperture photometry, assuming beam areas from the SPIRE beam release note version 1 (Sibthorpe et al. 2010), and using aperture corrections derived based on those beams. Radio fluxes/limits at 1.4GHz are from Condon et al. (2002) and Ciliegi et al. (1999) and at 610MHz from Garn et al. (2007, 2008). The available photometry for our objects is listed in Table 1.
4 EVLA Observations
Our quasars were observed with the EVLA in OSRO mode as program AL744. Five objects in total were observed, however, three were later established to be highly-extincted starbursts or quasars at lower redshift and have been removed from the analysis in this paper. Our two remaining objects were observed in Ka-band. Only a single intermediate frequency could be tuned low enough to reach the redshifted CO(1-0) line in these objects, and hence the available bandwidth was only 128MHz (see Table 2). We refer to the IF that was not tuned to the CO(1-0) line frequency as the “off-tuned” IF. All observations used a 2MHz channel width (kms-1).
The available bandwidth of 128MHz in Ka-band (corresponding to at , or a velocity range of 1270kms-1) required us to use redshifts as close as possible to the systemic velocity of the galaxies. As our optical spectra are typically of modest signal-to-noise, with the brightest lines being high ionization species which can often be in outflows, we chose to estimate the systemic redshift from the average velocity of the lowest ionization, highest signal-to-noise lines.
Both objects were observed in 3hr scheduling blocks, with total times on source 2.1hr (exact observation times and RMS noises obtained are given in Table 2). Phase calibration was performed on a nearby calibrator, (J1620+4901 for SW161117.30+541759.2, J1746+6226 for XFLS171419.97+602724.8), using on-source scans of six minutes between each observation of the calibrator. Flux calibration was performed on 3C48. The initial flux calibrations failed due to an error in the execution of the scheduling block which led to the last scan of the block being dropped. They were thus repeated on 2010-09-13, however, only a K-band flux calibration on J1746+6226 proved successful, for unknown reasons. The fluxes of J1746+6226 in Ka band were extrapolated from that in K-band using a spectral index between 8.4GHz and 30GHz obtained from previous observations (Patnaik et al. 1992; Healey et al. 2007; Lowe et al. 2007) listed in the NASA Extragalactic Database (NED). For J1620+4901 we made use of our observations in the off-tuned IF (selected to be centered at 37GHz for all the Ka-band observations) to obtain the ratio of the fluxes of J1620+4901 and J1746+6226 at 37GHz, then extrapolated the flux of J1620+4901 to the redshifted CO line frequency at 31.9GHz using its spectral index from NED. Consequently, we estimate that there is an unusually high uncertainty in the flux calibration of the Ka-band observations of %, based on the uncertainty in the spectral index, which may have varied between the epoch of the archival observations in NED and the present.
The data were analysed in CASA using standard procedures222see http://casaguides.nrao.edu/index.php?title=EVLA_Tutorials. The spectra were then extracted using a beam-weighted extraction centered on the mid-infared position of the sources. The noise per channel was estimated by measuring the RMS on each image plane of the cube.
| Object | SW161117.30+541759.2 | XFLS171419.97+602724.8∗ |
|---|---|---|
| Frequency (GHz) | 31.85977 | 28.91900 |
| Band | Ka | Ka |
| Bandwidth† (MHz) | 128 | 128 |
| Date Observed | 2010-06-28 | 2010-07-13,16 |
| N | 17 | 20 |
| Integration time (mins) | 123 | 2126 |
| RMS noise (mJy) | 0.33 | 0.36 |
| (mJykms-1) | 110 | 90 |
| 3.5 | 3.5 |
†Although the OSRO bandwidth is 256MHz, only a single intermediate frequency of 128MHz bandwidth could be tuned below 33GHz. ‡Number of antennas used in mapping. (Some antennas were yet to be fitted with Ka-band receivers.) ∗ The scheduling block for XFLS171419.97+602724.8 was observed twice, on 2010-07-13 and 2010-07-16, however, the second set of data was significantly noisier. The cubes from each observation were combined with relative weights of 0.73:0.27 for the 2010-07-13 and 2010-07-16 observations, respectively.
5 Results
5.1 CO luminosities and masses
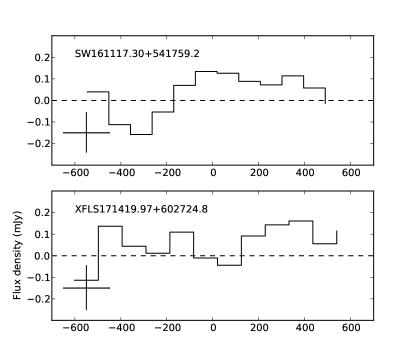
Our limits on the CO(1-0) luminosities are shown in Table 2. SW161117.30+541759.2 is formally detected at the level, but further observations will be needed to confirm this. There is the possiblity of a small amount of continuum contamination in XFLS171419.97+602724.8 - if the spectral index between 610 and 1400MHz is extrapolated to 30GHz, the object would have a flux density of 156Jy, compared to a continuum limit of Jy. However, the spectral index most likely steepens at high frequencies, so the true continuum flux is likely to be Jy.
There is the possibility that a significant amount of line flux is missing due to the restricted bandwidth used, only repeat observations with the full bandwidth of the WIDAR correlator will ensure that this is not the case. However, none of our observations have obvious wings of lines cut off at the edge of the bandwidth, suggesting that any missed flux is unlikely to be very large.
The value of the conversion factor, between the velocity integrated CO brightness temperature luminosity, (in units of Kkms-1pc2), and molecular gas mass in solar masses, , has been a source of considerable controversy (see Ivison et al. 2011 for a recent discussion). CO is almost always optically thick, and observed values of range from in giant molecular clouds in the Milky Way, to in the interstellar medium of Ultraluminous Infrared Galaxies. For SMGs, a value of is typically assumed, but is highly uncertain. We assume a value of for ease of comparison with other work.
5.2 Fitting the Spectral Energy Distributions
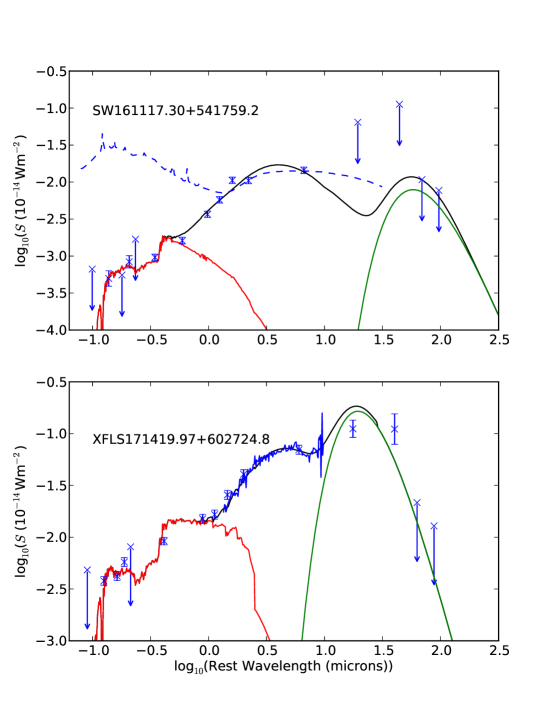
The Spectral Energy Distributions (SEDs) of our objects were fit using the model for AGN and starburst emission employed by Lacy et al. (2007b) to model low redshift type-2 quasars, and detailed in Sajina et al. (2006) and Hiner et al. (2009). For the AGN, we used a power-law with a cutoff at the dust sublimation temperature, assumed to be 1500K, and a long wavelength cutoff at m, corresponding to a typical nuclear torus SED. For SW161117.30+541759.2 we also added a “very hot” AGN blackbody component of dust as detailed in Hiner et al.. The warm and cold dust components were modeled as described by Sajina et al. (2006), the warm component being a power-law component with a cutoff at long wavelengths to simulate very small grain emission, and the cold component a modified blackbody. We tested three different models for the stellar populations. Single stellar population (SSP) models from Maraston (2005) aged 100Myr, 600Myr and 1Gyr, reddened by an SMC extinction law (Pei 1992) with variable optical depth in -band, , and a dual population model consisting of a 100Myr and 1Gyr SSP, with a variable ratio of young to old stellar population (), with no reddening. The models were deliberately kept simple to reduce the number of free parameters in the fit. We estimated a rest-frame -band flux based on the stellar component alone. This allows us to compare directly with the results of Hainline et al. (2010) who perform similar fits to the SEDs of submillimeter selected galaxies (SMGs). The best fits are shown in Figure 4 and the results in Table 3.
In the far-infrared SW161117.30+541759.2 lacks detection in either Spitzer or SPIRE data longward of 24m, so we placed a limit on the far-infrared luminosity by fitting the maximal warm plus cold dust combination, constrained such that the warm component fit smoothly onto the cold (Sajina et al. 2006). XFLS171419.97+602724.8 required a relatively high “cold” dust temperature ( K) to fit the Spitzer 70m and 160m detections and the SPIRE 250m limit. The high dust temperature, combined with the lack of PAH detection in the IRS spectrum of XFLS171419.97+602724.8, make it unlikely that the dust is heated by normal star formation in this object. If the AGN is responsible, however, it requires AGN heating to dominate on scales beyond the usual pc-sized torus in these objects (see e.g. Section 3.5 of Martínez-Sansigre et al. 2009).
We have estimated dust masses or limits using the prescription of Hildebrand (1983), assuming a temperature of 50K for SW161117.30+541759.2 and the fitted 135K for XFLS171419.97+602724.8 (Table 3). Assuming a gas-to-dust ratio similar to the Milky Way (; Stevens et al. 2005) or the lower value more typical for SMGs (Kovács et al. 2006), we find that the limits on our gas masses are consistent with either of these ratios.
5.3 Star formation rates
We have three ways to estimate, or constrain, the star formation rates (SFRs) in our host galaxies, though all three are vulnerable to contamination by AGN-related emission. The restframe UV emission, although possibly contaminated by scattered light of nebular continuum from the AGN, provides one measure, the far-infrared emission (or limits, in most cases) provides another constraint, and the radio emission a third. Despite the likelihood of contamination by the AGN of one or more measures, we can at least investigate whether the three estimates are self-consistent. For the star formation rate estimate based on the UV flux, we assume a conversion of , where we have evaluated at 1530Å. We also derive an estimate corrected for dust extinction using the fitted and the SMC extinction law. For the star formation rate based on far-infrared () emission, we have used the Kennicutt (1998) conversion:. For the radio () emission, we have used the estimate from Bell (2003): , assuming a standard radio spectral index of , where radio flux density, .
These estimates are shown in Table 3. SW161117.30+541759.2 has the lowest SFR, with no radio or far-infrared detection and only a moderate UV luminosity. The SFR from the UV and infrared/radio disagree for XFLS171419.97+602724.8, the UV value compares with infrared and radio luminosities corresponding to 4000-5000. The latter values seem anomalously high, this, coupled with the very high dust temperature (135K) of the SED fit to this object, and the lack of PAH features in the IRS spectrum suggest that the UV estimate is closer to the truth, and that the FIR luminosity is heavily dominated by the AGN. Table 3 highlights the difficulty in estimating star formation rates at any wavelength in the presence of a powerful AGN.
5.4 Stellar luminosities
Stellar luminosity estimates are also vulnerable to contamination by AGN emission, both direct and scattered. Direct AGN emission is typically seen as a hot near/mid-infrared component dominated by dust heated by the AGN. Scattered light is usually blue, from electron or dust scattering, so is typically weak in the near-infrared. Although radio-quiet obscured quasars have not been studied in detail to assess the AGN light contribution to the rest-frame near-infrared emission, some work has been performed on high redshift radio galaxies. Leyshon & Eales (1998) and Leyshon, Dunlop & Eales (1999) show that the majority high redshift radio galaxies have only weak polarization in the near-infrared, indicating little scattered light at those wavelengths. Seymour et al. (2008) and de Breuck et al. (2010) studied high redshift radio galaxies with Spitzer, and demonstrated the practicality of separating the AGN and stellar emission in such objects by modeling the AGN emission and fitting a simple stellar SED, in a similar manner to the fitting done in this paper.
One caveat that needs to be applied to our analysis is that our quasars were selected on the basis of a detection in all four IRAC bands in the XFLS and SWIRE catalogs. The XFLS catalog, in particular, has relatively bright flux density limits of 20,25,100 and 100 Jy in [3.6],[4.5],[5.8] and [8.0], respectively (Lacy et al. 2005). The situation for the deeper SWIRE data is better, with 5 limits of 7, 10, 28, 33Jy in [3.6],[4.5],[5.8] and [8.0], respectively (Lonsdale et al. 2003). Nevertheless, in both samples there may be objects missing, particularly at high redshifts, because their rest-frame near-infrared emission (which is typically dominated by starlight from the host, rather than thermal emission from the AGN) is not bright enough to be detected in all four IRAC bands.
SW161117.30+541759.2 is well fit by a 100Myr old stellar population, with a modest amount of reddening. XFLS171419.97+602724.8 seems to require a superposition of an old (1Gyr) and young (100Myr) stellar population to account for a significant Balmer break while retaining a blue UV continuum.
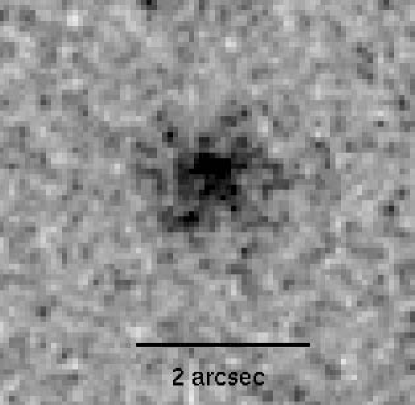
5.5 Host galaxy morphologies
A major observational advantage to studying heavily obscured quasars is the ability to image the host free of the bright nuclear light. The host of SW161117.30+541759.2 is only marginally resolved in ground-based seeing, but the host of XFLS171419.97+602724.8 is clearly resolved in an -band IRTF image in 0.7-arcsec seeing (Figure 5).
| Object | SW161117.30+541759.2 | XFLS171419.97+602724.8 |
|---|---|---|
| Best model | 100Myr SSP | Dual 100Myr&1Gyr |
| 0.08 | 0.47 | |
| (SSP model) | 0.34 | - |
| (Dual model) | - | 0.13 |
| -25.3 | -29.1 | |
| log | 12.6 | 13.4 |
| log | 12.3 | 13.3 |
| (K) | [50] | 13510 |
| 5.0 | 4.1 | |
| SFR (UV) (uncorrected for extinction) | 9.1 | 130 |
| SFR (UV) (corrected for extinction) | 31 | 130 |
| SFR (FIR) | 350 | 4000 |
| SFR (Radio) | 390 | 5130 |
| Molecular gas mass ((,) | 2.8 | |
| log10( | 7.9 | 7.0 |
| log10( | 10.9 | 12.4 |
| log | 8.1 | 8.9 |
Notes: is the fraction of starlight in the model in rest-frame -band, is the optical depth in -band and is the fractional contribution of the young stellar population in the dual stellar population model. The limit on is calculated assuming the quasar is accreting at the Eddington Rate.
6 Discussion
6.1 The AGN nature of these objects
The best spectroscopic analogues with similar redshifts as these objects are high redshift radio galaxies (McCarthy 1993), and type-2 quasars detected in X-ray surveys (e.g. Norman et al. 2002; Silverman et al. 2010). The Ly lines from the radio galaxies are, however typically much stronger relative to the UV emission lines, consistent with the large haloes of ionized gas around these objects being affected by the presence of the radio jets (Reuland et al. 2007). These objects also have similar UV spectra to those of low redshift Seyfert-2 galaxies (e.g. Kriss et al. 1992; Kraemer et al. 1994), and AGN selected through Lyman-break techniques (Hainline et al. 2010b). Thus, by analogy with known AGN both at high and low redshift we feel secure in assuming that the presence of high ionization, high equivalent width UV emission lines is a reliable tracer of AGN activity.
6.2 Comparison to CO measurements of normal quasars
Few CO (1-0) measurements of normal quasars at similar redshifts have been published. Riechers et al. (2006) measured CO(1-0) of three quasars using the Greenbank and Effelsberg telescopes. Their luminosities are significantly higher than those measured for dusty quasars in this paper () , but the quasars are intrinsically more luminous, and were pre-selected for having ultraluminous infrared emission, so form a biased sample. Similarly, Coppin et al. (2008) detected CO emission in 5/6 optically-luminous, submm detected quasars at , with luminosities of . At higher redshifts, Wang et al. (2010) find slightly lower CO luminosities, , in a sample of eight quasars, again pre-selected to have submm continuum detections. At present it is therefore difficult to say whether the dusty quasars in this paper have significantly more or less molecular gas than their unobscured counterparts, since ours are unbiased towards bright far-infrared luminosities (but see also Klamer et al. 2005). This situation is likely to change rapidly, however, as the EVLA and ALMA are fully commissioned over the next 2-3 years.
6.3 Dusty quasars and the evolutionary paradigms for massive galaxies at high redshifts
Our understanding of galaxy evolution would be greatly enhanced if we could compare the gas content, stellar masses, star formation rates and space densities in unbiassed samples of different types of massive, high redshift galaxies, in order to constrain evolutionary scenarios. This would include SMGs, warm ULIRGs and obscured quasars selected in the mid-infrared or hard X-ray, radio galaxies, normal quasars and, if they exist, the quiescent equivalents of each class. Selection effects on current samples of these populations are strong, however, making it difficult to perform a definitive comparison. In our quasar hosts, there is a selection against objects with low stellar mass due to the requirement for detection in all IRAC bands, but no pre-selection for high dust masses and star formation rates based on mm/submm continuum detections. In the samples of Spitzer selected ULIRGs of Yan et al. (2010) and type-2 quasars of Martínez-Sansigre et al. (2009), a continuum detection at 1.2mm (i.e. a high star formation rate and dust mass) was a requirement for follow-up observations for CO. The SMGs with CO (1-0) measurements are also restricted to a fairly small sample at present, though this situation is likely to change in the next few months as EVLA commissioning progresses (e.g. Ivison et al. 2011). Nevertheless, we can attempt to piece together a consistent picture with what is currently available.
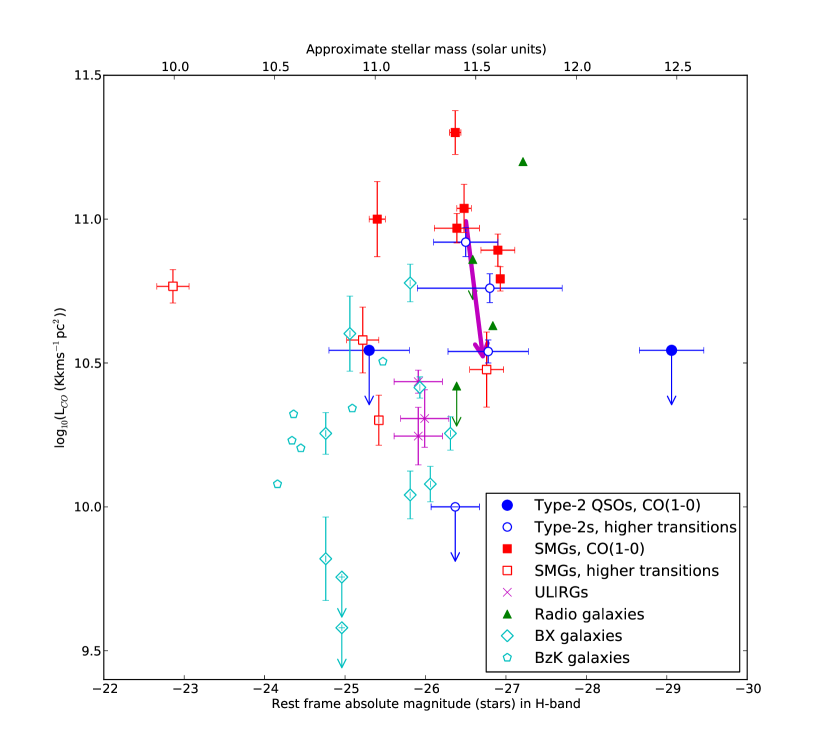
Figure 6 shows our quasar host galaxies compared to other high redshift objects (including other type-2 quasars) in the CO-luminosity – stellar luminosity (rest-frame -band absolute magnitude) plane. Assuming similar conversions between CO luminosity and CO mass, and stellar luminosity and stellar mass for the different populations shown here, we can begin to constrain some evolutionary scenarios between these types of objects. The type-2 quasars vary considerably in CO mass. The two objects from Polletta et al. (2011) have gas masses comparable to SMGs, but the objects from this paper and the and objects from Martinez-Sansigre et al. (2009) have detections or limits significantly lower than this. With the exception of XFLS171419.97+602724.8, the type-2 quasars tend to have similar stellar masses to the SMGs.
Making the assumption of conversion of gas to stars with 100% efficiency, trajectories can be drawn on Figure 6 (such as the large magenta arrow) to indicate how a galaxy might evolve with time. (Although such a scenario is highly simplistic as feedback effects will prevent the complete conversion of gas to stars, more gas is likely to accumulate too, both from expelled gas cooling and infalling, and from accretion of fresh material.) This simple scenario would indicate that SMGs and CO-rich type-2 quasars could evolve into moderately-high stellar mass galaxies, comparable in mass to the hosts of normal type-2 quasars. However, unless they are able to accrete significantly more gas than is currently present in their molecular reservoirs (or merge with other massive galaxies), they would not be able to evolve into our most massive host galaxy , XFLS171419.97+602724.8. It may be significant that, although this object is extremely luminous in the infrared, it has a high dust temperature, perhaps indicating a more evolved system overall, with AGN heating dominating the infrared SED. The ULIRGs seem to be a distinct population of relatively low stellar mass objects that could evolve into some of the lower mass (and lower luminosity) type-2 quasars. Similarly, the BX and BzK galaxies also look to be distinct from the majority of the SMGs and type-2 quasars. Clearly, however, these is a need for larger samples of high redshift galaxies with better controlled selection effects. These can now be provided using the new generation of micro-Jansky depth, deg2 near-infrared surveys such as the Spitzer Extragalactic Representative Volume Survey (Mauduit et al. 2011) in combination with far-infrared surveys with Herschel (e.g. Oliver et al. 2010) and follow-up with EVLA and the Atacama Large mm/submm Array (ALMA).
References
- (1) Adelman-McCarthy, J. et al. 2008, ApJS, 175, 297
- (2) Alexander , D.M. et al. 2008, AJ, 135, 1968
- (3) Antonucci, R. 1993, ARA&A, 31, 473
- (4) Bell, E.F. 2003, ApJ, 586, 794
- (5) Bennert, V.N., Auger, M.W., Treu, T., Woo, J.-H. & Malkan, M.A. 2011, ApJ Letters, submitted (arXiv:1102.1975)
- (6) Benson, A.J., Frenk, C.S., Lacey, C.G., Baugh. C.M. & Cole, S. 2003, ApJ, 599, 38
- (7) Borys, C., Smail, I., Chapman, S.C., Blain, A.W., Alexander, D.M. & Ivison, R.J. 2005, ApJ, 635, 853
- (8) Bruzual, G. & Charlot, S. 2003, MNRAS, 344, 1000
- (9) Casey, C.M. et al. 2009, MNRAS, 399, 121
- (10) Ciliegi, P. et al. 1999, MNRAS, 302, 222
- (11) Condon, J.J. et al. 2003, AJ, 125, 2411
- (12) Coppin, K.E.K. et al. 2008, MNRAS, 389, 45
- (13) Coppin, K. et al. 2010a, ApJ, 713, 503
- (14) Coppin, K.E.K. et al. 2010b, MNRAS, 407, L103
- (15) Croton, D.J. et al. 2006, MNRAS, 365, 11
- (16) Daddi, E. et al. 2010, ApJ, 713, 686
- (17) Dasyra, K.M. et al. 2009, ApJ, 701, 1123
- (18) de Breuck, C. et al. 2010, ApJ, 725, 36
- (19) Emonts, B.H.C. et al. 2011, MNRAS, submitted (arXiv:1103.5806)
- (20) Fadda, D., Januzzi, B.T., Ford, A., Storrie-Lombardi, L.J. 2004, AJ, 128
- (21) Fabian, A.C. 1999, MNRAS, 308, L39
- (22) Farrah, D. et al. 2008, ApJ, 677, 957
- (23) Ferrarese, L. & Merritt, D. 2000, ApJ 539 L9
- (24) Frayer, D.T. et al. AJ, 131, 250
- (25) Garn, T., Green, D.A., Hales, S.E.G., Riley, J.M. & Alexander, P. 2007, MNRAS, 376, 1251
- (26) Garn, T., Green, D.A., Riley, J.M. & Alexander, P. 2008, MNRAS, 383, 75
- (27) González-Solares et al. 2011, in preparation
- (28) Greve, T.R. et al. 2004, A&A, 107, 99
- (29) Greve, T.R. et al. 2005, MNRAS, 359, 1165
- (30) Hainline, L.J., Blain, A.W., Smail, I., Alexander, D.M., Armus, L., Champan, S.C. & Ivison, R.J. 2010a, arXiv:1006.0238
- (31) Hainline, K.N., Shapley, A.E., Greene, J.E. & Steidel C.C. 2010b, arXiv:1012.0075
- (32) Healey, S.E. et al. 2007, ApJS, 171, 61
- (33) Hildebrand, R.H. 1983, QJRAS, 24, 267
- (34) Hiner, K.D., Canalizo, G., Lacy, M., Sajina, A., Armus, L., Ridgway, S. & Storrie-Lombardi, L. 2009, ApJ, 706, 508
- (35) Ivison, R.J., Smail, I., Papadopoulos, P.P., Wold, I., Richard, J., Swinbank, A.M., Knieb, J.-P. & Owen, F.N. 2010, MNRAS, 404, 198
- (36) Ivison, R.J., Papadopoulos, P.P., Smail, I., Greve, T.R., Thomson, A.P., Xilouris, E.M. & Chapman, S.C. 2011, MNRAS, 412, 1913
- (37) Kennicutt, R.C. 1998, ARA&A, 36, 189
- (38) Kewley, L.J. et al. 2006, MNRAS, 372, 961
- (39) King, A. 2003, ApJ, 596, L27 AJ, 136, 1866
- (40) Klamer, I. et al. 2005, ApJ, 621, L1
- (41) Kraemer, S.B., Wu, C.-C., Crenshaw, D.M. & Harrington, J.P. 1994, ApJ, 435, 171
- (42) Kriss, G.A., Davidsen, A.F., Blair, W.P., Ferguson, H.C. & Long, K.S. 1992, ApJ, 394, L37
- (43) Kovács, A., Chapman, S.C., Dowell, C.D., Blain, A.W., Ivison, R.J., Smail, I. & Phillips T.G. 2006, ApJ, 650, 592
- (44) Lacy, M. et al. 2004, ApJS, 154, 166
- (45) Lacy, M. et al. 2005, ApJS, 161, 41
- (46) Lacy, M., Petric, A.O., Sajina, A., Canalizo, G., Storrie-Lombardi, L.J., Armus, L., Fadda, D. & Marleau, F.R. 2007a, AJ, 133, 186
- (47) Lacy, M., Sajina, A., Petric, A.O., Seymour, N., Canalizo, G., Ridgway, S.E., Armus, L. & Storrie-Lombardi, L.J. 2007b, ApJ, 669, L61
- (48) Lacy, M. et al. 2012, in preparation
- (49) Li, Y. et al. 2007, ApJ, 665, 187
- (50) Leyshon, G. & Eales, S.A. 1998, MNRAS, 295, 10
- (51) Leyshon, G., Dunlop J.S. & Eales, S.A. 1999, MNRAS, 309, 474
- (52) Lonsdale, C.J. et al. 2003, PASP, 115, 897
- (53) Lowe, S.R. et al. 2007, A&A, 474, 1093
- (54) Maraston, C. 2005, MNRAS, 362, 799
- (55) Marconi, A. & Hunt, L.K. 2003, ApJ, 589, L21
- (56) Mauduit, J.C. et al. 2011, in preparation
- (57) Marconi, A., Axon, D.J., Maiolino, R., Nagao, T., Pastorini, G., Pietrini, P., Robinson, A. & Torricelli, G. 2008, ApJ, 678, 693
- (58) Martínez-Sansigre et al. 2005, Nat, 436, 666
- (59) Martínez-Sansigre et al. 2006, MNRAS, 370, 1479
- (60) Martínez-Sansigre, A. & Taylor, A. 2009, ApJ, 692, 964
- (61) Martínez-Sansigre, A. et al. 2009, ApJ, 706, 184
- (62) Menéndez-Delmestre, K. et al. 2009, ApJ, 699, 667
- (63) Nesvadba, N.P.H. et al. 2010, A&A, 525, A43
- (64) Norman, C. et al. 2002, ApJ, 571, 218
- (65) Oliver, S.J. et al. 2010, A&A, 518, L21
- (66) Papadopoulos, P.P. & Ivison, R.J. 2002, ApJ, 564, L9
- (67) Papovich, C. et al. 2006, AJ, 132, 231
- (68) Patnaik, A.R., Browne, I.W.A., Wilkinson, P.N. & Wrobel, J.M. 1992, MNRAS, 254, 655
- (69) Pei, Y.C. 1992, ApJ, 395, 130
- (70) Persson, S.E., Murphy, D.C., Krzeminski, W., Roth, M. & Rieke, M.J. 1998, AJ, 116. 2475
- (71) Polletta, M.C. et al. 2006, ApJ, 642, 673
- (72) Polletta, M. et al. 2009, A&A, 492, 81
- (73) Polletta, M. et al. 2011, A&A, in press (arXiv:1107.2129)
- (74) Rayner, J.T. et al. 2003, PASP, 115, 362
- (75) Reuland, M. et al. 2007, AJ, 133, 2607
- (76) Reyes, R. et al. 2008, AJ, 136, 2373
- (77) Richards, G.T. et al. 2006, AJ, 131, 2766
- (78) Riechers, D.A. et al. 2006, 650, 604
- (79) Riechers, D.A. et al. 2010, 720, L131
- (80) Robert, C., Leitherer, C. & Heckman, T.M. 1993, ApJ, 418. 749
- (81) Sajina, A., Scott, D., Dennefeld, M., Dole, H., Lacy, M. & Lagache, G. 2006, MNRAS, 369, 939
- (82) Sanders, D.B., Soifer, B.T., Elias, J.H., Madore, B.F., Matthews, K., Neugebauer, G. & Scoville, N.Z. 1988, ApJ, 328, 35
- (83) Seymour, N. et al. 2007, ApJS, 171, 353
- (84) Shapley, A.E., Steidel, C.C., Pettini, M. & Adelberger, K.L. 2003, ApJ, 588, 65
- (85) Sibthorpe, B., Ferlet, M., Bendo, G., Papageorgiou, A. and the SPIRE ICC 2010,“SPIRE Beam Model Release Note, version 1”
- (86) Silk, J. & Rees, M.J. 1998, A&A, 331, L1
- (87) Silverman, J.D. et al. 2010, ApJS, 191, 124
- (88) Stevens, J.A., Amure, M. & Gear, W.K. 2005, MNRAS, 357, 361
- (89) Swinbank, A.M. et al. 2006, MNRAS, 371, 465
- (90) Swinbank, A.M. et al. 2010, Nat, 464, 733
- (91) Tacconi, L.J. et al. 2010, Nat, 463, 781
- (92) Wang, R. et al. 2010, ApJ, 714, 699
- (93) Yan, L. et al. 2010, ApJ, 714, 100
- (94) Wardlow, J.L. et al. 2010, MNRAS, submitted (arXiv:2006.2137)
- (95) Wu, Y. et al. 2011, ApJ, 723, 895
- (96) Zakamska, N.L. et al. 2006, AJ, 132, 1496