New insights into the star formation histories of candidate intermediate-age early-type galaxies from -band imaging of globular clusters
Abstract
We investigate the age and metallicity distributions of bright globular clusters (GCs) in the candidate intermediate-age early-type galaxies NGC 3610, NGC 584 and NGC 3377 using a combination of new Gemini/NIRI -band imaging and existing optical photometry from Hubble Space Telescope data. The versus colour-colour diagram is found to break the age-metallicity degeneracy present in optical colours and spectroscopy, as primarily measures a populations’ metallicity. In addition, it is relatively insensitive to the effect of hot horizontal branch (HB) stars that are known to be present in massive old GCs. By interpolation between Simple Stellar Population model tracks we derive photometric cluster ages, metallicities and masses. In general we find that ”metal-poor” GCs with dex are older than more metal-rich GCs. For the most massive GCs () in NGC 3610 with available spectroscopic data, the photometric ages are older by Gyr, and this difference is more pronounced for the metal-poor GCs. However, the photometric and spectroscopic metallicities are in good agreement. We suggest that this indicates the presence of a hot HB in these massive clusters, which renders spectroscopic ages from Balmer line strengths to be underestimated. To support this suggestion we show that all Galactic GCs with feature hot HBs, except 47 Tuc. Using a recent observational relation between the luminosity of the most massive GC and the galaxy’s SFR at a given age, we find that the galaxies’ peak SFR was attained at the epoch of the formation of the oldest (metal-poor) GCs. The age and [/H] distributions of the metal-rich GCs are broad, indicating prolonged galaxy star formation histories. The peak ages of the metal-rich GCs in the sample galaxies are 3.7, 5.9, and 8.9 Gyr for NGC 3610, NGC 584, and NGC 3377 respectively. The peak value of the age and metallicity distributions of the GCs is correlated with the host galaxies’ luminosity-weighted age and metallicity, respectively, indicating that the GCs can indeed be used as relevant proxies of the star formation histories of galaxies.
keywords:
galaxies: star clusters: general – galaxies: elliptical and lenticular, cD – galaxies: evolution – galaxies: formation – galaxies: individual (NGC 3610, NGC 584, NGC 3377)1 Introduction
Globular clusters (GCs) are among the very few observable fossil records of the formation and evolution of galaxies. The nature of their integrated properties, closely approximated by a Simple Stellar Population (hereafter SSP), significantly simplifies the determination of their ages and metallicities relative to that of the diffuse light of their parent galaxies. Hence they contain crucial information about the history of star formation and chemical enrichment of their parent galaxies (e.g., Whitmore et al., 1999; Goudfrooij et al., 2001). A key development in this respect has been the discovery that the GC systems of many early-type galaxies have bimodal colour distributions (e.g., Kundu & Whitmore, 2001; Larsen et al., 2001; Peng et al., 2006), providing clear evidence for the occurrence of a ”second event” in the formation of these systems. Such a bimodal distribution was actually predicted from merger scenarios of E galaxy formation by Schweizer (1987); Ashman & Zepf (1992), who suggested that young GCs form out of chemically enriched gas during major gas-rich mergers, then redden and fade with time to produce the ”red” population of GCs seen in old ellipticals. Since this prediction, populations of young and intermediate-age GCs have indeed been found in several gas-rich merger remnants (e.g. Holtzman et al. 1992; Schweizer et al. 1996; Miller et al. 1997; Whitmore et al. 1999; Goudfrooij et al. 2001 2001b; Goudfrooij et al. 2007).
Although HST studies have provided much information on the bimodality of GC systems, the typically used or colours provide only limited constraints on the age and metallicity of GCs. This is due to the well-known age-metallicity degeneracy, where increasing age or metal content have a similar effect in reddening the optical colours. The non linear relation between optical colour and metallicity adds an additional complication in the interpretation of colour bimodality (Yoon et al., 2006). In principle, spectroscopy is a more accurate way to estimate age and metallicity. However, in practice this is very time consuming even for an 8-10m class telescope, and only 1-2 handfuls of GCs per galaxy have been studied in this way to date with sufficient precision (e.g., Forbes et al., 2001; Goudfrooij et al., 2001; Puzia et al., 2005; Woodley et al., 2010; Alves-Brito et al., 2011).
Another way to break the age-metallicity degeneracy is to combine optical and near-infrared colours. In the optical, hot evolved stars (e.g., horizontal branch (HB) stars and blue straggles) and young main sequence stars (if present) contribute significantly to the integrated light. They also enhance the strength of high-order Balmer lines, which causes a bias toward younger ages when classically derived from such absorption lines (see more in Sect. 5.1). Conversely, for ages Gyr, the near-IR is completely dominated by light from red giant stars. Thus near-IR colours like or measure the typical temperature of the giant branch, which is known to be directly sensitive to metallicity without any significant age dependence (e.g., Worthey et al., 1994). Relative to optical spectroscopy, the ”optical+near-IR” imaging technique has the additional advantage that a larger number GCs can be detected in a reasonable observing time per galaxy. This technique was pioneered for GCs in intermediate-age galaxies by Puzia et al. (2002) (see also Goudfrooij et al., 2001) using ground-based (ESO/VLT) -band imaging in combination with Wide Field Planetary Camera 2 (WFPC2) - and -band data from HST to study NGC 3115 and NGC 4365, two nearby early-type galaxies. Puzia et al. (2002) found that NGC 4365 hosts a significant number of intermediate-age ( Gyr old) GCs, whereas NGC 3115 only hosts ”old” GCs. The age and metallicity values found for GCs by Puzia et al. (2002) were confirmed by subsequent spectroscopy of a handful of GCs in these two galaxies (Kuntschner et al., 2002; Larsen et al., 2003). Finally, the complications with the non-linear relation between optical colour and metallicity is safely avoided with optical-NIR colours (e.g. Cantiello & Blakeslee, 2007; Kundu & Zepf, 2007; Spitler et al., 2008). Hence, the optical+near-IR imaging technique is a valuable alternative to spectroscopy in studying GC age and metallicity distributions (see also Chies-Santos et al., 2011).
The discovery of a significant number of intermediate-age GCs in a fairly ”normal” elliptical galaxies like NGC 4365 (Puzia et al. 2002, Kundu et al. 2005, but see Brodie et al. 2005, Chies-Santos et al. 2011) and NGC 5813 (Hempel et al. 2007a, 2007b) highlights the power of GCs in probing major star formation events in galaxies. While such an intermediate-age population in NGC 4365 might not seem unexpected given the presence of a kinematically decoupled core, it has not been identified from the galaxy’s integrated light. This raises the important question whether or not early-type galaxies, which show signs of past interactions or mergers, generally host intermediate-age, metal-rich subpopulations.
In this paper we use the optical/near-IR technique mentioned above to constrain the presence of intermediate-age population(s) of GCs in a small sample of nearby early-type galaxies that show signs of having undergone a dissipative merger several Gyr ago. Our target galaxies are NGC 3610, NGC 3377 and NGC 584 described further in the next section.
2 The Target Galaxies
The target galaxies were selected to have the following properties at the time of proposal submission: (i) The galaxy is an E or E/S0 galaxy that is nearby enough ( km s-1) to detect several tens of GCs in the band in reasonable exposure times, (ii) the galaxy has a rich GC system with high-quality optical GC colours measured with HST (; Kundu & Whitmore, 2001) whose distribution does not show a clear bimodality (the absence of such bimodality is expected in the presence of a significant subpopulation of GCs that is metal rich and of intermediate-age; see also Kissler-Patig et al., 1998), and (iii) measurement of (luminosity-weighted) age from integrated-light spectroscopy or photometry is in the range 2 – 5 Gyr. Table 1 lists relevant basic properties of the galaxies in our sample. Population properties of the sample galaxies from recent literature is discussed in more detail in Sect. 7.1).
| Galaxy | Classification | D | Agespec | [Z/H]spec | SFRPeak | ||||||
| RSA | RC3 | [Mag] | [Mag] | [Mpc] | [Mag] | [Mag] | [Mag] | [Gyr] | [dex] | [yr] | |
| (1) | (2) | (3) | (4) | (5) | (6) | (7) | (8) | (9) | (10) | (11) | (12) |
| NGC 3610 | E5 | E5: | 0.03 | ccfootnotemark: | 34.84 | 1.14 | 1.96 | eefootnotemark: | eefootnotemark: | 234 | |
| NGC 584 | S01 | E4 | 0.14 | aafootnotemark: | 20.14 | 1.14 | 1.91 | ddfootnotemark: | ddfootnotemark: | 101 | |
| NGC 3377 | E5-6 | E6 | 0.11 | bbfootnotemark: | 13.87 | 1.11 | 1.81 | ddfootnotemark: | ddfootnotemark: | 75 | |
3 Observations and Data Reduction
3.1 Observations
We performed near-infrared -band () imaging of NGC 3610, NGC 3377, and NGC 584 with the Near-Infra-Red Imager and Spectrometer (NIRI) instrument on Gemini North (Hodapp et al., 2003). Our program ID was GN-2004A-Q-17. We used the f/6 NIRI camera imaging mode, which provides a plate scale of 0.117 arcsec/pixel and a field of view of arcmin2, similar to the field of view of the WFPC2 and ACS cameras aboard HST.
In order to reliably detect the presence of both ”blue” and ”red” GCs, with S/N similar to that of the WFPC2 data, the targeted limiting magnitude was the typical turnover magnitude of GC systems of ”normal” galaxies: mag (e.g., Kundu & Whitmore, 2001; Larsen et al., 2001), corresponding to for a typical colour of an ”old” (age of 14 Gyr) SSP with [Fe/H (e.g. Bruzual & Charlot, 2003). The exposure times to reach the limiting magnitudes (cf. Table 2) were estimated according to the distance moduli and were such that NGC 3377 was observed in a single night, while NGC 3610 and NGC 584 required observations to be spread over two and four nights, respectively. Table 2 summarizes the observations and night conditions.
| Target | Nights | FWHM | Total Exposure | |
| yyyy-mm-dd | arcsec | images | seconds | |
| NGC 3610 | 2004-02-10 | 64 | 3840 | |
| 2004-02-11 | 55 | 3300 | ||
| NGC 584 | 2004-07-28 | 35 | 2100 | |
| 2004-07-29 | 34 | 2040 | ||
| 2004-07-30 | 31 | 1860 | ||
| 2004-07-31 | 38 | 2280 | ||
| NGC 3377 | 2004-03-02 | 28 | 1680 |
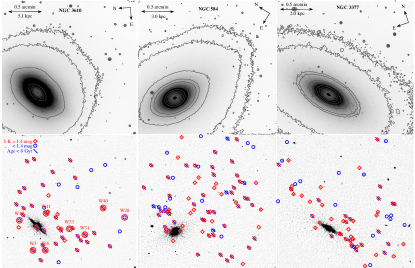
In Figure 1 we show the spatial coverage of the NIRI observations. The character of the spatial distribution of detected GCs reflects the overlap between the NIRI and the HST/ACS,WFPC2 fields of view. Globular clusters shown with different symbols reflect their properties as derived in Section 5.
3.2 Data Reduction
Image reduction was performed with tasks of the gemini/niri111http://www.gemini.edu/sciops/data-and-results/processing-software packages within iraf222IRAF is distributed by the National Optical Astronomy Observatories, which are operated by the Association of Universities for Research in Astronomy, Inc., under cooperative agreement with the National Science Foundation.. Due to the ”first frame”333First frame problem arises because the NIRI array is not continuously reset when idle. Thus, each new exposure after idle has different dark current level, probably due to image persistence after saturating the array (NIRI has no shutter). problem of the NIRI detector, all first exposures (dark, flat and on-/off-target images) of each new sequence were excluded before basic image processing.
Normalized flats were constructed from images taken with the calibration unit shutter closed (”lamps off”) subtracted from exposures taken with the shutter open (”lamps on”) and using short darks to identify bad pixels. Flat field images with the IR lamp on and off allow separation of the instrumental thermal signature from the sensitivity response.
The near-IR sky level and structure varies on time scales of a few minutes. To account for such variations the imaging sequence of four on- followed by four off-target exposures provides close enough in time blank fields to derive the sky flat and correct the on-target exposures.
Some of the NIRI frames contain an electronic pattern visible as vertical striping with a period of eight columns and not always present in all quadrants. Before including the affected frames in our image processing list we used the stand-alone python routine, nirinoise.py444http://staff.gemini.edu/astephens/niri/patternnoise/ which almost perfectly removed the striping. The same image reduction steps were applied to the standard star observations as well. We discarded few images which had trails or double-peaked stellar profiles reflecting the loss of the guide star resulting in improper telescope guiding.
All reduced science and standard star exposures of the corresponding nights were registered to a common coordinate system with niri/imcoadd based on geomap geometric solutions. The final science image of each galaxy is derived from average combined individual images scaled to that of the most photometric night for the case of NGC 3610 and NGC 584, which were observed over few nights. The total number of combined individual exposures for NGC 3610, NGC 3377, and NGC 584 is N=119, N=28, and N=137, respectively. The result is one deep stacked -band image per galaxy.
4 Detection, photometry and calibration
4.1 Detection and photometry
Globular clusters in our ground based images would appear as unresolved point sources due to the relatively large NIRI pixel scale at the distances to the galaxies. For the nearest galaxy in our sample NGC 3377 at a distance of 10.8 Mpc we have a projected spatial resolution of 6 pc/pix. This is twice the typical half-light radius ( pc) of a GC (e.g. Barmby et al., 2007; Masters et al., 2010). NGC 3610 and NGC 584 are at much greater distances of 34.8 and 20.1 Mpc, respectively. Thus, even for the most nearby galaxy NGC 3377, the GCs on the ground-based images will appear as point sources with a stellar PSF, which determined the type of detection and photometry of GCs.
To detect555All reduction and analysis has been performed with IRAF procedures. as many GCs as possible to match with existing deeper HST photometry for these galaxies (Goudfrooij et al., 2007; Kundu & Whitmore, 2001), we first created images representing the integrated light component of the galaxy by smoothing the combined images with a circular median filter with a radius of 8 times the seeing FWHM of the input image. The choice of the median filter radius resulted from tests designed to render the residual effect of point sources in the images negligible. This was done by measuring the magnitude difference between the original and median-subtracted images of several isolated non-saturated point sources. The original combined image was then divided by the square root of the smoothed image, providing an image with uniform shot noise characteristics (e.g., Goudfrooij et al., 2007). This facilitates the uniform detection of point sources at a detection threshold of above the background, using the daofind task. The resulting object coordinates were used as input for PSF photometry performed on images from which the smooth galaxy light was subtracted. PSF models with radius 3 the point source FWHM were created using several non-saturated point sources. PSF-fitting magnitudes were scaled using aperture photometry with a radius of 4 pix for the PSF stars. To estimate aperture corrections from curve-of-growth analysis, photometry of the PSF stars was performed with aperture radii of pixels. We found very similar aperture corrections for the PSF magnitudes among the three sample galaxies ( mag).
4.2 Photometric Calibration
Photometric calibration was performed using photometric standards (FS 6, FS 23, FS 34, FS 103, FS 111, FS 126, FS 130, FS 131 and FS 134) observed during the same nights as the target galaxies. Their instrumental magnitudes were measured with the same aperture as their measured catalog magnitudes in Leggett et al. (2006). Thus, we derive consistent transformation solutions from instrumental to standard photometric system for all objects in our photometric lists. To allow for optical-to-near-IR colour terms in the photometric calibration of the -band data, we used the -band magnitudes of the photometric standard stars in Table 1 of Hawarden et al. (2001), who compiled measurements from Sandage & Katem (1982); Lasker et al. (1988); McCook & Sion (1987); Carlsberg Meridian Catalogue (1989); Leggett (1992); Landolt (1992). Hence, the derived photometric transformations will take into account the colour of the object.
We evaluated a least squares fit to the following photometric transformation equation:
| (1) |
where is the instrumental magnitude, is the zero-point, and are the airmass and colour term coefficients. The zero-point and airmass coefficients were fitted around their typical values666http://www.gemini.edu/?q=node/10104 mag, mag/airmass. However, a best fit (low rms and coefficients uncertainty) was achieved for fixed airmass coefficient at mag/airmass777The mean value found for a typical variation of the water vapor amount on Manua Kea (Tokunaga et al., 2002), while the zero-point and colour term coefficients were kept variable. This resulted in stable solutions for the zero-point and the colour term coefficients, close to their typical values (cf. Table 3). Due to the only one standard star observed during the NGC 3377 observing run, we fit the using a constant value for the colour term, which is the mean value obtained from the NGC 3610 and NGC 584 calibrations. Excluding both, and from the fit results in a mag, i.e. within the uncertainty estimate of the value with the airmass and colour coefficients included. All transformation coefficients are summarized in Table 3.
| 111The mean value for a typical water vapor variation on Manua Ke (Tokunaga et al., 2002) | |||
|---|---|---|---|
| NGC 3610 | |||
| NGC584 | |||
| NGC 3377 |
To convert the GCs’ instrumental to standard magnitudes, -band magnitudes of detected GCs in our images were adopted from the HST/ACS and WFPC2 optical photometry in Kundu & Whitmore (2001) for NGC 584 and NGC 3377 and Goudfrooij et al. (2007) for NGC 3610. To match the NIRI and HST photometric lists, we transformed the ACS and WFPC2 GC pixel coordinates to the NIRI image pixel coordinate system by deriving geometric transformation solutions with geomap and applying them with geoxytran IRAF routines. The transformation from instrumental to magnitudes of our sample GCs was performed by evaluating calibration equation (1), taking into account the colour of the cluster. In Table 4 we list the photometric properties of all GCs with photometry which are discussed in the following.
| ID | RA,DEC (2000) | Age | [Z/H] | |||||
| [hh:mm:ss],[dd:mm:ss] | [mag] | [mag] | [mag] | [mag] | [Gyr] | [dex] | [] | |
| (1) | (2) | (3) | (4) | (5) | (6) | (7) | (8) | (9) |
| NGC 3610 | ||||||||
| G2/W3 | 11:18:28.12 58:47:15.8 | |||||||
| G4/W6 | 11:18:28.19 58:47:04.9 | |||||||
| G10/W11 | 11:18:23.96 58:47:02.5 | |||||||
| G11/W12 | 11:18:24.61 58:47:26.5 | |||||||
| G26/W28 | 11:18:24.88 58:45:53.0 | |||||||
| G30/W31 | 11:18:26.62 58:46:29.0 | |||||||
| G34/W33 | 11:18:25.86 58:46:42.6 | |||||||
| G46/W40 | 11:18:23.69 58:46:11.7 | |||||||
| NGC 3377 | ||||||||
| G1 | 10:47:42.39 13:59:33.7 | |||||||
| G2 | 10:47:43.74 14:00:17.5 | |||||||
| G4 | 10:47:39.23 13:59:42.6 | |||||||
| G5 | 10:47:43.74 13:59:46.1 | |||||||
| G6 | 10:47:37.31 14:00:04.5 | |||||||
| NGC 584 | ||||||||
| G1 | 01:31:19.98 06:51:40.5 | |||||||
| G2 | 01:31:20.46 06:52:50.1 | |||||||
| G4 | 01:31:17.07 06:52:25.1 | |||||||
| G5 | 01:31:16.93 06:51:21.1 | |||||||
| G6 | 01:31:17.28 06:52:37.2 | |||||||
4.3 Completeness in K-band
To determine the completeness of the K-band observations, we used the addstar task in IRAF to add artificial sources to the final stacked image of each galaxy. To avoid introducing increased crowding to the images while retaining a high number of artificial stars per spatial and magnitude bin for reliable statistics, we added 100 stars per image and repeated this step 100 times888The value of the seed in addstar was different for each frame, i.e. in total artificial stars per galaxy. The images were then run through the same extended galaxy light subtraction, detection and photometry steps. Detected and input artificial star lists were matched to compute the completeness as a function of magnitude. The completeness curves are shown in Figure 2. With smooth solid lines we show a two-power-law fit to the completeness values at each 0.5 mag bin. These functions were later used to assess completeness levels as a function of age and metallicity (see Sect. 5.3)
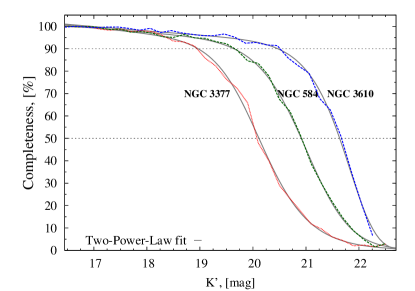
In Table 5 we summarize the and completeness values for the three galaxies. The absolute -band magnitude () was calculated using the galaxies’ respective distance moduli (see Sect. 3.1), and a mag colour for the GCs, which is the mean of the observed range of mag. Thus, at the respective distance to these galaxies we observe, with completeness, just at the GC luminosity function turnover magnitude (GCLF ToM) for NGC 3377, and about 0.5 and 1 mag brighter than the GCLF ToM for NGC 584 and NGC 3610, respectively. This corresponds to a luminosities greater than a few , meaning that our -band GC detection samples the brightest and most luminous GCs. We note, that the currently best estimate of the distance modulus of NGC 3610 was derived yrs after the observations (see Sect. 3.1), which were planned with a closer distance to NGC 3610. This led to a lower completeness than planned for NGC 3610.
| Target | |||
|---|---|---|---|
| [mag] | [mag] | [] | |
| completeness | |||
| NGC 3610 | 21.71 | ||
| NGC 584 | 20.92 | ||
| NGC 3377 | 20.08 | ||
| completeness | |||
| NGC 3610 | 20.51 | ||
| NGC 584 | 19.66 | ||
| NGC 3377 | 18.95 | ||
5 colour, age and metallicity distributions of GCs
As already mentioned in the Introduction, the combination of optical and near-infrared imaging photometry is a very efficient method to access the distribution of ages and metallicities for an entire globular cluster system of a galaxy by means of a comparison to predictions of stellar population synthesis models. The specific power of this ”optical+NIR” method is twofold:
-
1.
for a population of coeval stars older than Gyr, near-IR colour indices like or mainly sample the metallicity sensitive temperature distribution of stars on the RGB (e.g. Worthey, 1994). In combination with an optical colour like , which is sensitive to both metallicity and age, this allows to break down the age-metallicity degeneracy present in the optical colour indices.
-
2.
Relative to optical colours and spectral indices, near-IR colours are significantly less sensitive to the presence of evolved hot stars such as blue horizontal branch (HB) stars and blue stragglers. Blue HBs can be present in GCs older than Gyr (starting with metal-poor GCs; see e.g. Lee et al., 2000; Yi, 2003), and the relative number of blue versus red HB stars in GCs is known to depend mainly on age, metallicity, and GC mass (e.g., Carretta et al., 2010; Dotter et al., 2010, 2011). Hence, the presence of blue HB stars in GCs can cause incorrect age determinations when using optical photometry or spectroscopy (see also Schiavon et al., 2004; Cenarro et al., 2007; Percival & Salaris, 2011), while NIR colours are largely insensitive to their presence.
In the following, our age-metallicity analysis will be based on versus diagrams.
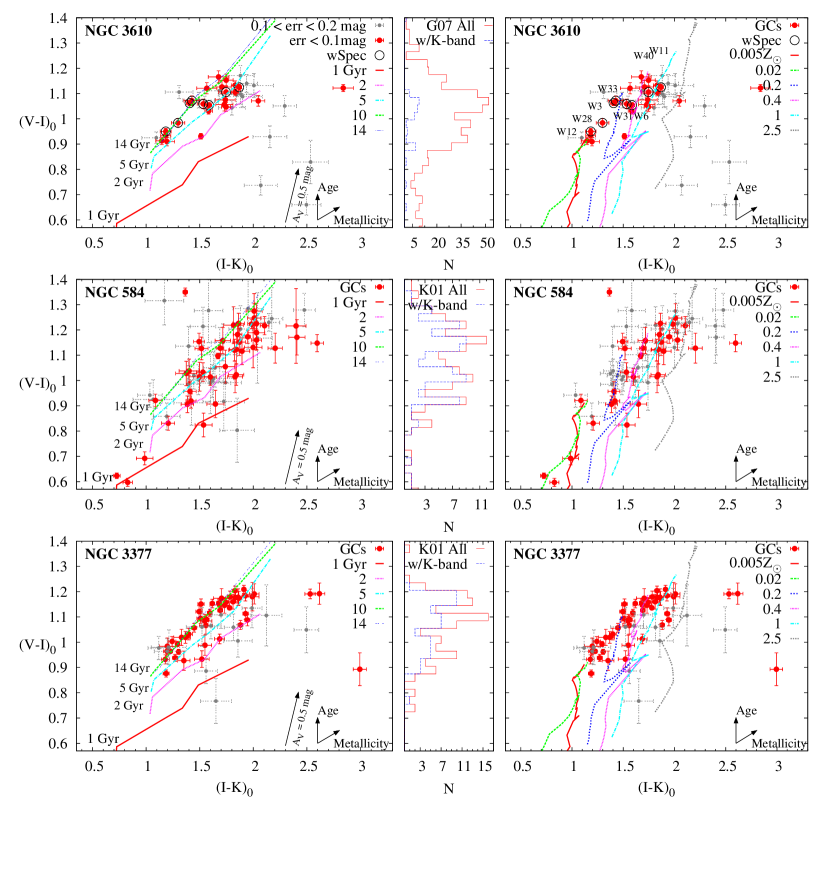
In Figure 3, we present the vs. colour-colour distributions of all GCs detected in in our sample galaxies. Those are compared to Bruzual & Charlot (2003) SSP models using a canonical Chabrier (2003) IMF, for several ages (1, 2, 5, and 14 Gyr) and metallicity values ( = 0.005, 0.02, 0.2, 0.4, 1.0, and 2.5, equivalent to [Fe/H] = 2.3, 1.7, 0.7, 0.4, 0.0, and +0.4)999We note that the quoted photometric [Fe/H] is in fact [Z/H], i.e. the total content of metals relative to hydrogen given in the SSP models. However, the difference between [Z/H] and [Fe/H] is 0.03 dex [Fe/H] dex for low to high metallicities, i.e. much smaller than the measurement error. To avoid confusion in the following we adopt the [Fe/H] annotation for the photometric metallicities as well.. Figure 3 shows that the three galaxies generally show a large spread in age and metallicity among their brightest GCs. A notable subpopulation of roughly coeval bright GCs can be also seen for NGC 3377 (see below). The colours of the majority of the ”blue” population of GCs as judged from the optical data (i.e., ) turn out to be consistent with old ages ( Gyr) and low-metallicities on average (Fe/H dex), while the colours of the optically redder clusters tend to indicate higher metallicities and younger ages (Fe/H dex and Gyr, respectively).
While the overall colour-colour distributions are indicative of a large spread in age and metallicity among the brightest clusters, there is a discernible population of roughly coeval GCs in NGC 3377 (i.e., the GCs between the 2 and 5 Gyr isochrones in the lower left panel of Fig. 3). From our data alone, there is no indication for a spatial correlation among these clusters (cf Fig.1). While such a subpopulation is not readily seen in the other two galaxies, this may be due at least in part to the photometric completeness limits (cf. Table 5). The middle panel histograms in Figure 3 show that our NIRI imaging detects (64/106), (81/115) and (50/611) of the NGC 3377, NGC 584 and NGC 3610 GCs detected with HST, respectively. Although the NIRI imaging samples of the NGC 584 GCs observed with WFPC2, the relatively large photometric errors cause a larger scatter in their colour distributions, which prohibits a clear detection of any underlying subpopulation of coeval GCs similar to that observed in NGC 3377.
5.1 Photometric ages and metallicities
Employing the good resolution in age and metallicity provided by the optical-NIR () colour indices, we derive photometric ages and metallicities for the GCs in our sample. This is done by a standard minimization interpolation between SSP model tracks of Bruzual & Charlot (2003). A brief comparison with other SSP models and the reasoning why we chose Bruzual & Charlot models for this purpose is presented in Section 5.2. The derived ages and metallicities are the weighted average of the age and metallicity of the two nearest tracks. The weights include the distance to the respective model and the photometric errors. This way we also calculate an upper and lower error to the photometric ages and metallicities. We list the derived properties of all GCs in our sample in Table 4.
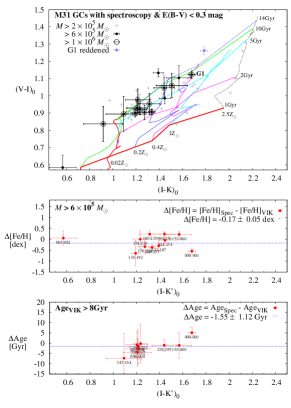
About a dozen of the brightest GCs in NGC 3610 have available Lick index analysis of optical spectroscopy (Strader et al., 2003; Strader et al., 2004). Strader et al. qualitatively discuss the clusters ages, but they do not explicitly provide ages for each cluster. Thus, using their Lick index strengths, we calculate ages for the GCs with the gonzo code (Puzia et al., 2002), using the models of Thomas et al. (2003). Of those GCs, eight are within the NIRI field of view for which we can compare our ages and metallicities with their spectroscopic values. In Figure 4
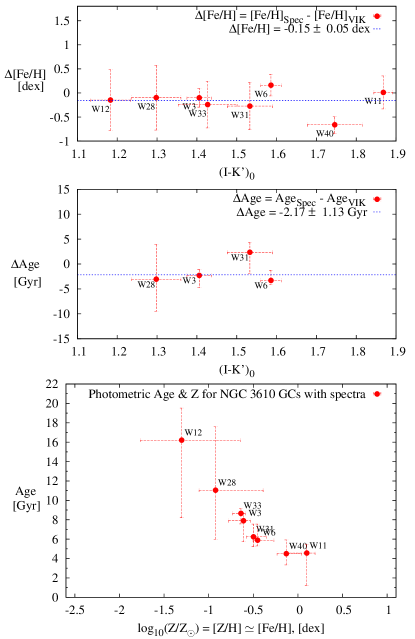
we show these differences (in the sense spectroscopic minus photometric) as a function of colour. Errors in the top and middle panels in Figure 4 are the square root of the sum of the squares of the spectroscopic and photometric errors while errors in the bottom panel are their photometric uncertainties.
The least squares fit to the data (dashed lines in Fig. 4) show that spectroscopic [Fe/H] and photometric metallicities [Z/H] derived from the colours agree very well, keeping in mind that [Fe/HH] to 0.06 dex (cf. Sect. 5 above). In contrast, the photometric age estimates of the most massive GCs in NGC 3610 are older than their spectroscopic values by about 2 Gyr on average. The age difference is larger for low-metallicity GCs than for higher metallicity ones. Such a difference can in principle be caused by the presence of blue horizontal branch (BHB), helium-core burning stars in these clusters. It is well known that spectroscopic luminosity-weighted ages, derived from the classical Hβ vs Mg2 or Mgb absorption line indices, can be biased toward younger ages, especially for metal-poor GCs, because the high effective temperature of BHB stars ( K) and blue stragglers enhances the strength of the Balmer lines (e.g. Lee et al., 2000; Schiavon et al., 2004; Koleva et al., 2008; Ocvirk, 2010; Percival & Salaris, 2011; Xin et al., 2011). An example for such ”age bias” are the metal-poor Galactic GCs NGC 3201 and NGC 5024 featuring BHBs, whose spectroscopically derived age (from Hβ vs. Mg2) is Gyr (Perina et al., 2011), while their ages from deep HST CMD fitting is Gyr (Dotter et al., 2010). Furthermore, nearly all massive ( mag) Galactic GC have hot HBs (e.g. Recio-Blanco et al., 2006; Lee et al., 2007), with the exception of the metal-rich GC 47 Tuc. This may be due to its low central escape velocity () for a massive cluster at that metallicity, unlike the metal-rich NGC 6388 and NGC 6441 which do have BHBs and larger (cf. Fig. 5 in Georgiev et al., 2009) and thus better able to retain/accrete processed stellar ejecta. Puzia et al. (2002) performed a Lick index analysis for metal-rich Galactic GCs and they note that NGC 6388 and NGC 6441 (which host BHB stars) show a stronger Hβ index than the other metal-rich RHB GCs. However, Schiavon et al. (2004) estimate ages of and Gyr from Lick index spectroscopy for these two clusters, which indicates that spectroscopic age-dating of metal-rich GCs can be less biased by the HB morphology. This is what we do indeed observe in the middle panel of Figure 4 for W 6 and W 31, two metal-rich GCs in NGC 3610: their photometric and spectroscopic ages are more consistent (see also Sect. 6). More pronounced HB effect is expected for metal-poor GCs, which we indeed observe for the two metal-poor GCs in the middle panel of Figure 4. This indicates that in spite of uncertainties inherent to SSP models, the most likely cause for the mean difference between photometric and spectroscopic ages for these GCs is the presence of hot HB stars, in particular for the metal-poor GCs.
The validity of the method of deriving ages and metallicities from , and photometry used in this paper is supported by the observation that dereddened and colours of old GCs in the Milky Way and M 31 have been shown to be consistent with Bruzual & Charlot SSP model predictions for ”old” ages ( Gyr) throughout the range of [Z/H] sampled, (see Fig. 5 of Puzia et al., 2002). The applicability of our method is illustrated in Figure 5 using the same M31 GCs data as in Puzia et al. (2002), i.e. magnitudes from Barmby et al. (2000); Barmby et al. (2001), augmented with new spectroscopic measurements from Beasley et al. (2005) and Caldwell et al. (2011), the latter providing updated values. Even though the are uncertain ( mag, see Caldwell et al., 2011), the colours are consistent with the Bruzual & Charlot SSP model predictions, even so for GCs massive () and mag. We derive their photometric ages and metallicities, which compare well with their spectroscopic values from Caldwell et al. (2011), while spectroscopic ages for the oldest GCs (Age Gyr), on average, are younger, i.e. showing the BHB effect. Due to this problem, Caldwell et al. (2011) does not derive spectroscopic ages for the majority of the GCs and assume age of 14 Gyr. We consider only GCs with spectroscopic ages in Figure 5.
5.2 Comparison to various SSP models
It is beyond the aims of this paper to test different SSP models and investigate the nature of the differences between them. However, in order to provide a qualitative overview of how different synthesis population models compare to the observed colours of NGC 3610 GCs with available spectroscopy, we compare our data with the popular SSP models of BC03 (Bruzual & Charlot, 2003), Galev (Anders & Fritze-v. Alvensleben, 2003; Anders et al., 2009), Vazdekis/MILES (Vazdekis et al., 2010), TSPoT (Brocato et al., 2000; Raimondo et al., 2005), and the Maraston (Maraston, 2005) SSPs for blue and intermediate-to-red HBs. Results are shown in Figure 6.
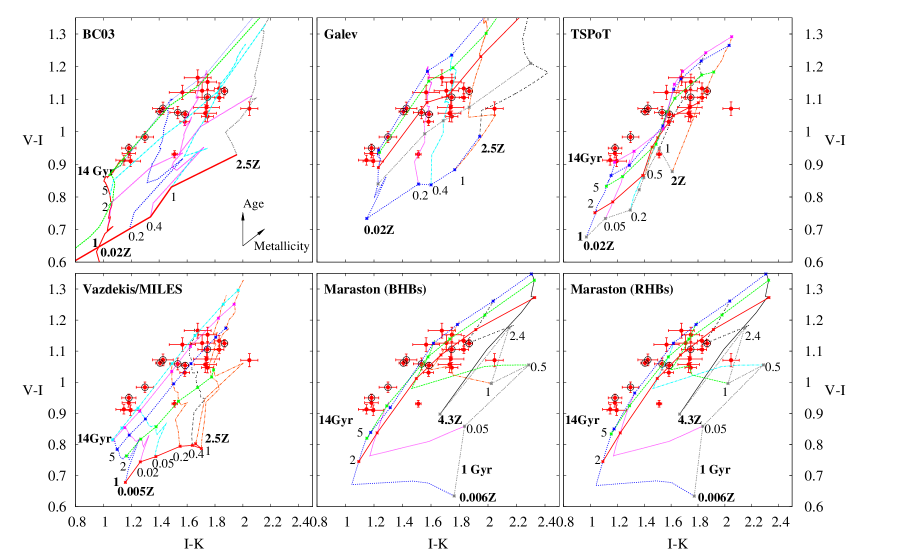
As seen, the different SSP models yield significantly different results in terms of ages and metallicities. This is due in part to the different treatment of key stellar evolutionary phases, e.g. the TP-AGB and post-AGB phases, HB stars, etc., which are relatively poorly understood and empirically constrained. In addition, the different SSP models use different stellar atmosphere spectral libraries (theoretical or empirical), and different stellar evolution prescriptions. The effects of different choices of the IMF on the integrated colours are, however, smaller than the observational errors. Overall, our data is best represented by the BC03 SSP model, especially for low metallicities and old ages. This is why we use BC03 to derive and discuss ages and metallicities for our clusters in the following.
5.3 GC age and metallicity distributions
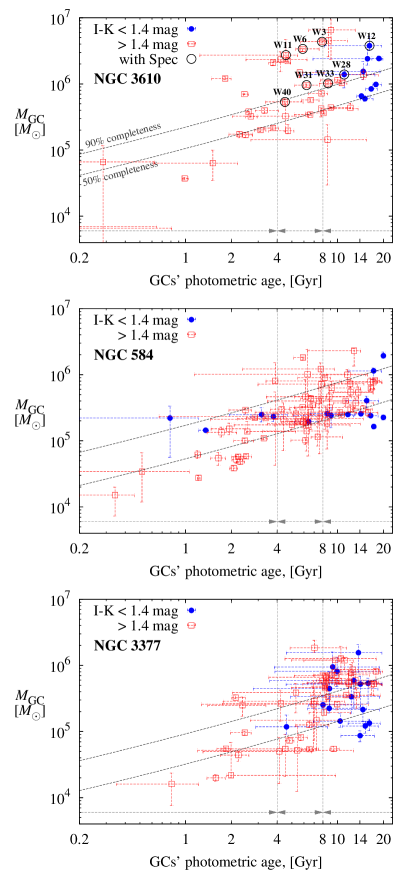
In Figure 7 we show the photometric age and metallicity distributions for the GCs in the three target galaxies.
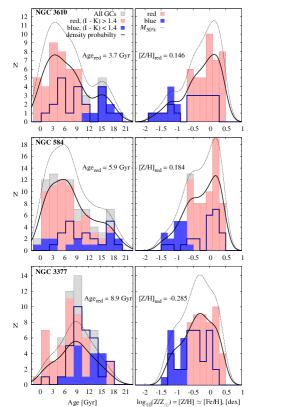
Employing the good separation in the colour in the SSP models (cf e.g. Fig. 3) between metal-rich and metal-poor and older versus younger populations, we separate the GCs in two subpopulations, namely redder and bluer than mag, corresponding to dex for a population older than about 5 Gyr. Within 101010R is a language and environment for statistical computing and graphics (http://www.r-project.org)., we then estimate the highest-probability age for the metal-rich GCs using a non-parametric probability density estimator with a Gaussian kernel with size of 2 Gyr. Those probability density estimates are shown with solid lines in Figure 7 and the peak values for the age distribution of the metal-rich GCs (Agered) are shown with labels. It is seen that Agered increases from Gyr for NGC 3610, to Gyr for NGC 584 and Gyr for NGC 3377. To assess the statistical level of similarity between the age distributions of the three galaxies, we consider that one can not expect Gaussian (or any other anticipated functional form) for the cluster age distributions. Formally, this precludes the use of the Kolmogorov-Smirnov test which is commonly used for comparing statistical similarity between two samples. We therefore use the Mann–Whitney U test111111 The Mann–Whitney U test (a.k.a. Mann-Whitney-Wilcoxon rank-sum test or u-test) is a non-parametric statistical hypothesis test which calculates a measure of the difference between two independent samples of observations. It is similar to the t-test, but is more robust because it compares the sums of ranks and thus is less sensitive to the presence of outliers., which yields that the distribution of GC ages in NGC 3610 is different from those of NGC 584 and NGC 3377 with a probability of 75% and 98%, respectively. The age distribution of GCs in NGC 584 differs from that in NGC 3377 with 98% probability. Thus, the brightest GCs in NGC 3610, NGC 584 and NGC 3377 have statistically significant different age distributions from one another and the peak age of the metal-rich subpopulation increases from NGC 3610 to NGC 584 and NGC 3377, respectively.
The age and metallicity distributions are affected by observational incompleteness. To assess the correction that likely needs to be applied, we used the functional relations between , mass, and Age using the Bruzual & Charlot (2003) SSP model. Since the HST/ACS and WFPC2 -band photometry is complete for all detections, no additional completeness corrections are necessary. We fit power-law and logarithmic functions to the vs. [Fe/H] and age relations for mass at the completeness level at 2 and 14 Gyr and for all metallicities, respectively, obtained from the Bruzual & Charlot (2003) SSP models (cf. lines in Fig. 9). The age and [Fe/H] distributions were then convolved with these functional relations to illustrate the completeness correction for incompleteness. These estimates are shown with light dashed lines in Figure 7. Due to the relatively shallow slope of the relation (cf. Fig. 9), the incompleteness affects equally metal-poor and metal-rich GCs, unless if metal-poor GCs tend to be larger and less dense which could bias their detection.
Keeping in mind photometric uncertainties, the age and metallicity distributions in Figure 7 seem to indicate the presence of multiple GC populations in the sample galaxies.
6 Colour-Magnitude and mass-metallicity distributions
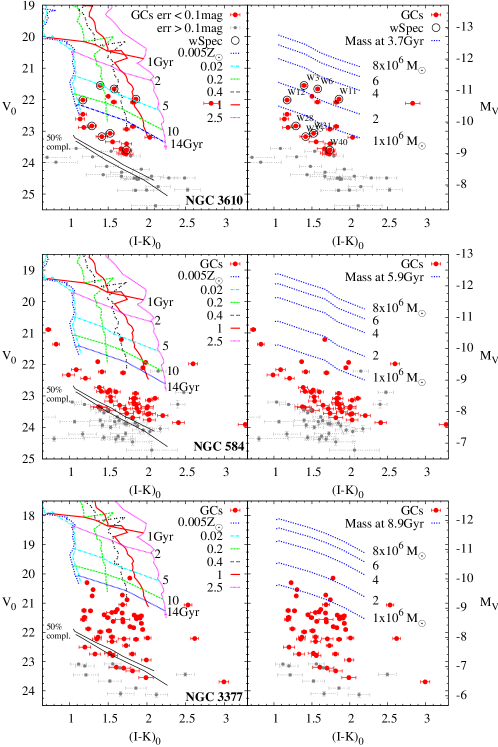
The colour-magnitude diagrams of GCs in the three merger-remnant galaxies is presented in Figure 8. With different lines in the left-hand panels of Figure 8 we show Bruzual & Charlot (2003) SSP model tracks for all metallicities scaled to the luminosity of a GC with M⊙ at 14 Gyr, using model values. The iso-mass lines in the right-hand panels in Figure 8 are calculated using the model at 14 Gyr. This comparison shows that the masses of the GCs with data range from a few up to a few . The upper and lower solid lines in the left panels labeled with completeness indicate the completeness at 14 and 2 Gyr, respectively, estimated using the SSP model prediction for the colour.
To convert the colour-magnitude diagrams to mass-metallicity distributions, we use values provided by the SSP model to convert from GC luminosities to masses using the distance moduli to the galaxies. For comparison purposes, we also include info on GCs in the Milky Way (hereafter MW GCs). MW GC masses were calculated using data from McLaughlin & van der Marel (2005) and Harris (1996). In Figure 9 we show the mass-metallicity distributions of all GCs in the sample galaxies. To highlight the GCs that are old enough to have developed HBs, we divide the GCs in two subsamples: older or younger than 8 Gyr (solid blue circles and open red squares, respectively). The MW GCs with extended121212 mag; Lee et al. (2007). HBs, i.e. EHBs, blue HBs, or red HBs in the bottom panel are shown with solid (blue) circles, (blue) crosses and open (red) squares, respectively. As Figure 9 shows, all MW GCs more massive than (indicated with a horizontal dashed line) have hot HBs (EHBs or BHBs), except 47 Tuc.
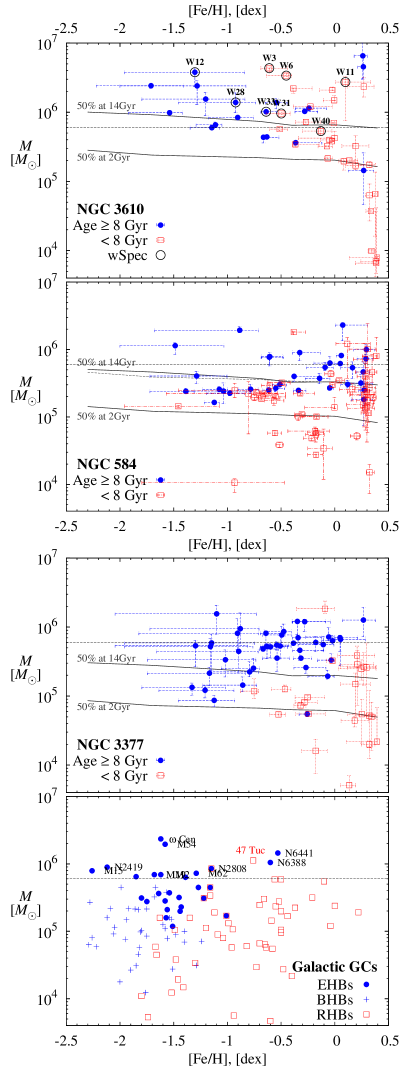
As expected, the GCs in NGC 3610 with spectroscopy are among the most massive ones (). However, among those, only W 28 is formally older than 8 Gyr with Gyr, and the age of W 3 is Gyr, equal to 8 Gyr within the measurement errors. This renders them good candidates for GCs that host BHB stars. This further supports the interpretation of the difference between photometric and spectroscopic ages due to the effect of the BHB in these metal-poor GCs as discussed in Section 5.1. On the other hand, the younger W 31 and W 6 ( Gyr, [Z/H] and Gyr, [Z/H]) likely have not yet developed BHBs, which would explain the consistent photometric and spectroscopic ages seen in Figure 4.
7 Comparing properties of globular clusters with those of their host galaxies
Our aim is to assess information on the star formation histories (SFHs) of the galaxies in our sample as determined from the properties of their GCs, and compare it to known population properties of the host galaxies themselves. This will not only test for consistency between the two approaches, it will also highlight the particular insights gained from the combination of deep optical and near-IR photometry of GCs in nearby galaxies.
7.1 Ages and metallicities
Under the assumption that massive GCs were formed during major star formation epochs in the galaxies’ assembly history, one would expect a relation between the peak ages (and metallicities) for the GCs and the (luminosity-weighted) ages and metallicities of their host galaxies. To test for such a relation, we collected recent age and metallicity measurements for the integrated light of the sample galaxies from the literature. These are listed in Table 6, and were derived from and colours (Li et al., 2007) as well as Lick indices from long-slit spectroscopy by Howell (2005) and Sánchez-Blázquez et al. (2006) using the Thomas et al. (2003) and Vazdekis/MILES SSP models, respectively. Sánchez-Blázquez et al. (2006) provide
| Galaxy | Age [Gyr] | [Z/H] | Age | [Z/H] | Age | [Z/H] | GCs Age | [Z/H] |
|---|---|---|---|---|---|---|---|---|
| from (Li et al., 2007) | (Howell, 2005) | (Sánchez-Blázquez et al., 2006) | from this study | |||||
| (1) | (2) | (3) | (4) | (5) | (6) | (7) | (8) | (9) |
| NGC 3610 | ||||||||
| NGC 584 | ||||||||
| NGC 3377 | ||||||||
ages and metallicities from four different index-index diagrams ([MgbFe]–Hβ, Fe4383–Hβ, Mgb–Hβ and CN2–Hβ) and the average of their ”best nine spectral synthesis model fits” (giving the oldest age). We selected the average value of all these five measurements, adding errors in quadrature.
For NGC 3377 there are also age and metallicity estimates from the SAURON project (Kuntschner et al., 2010) at Re, which are 8.1 Gyr and [Z/H] dex. These were derived from comparing Mgb, Fe50, Fe52, and Hβ Lick indices to the Vazdekis/MILES SSP models. These values are similar to the results of Sánchez-Blázquez et al. (2006) for NGC 3377. The SAURON values are not included in Table 6 because the other two galaxies were not in the SAURON survey. An interesting result on NGC 3377 from the latter survey is that its inner 20 arcsec ( kpc) region features a relatively young stellar population with high metallicity located in a rotating structure with disc-like kinematics (Kuntschner et al., 2010). This further supports the accretion/interaction-driven formation history of NGC 3377.
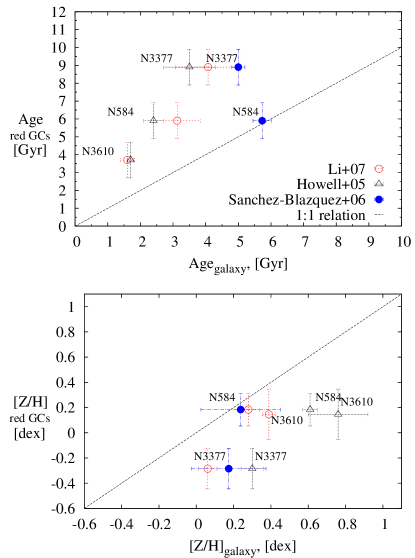
Probing for a correlation between the luminosity-weighted stellar age and metallicity of the galaxy and its GCs, we plot the peak age and metallicity of the GCs versus host galaxy age and metallicity in Figure 10. It is clear that the peak age of the red (i.e. metal-rich) GCs in all galaxies is indeed correlated with the luminosity-weighted mean ages and metallicity of the host galaxy.
The upper panel of Figure 10 suggests that the (luminosity-weighted) ages of the sample galaxies are typically younger than the mean ages of their bright metal-rich GCs. While this difference is likely due in part to systematic effects related to the use of different SSP models, this suggests, at face value, that the galaxies had a prolonged star formation history since the major epoch(s) of massive GC formation. One scenario that could cause this effect is that the star formation occurring more recently than the era indicated by the peak age of the metal-rich GCs featured lower star formation rates. This would form fewer high-mass GCs and thus cause fewer GC detections at a given detection threshold, while still causing higher surface brightness for the integrated galaxy light, thus yielding younger ages for the latter. This scenario can be tested directly by probing less massive red GCs with deeper near-IR imaging data in the future, e.g. using the NIRCAM instrument on the James Webb Space Telescope.
7.2 Reconstructing galaxy SFH through its most massive GC
Following recent development on the relation between galaxy star formation rate (SFR) and the luminosity of its most massive cluster at a given epoch, we attempt to derive the galaxy star formation history (SFH) in this section.
The formation efficiency of young massive clusters that can form in a galaxy has been shown to scale with the galaxy SFR (Larsen & Richtler, 2000). Since the SFR is higher for higher gas densities (Kennicutt, 1998), the formation of massive clusters becomes more likely as well (Larsen & Richtler, 2000; Elmegreen & Efremov, 1997). However, the formation of a massive cluster can also be subject to statistical fluctuation resulting from a size-of-sample effect in which higher SFR galaxies will form more GCs and thus sample better the high-mass end of the cluster mass function (Billett et al., 2002; Larsen, 2002). Under the assumption that the observed relation between the brightest cluster and the galaxy SFR (Larsen, 2002) is explained by a physical limit for the possible range of cluster masses regulated by the galaxy SFR, Weidner et al. (2004) derived relations between the galaxy SFR and the initial (embedded) mass of its most luminous cluster, which allows one to recover the galaxy SFR. To obtain correctly the galaxy SFH, the present-day cluster mass has to be corrected for stellar evolution and dynamical mass-loss to obtain the mass of the cluster at the time of its formation (Maschberger & Kroupa, 2007). However, the most luminous cluster in a galaxy is not always the most massive one. For starburst galaxies, the most massive cluster is typically young as shown in Monte Carlo simulations by Bastian (2008). Conversely, if the duration of the Monte Carlo experiment is extended to few Gyr, the oldest clusters are usually the brightest (Gieles, 2009). Nevertheless, Bastian (2008) concludes from his Monte Carlo simulations that the observed relation between galaxy SFR and its brightest cluster accurately reflects the recent SFR. Thus, Bastian employs the vs. SFR relation from Weidner et al. (2004) and corrects for stellar evolution, but not for dynamical mass loss (expected to be small for massive clusters, since the tidal/dynamical mass-loss is inversely proportional to cluster mass; Baumgardt & Makino, 2003), the masses of the brightest GCs associated with a given epoch for a sample of major merger galaxies to derive their SFHs. Among the sample of their galaxies is NGC 3610 for which they used the magnitudes from Whitmore et al. (2002) and derived a peak SFR of 218 yr-1. Here, we follow the same approach to assess the SFH of the galaxies in our sample as follows.
Using the photometric masses of our clusters, we select the five most massive GC in red three age bins, as shown by vertical dashed lines and indicated with arrows in Figure 11. As several studies have shown that metal-poor GCs and metal-rich GCs trace different components of early-type galaxies, i.e., the halo and bulge/spheroidal components, respectively (e.g., Kissler-Patig et al., 1997; Kundu & Whitmore, 1998; Goudfrooij et al., 2007), we distinguish between the metal-poor and metal-rich GCs using as a dividing colour as before (cf. Section 5.3).
The mass of the most massive GCs in those age bins is then used to calculate the galaxy SFR using Eq. 7 of Weidner et al. (2004). To correct the mass of the GCs for mass-loss due to stellar evolution, we used predictions from the Bruzual & Charlot (2003) SSP models. We used the SSP at 10 Myr to estimate the clusters’ initial masses, as in Bastian (2008). In Figure 12
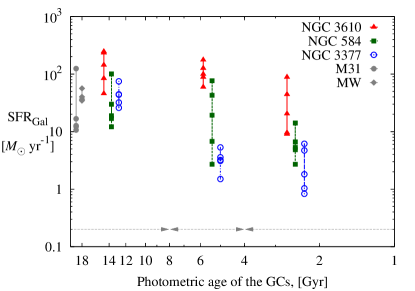
we show the derived galaxy SFRs from the five most massive GC in three age bins ( Gyr Gyr, and Gyr), where their age positions in the figure are centered around the midpoint of the respective age bin. The peak SFR we derive for NGC 3610 (234 yr) is consistent with the 218 yr derived by Bastian (2008), taking the difference in assumed distance moduli into account they adopt to NGC 3610 from Whitmore et al. (2002) ( mag), as well as the adopted by them solar metallicity for the most massive GC. For the three sample galaxies, Figure 12 shows that the peak star formation was reached at the epoch of formation of the oldest, metal-poor GCs. Since then, dissipative, gas-rich episodic (merger/accretion) events triggered the formation of the younger and more metal-rich stellar populations.
Similarly, we calculate the SFRs of the Milky Way and M 31 from their five most massive old ( Gyr) GCs (cf Figs. 5 and 11), which are representative for the SFRs at the time of assembly of their spheroid components (bulge and halo). We believe this yields a useful depiction of the uncertainties involved with the use of the most massive GC as a probe of the SFRs within these age bins. We do not expect observational bias effects in the SFR-values due to incompleteness (all measured ”brightest” GCs are above the 90% completeness level, see Fig. 11), however we can not exclude the possibility of missing a massive GC which might be located outside of the NIRI and HST WFPC2 or ACS fields (cf. Fig. 1). Effects on the SFRs due to statistical fluctuations in GC mass distribution (Maschberger & Kroupa, 2007; Kruijssen & Cooper, 2011) must be also kept in mind.
The result of our analysis supports the application of the most massive GCs being a good tracer of the galaxy SFH.
8 Conclusions
We use new Gemini/NIRI -band imaging in conjunction with existing optical HST/WFPC2 and ACS photometry of bright GCs in NGC 3610, NGC 584 and NGC 3377 three early-type galaxies that feature signs of recent galaxy interactions. The addition of the colour effectively breaks the age-metallicity degeneracy present in the colour. We interpolate between Bruzual & Charlot (2003) SSP model tracks to derive photometric ages, metallicities and masses for all GCs in the sample galaxies. For the massive GCs () in NGC 3610 with available spectroscopic Lick indices measurements from the literature (Strader et al., 2003; Strader et al., 2004), we find that the photometric ages are older by Gyr. This age difference is larger for the metal-poor GCs, while the photometric and spectroscopic metallicities are in excellent agreement (Sect. 5.1). We argue that this is most likely due to the presence of hot blue HB stars: A comparison with HB properties of Galactic GCs shows that all Galactic GCs with have blue HBs, except the metal-rich GC 47 Tuc. This suggests that all NGC 3610 GCs with spectroscopy found to be older than 8 Gyr are most likely to possess a blue HB as well as the majority of metal-poor GCs with (in any galaxy).
We show that the peak value of the age and metallicity distributions of the sample galaxies GCs is correlated with the luminosity-weighted mean age and metallicity of the host galaxy. The GCs’ age and distributions are broad (Sect. 5.3), indicating a prolonged star and cluster formation history. We reconstruct the galaxies’ SFHs from the GC age distributions, using the recently observed correlation between the luminosity of the most massive GC at a given age and the galaxy SFR (Sect. 7.2).
Our results support a scenario in which the star formation rate of the three candidate intermediate-age galaxies in our sample peaked at the epoch at which the oldest GCs (i.e., the metal-poor ones) formed. Subsequent dissipative events (i.e., interactions involving gas-rich galaxies) led to the formation of more metal-rich GCs up to a few Gyr ago. The SFHs of our sample galaxies as determined from their GCs suggests that the SFR was highest at the earliest times ( 10 Gyr ago in all three cases. The latter is in large part due to the presence of massive metal-poor GCs which are likely associated with the early build-up of the galaxy halos. The strengths of subsequent star formation events occurring over the last 10 Gyr varied significantly from one galaxy to another. Among the three galaxies in our sample, NGC 3610 showed the strongest SFR in all age bins, especially at the youngest age bin (4 Gyr ago). This is consistent with NGC 3610 being the most luminous galaxy in our sample as well as having the youngest spectroscopically determined age.
The ability to obtain such direct insights on the SFHs of galaxies renders the study of galactic GC systems in the optical vs. near-IR a promising tool to trace galaxy formation, merging and star formation history.
Acknowledgments
We would like to acknowledge the useful comments by the referee. IG would
like to thank Dr. A. Kundu for kindly providing their tables with the
HST/WFPC2 photometry of GCs in NGC 3377 and NGC 584.
IG is thankful for the received support by the German Research Foundation
(Deutsche Forschungsgemeinschaft, DFG) grant DFG - Projekt BO-779/32-1.
IYG and PG thank the Director of STScI for funding part of this research
through a director’s discretionary research grant. The authors would
like to acknowledge useful discussions with Prof. P. Kroupa.
This paper is based on observations obtained at the Gemini Observatory, which
is operated by the Association of Universities for Research in Astronomy,
Inc., under a cooperative agreement with the NSF on behalf of the Gemini
partnership: the National Science Foundation (United States), the Science and
Technology Facilities Council (United Kingdom), the National Research Council
(Canada), CONICYT (Chile), the Australian Research Council (Australia),
Ministério da Ciência e Tecnologia (Brazil) and Ministerio de Ciencia,
Tecnología e Innovación Productiva (Argentina).
We acknowledge the usage of the HyperLeda database http://leda.univ-lyon1.fr (Paturel
et al., 2003). This research has made use
of the NASA/IPAC Extragalactic Database (NED) which is operated by the Jet
Propulsion Laboratory, California Institute of Technology, under contract
with the National Aeronautics and Space Administration.
Facilities: Gemini (NIRI), HST (ACS, WFPC2).
References
- Alves-Brito et al. (2011) Alves-Brito A., Hau G. K. T., Forbes D. A., Spitler L. R., Strader J., Brodie J. P., Rhode K. L., 2011, MNRAS, pp 1306–+
- Anders & Fritze-v. Alvensleben (2003) Anders P., Fritze-v. Alvensleben U., 2003, A&A, 401, 1063
- Anders et al. (2009) Anders P., Lamers H. J. G. L. M., Baumgardt H., 2009, A&A, 502, 817
- Ashman & Zepf (1992) Ashman K. M., Zepf S. E., 1992, ApJ, 384, 50
- Barmby et al. (2001) Barmby P., Huchra J. P., Brodie J. P., 2001, AJ, 121, 1482
- Barmby et al. (2000) Barmby P., Huchra J. P., Brodie J. P., Forbes D. A., Schroder L. L., Grillmair C. J., 2000, AJ, 119, 727
- Barmby et al. (2007) Barmby P., McLaughlin D. E., Harris W. E., Harris G. L. H., Forbes D. A., 2007, AJ, 133, 2764
- Bastian (2008) Bastian N., 2008, MNRAS, 390, 759
- Baumgardt & Makino (2003) Baumgardt H., Makino J., 2003, MNRAS, 340, 227
- Beasley et al. (2005) Beasley M. A., Brodie J. P., Strader J., Forbes D. A., Proctor R. N., Barmby P., Huchra J. P., 2005, AJ, 129, 1412
- Billett et al. (2002) Billett O. H., Hunter D. A., Elmegreen B. G., 2002, AJ, 123, 1454
- Brocato et al. (2000) Brocato E., Castellani V., Poli F. M., Raimondo G., 2000, A&As, 146, 91
- Brodie et al. (2005) Brodie J. P., Strader J., Denicoló G., Beasley M. A., Cenarro A. J., Larsen S. S., Kuntschner H., Forbes D. A., 2005, AJ, 129, 2643
- Bruzual & Charlot (2003) Bruzual G., Charlot S., 2003, MNRAS, 344, 1000
- Caldwell et al. (2011) Caldwell N., Schiavon R., Morrison H., Rose J. A., Harding P., 2011, AJ, 141, 61
- Cantiello et al. (2007) Cantiello M., Blakeslee J., Raimondo G., Brocato E., Capaccioli M., 2007, ApJ, 668, 130
- Cantiello & Blakeslee (2007) Cantiello M., Blakeslee J. P., 2007, ApJ, 669, 982
- Carlsberg Meridian Catalogue (1989) Carlsberg Meridian Catalogue ed. 1989, Carlsberg Meridian Catalogue La Palma. Number 4: Observations of positions of stars and planets: May 1984 to February 1988 Servico Publicaciones Armarda, Copenhagen University Observatory, Royal Greenwich Observatory and Real Instituto y Observatorio de la Armarda en San Fernando
- Carretta et al. (2010) Carretta E., Bragaglia A., Gratton R. G., Recio-Blanco A., Lucatello S., D’Orazi V., Cassisi S., 2010, A&A, 516, A55+
- Cenarro et al. (2007) Cenarro A. J., Beasley M. A., Strader J., Brodie J. P., Forbes D. A., 2007, AJ, 134, 391
- Chabrier (2003) Chabrier G., 2003, PASP, 115, 763
- Chies-Santos et al. (2011) Chies-Santos A. L., Larsen S. S., Kuntschner H., Anders P., Wehner E. M., Strader J., Brodie J. P., Santos J. F. C., 2011, A&A, 525, A20+
- de Vaucouleurs et al. (1991) de Vaucouleurs G., de Vaucouleurs A., Corwin Jr. H. G., Buta R. J., Paturel G., Fouque P., 1991, Third Reference Catalogue of Bright Galaxies
- Dotter et al. (2011) Dotter A., Sarajedini A., Anderson J., 2011, ApJ, 738, 74
- Dotter et al. (2010) Dotter A., Sarajedini A., Anderson J., Aparicio A., Bedin L. R., Chaboyer B., Majewski S., Marín-Franch A., Milone A., Paust N., Piotto G., Reid I. N., Rosenberg A., Siegel M., 2010, ApJ, 708, 698
- Elmegreen & Efremov (1997) Elmegreen B. G., Efremov Y. N., 1997, ApJ, 480, 235
- Forbes et al. (2001) Forbes D. A., Georgakakis A. E., Brodie J. P., 2001, MNRAS, 325, 1431
- Georgiev et al. (2009) Georgiev I. Y., Hilker M., Puzia T. H., Goudfrooij P., Baumgardt H., 2009, MNRAS, 396, 1075
- Gieles (2009) Gieles M., 2009, Ap&SS, 324, 299
- Goudfrooij et al. (2001) Goudfrooij P., Alonso M. V., Maraston C., Minniti D., 2001, MNRAS, 328, 237
- Goudfrooij et al. (2001) Goudfrooij P., Mack J., Kissler-Patig M., Meylan G., Minniti D., 2001, MNRAS, 322, 643
- Goudfrooij et al. (2007) Goudfrooij P., Schweizer F., Gilmore D., Whitmore B. C., 2007, AJ, 133, 2737
- Harris (1996) Harris W. E., 1996, AJ, 112, 1487
- Harris et al. (2007) Harris W. E., Harris G. L. H., Layden A. C., Stetson P. B., 2007, AJ, 134, 43
- Hawarden et al. (2001) Hawarden T. G., Leggett S. K., Letawsky M. B., Ballantyne D. R., Casali M. M., 2001, MNRAS, 325, 563
- Hempel et al. (2007) Hempel M., Kissler-Patig M., Puzia T. H., Hilker M., 2007, A&A, 463, 493
- Hempel et al. (2007) Hempel M., Zepf S., Kundu A., Geisler D., Maccarone T. J., 2007, ApJ, 661, 768
- Hodapp et al. (2003) Hodapp K. W., Jensen J. B., Irwin E. M., Yamada H., Chung R., Fletcher K., Robertson L., Hora J. L., Simons D. A., Mays W., Nolan R., Bec M., Merrill M., Fowler A. M., 2003, PASP, 115, 1388
- Holtzman et al. (1992) Holtzman J. A., Faber S. M., Shaya E. J., Lauer T. R., Groth J., Hunter D. A., Baum W. A., Ewald S. P., Hester J. J., Light R. M., Lynds C. R., O’Neil Jr. E. J., Westphal J. A., 1992, AJ, 103, 691
- Howell (2005) Howell J. H., 2005, AJ, 130, 2065
- Kennicutt (1998) Kennicutt Jr. R. C., 1998, ApJ, 498, 541
- Kissler-Patig et al. (1998) Kissler-Patig M., Forbes D. A., Minniti D., 1998, MNRAS, 298, 1123
- Kissler-Patig et al. (1997) Kissler-Patig M., Kohle S., Hilker M., Richtler T., Infante L., Quintana H., 1997, A&A, 319, 470
- Koleva et al. (2008) Koleva M., Prugniel P., Ocvirk P., Le Borgne D., Soubiran C., 2008, MNRAS, 385, 1998
- Kroupa (2001) Kroupa P., 2001, MNRAS, 322, 231
- Kruijssen & Cooper (2011) Kruijssen J. M. D., Cooper A. P., 2011, ArXiv:1110.4106
- Kundu & Whitmore (1998) Kundu A., Whitmore B. C., 1998, AJ, 116, 2841
- Kundu & Whitmore (2001) Kundu A., Whitmore B. C., 2001, AJ, 121, 2950
- Kundu & Zepf (2007) Kundu A., Zepf S. E., 2007, ApJl, 660, L109
- Kundu et al. (2005) Kundu A., Zepf S. E., Hempel M., Morton D., Ashman K. M., Maccarone T. J., Kissler-Patig M., Puzia T. H., Vesperini E., 2005, ApJl, 634, L41
- Kuntschner et al. (2010) Kuntschner H., Emsellem E., Bacon R., Cappellari M., Davies R. L., de Zeeuw P. T., Falcón-Barroso J., Krajnović D., McDermid R. M., Peletier R. F., Sarzi M., Shapiro K. L., van den Bosch R. C. E., van de Ven G., 2010, MNRAS, 408, 97
- Kuntschner et al. (2002) Kuntschner H., Ziegler B. L., Sharples R. M., Worthey G., Fricke K. J., 2002, A&A, 395, 761
- Landolt (1992) Landolt A. U., 1992, AJ, 104, 340
- Larsen (2002) Larsen S. S., 2002, AJ, 124, 1393
- Larsen et al. (2003) Larsen S. S., Brodie J. P., Beasley M. A., Forbes D. A., Kissler-Patig M., Kuntschner H., Puzia T. H., 2003, ApJ, 585, 767
- Larsen et al. (2001) Larsen S. S., Brodie J. P., Huchra J. P., Forbes D. A., Grillmair C. J., 2001, AJ, 121, 2974
- Larsen & Richtler (2000) Larsen S. S., Richtler T., 2000, A&A, 354, 836
- Lasker et al. (1988) Lasker B. M., Sturch C. R., Lopez C., Mallamas A. D., McLaughlin S. F., Russell J. L., Wisniewski W. Z., Gillespie B. A., Jenkner H., Siciliano E. D., Kenny D., Baumert J. H., Goldberg A. M., Henry G. W., Kemper E., Siegel M. J., 1988, ApJs, 68, 1
- Lee et al. (2000) Lee H.-c., Yoon S.-J., Lee Y.-W., 2000, AJ, 120, 998
- Lee et al. (2007) Lee Y.-W., Gim H. B., Casetti-Dinescu D. I., 2007, ApJL, 661, L49
- Leggett (1992) Leggett S. K., 1992, ApJs, 82, 351
- Leggett et al. (2006) Leggett S. K., Currie M. J., Varricatt W. P., Hawarden T. G., Adamson A. J., Buckle J., Carroll T., Davies J. K., Davis C. J., Kerr T. H., Kuhn O. P., Seigar M. S., Wold T., 2006, MNRAS, 373, 781
- Li et al. (2007) Li Z., Han Z., Zhang F., 2007, A&A, 464, 853
- Maraston (2005) Maraston C., 2005, MNRAS, 362, 799
- Maschberger & Kroupa (2007) Maschberger T., Kroupa P., 2007, MNRAS, 379, 34
- Masters et al. (2010) Masters K. L., Jordán A., Côté P., Ferrarese L., Blakeslee J. P., Infante L., Peng E. W., Mei S., West M. J., 2010, ApJ, 715, 1419
- McCook & Sion (1987) McCook G. P., Sion E. M., 1987, ApJs, 65, 603
- McLaughlin & van der Marel (2005) McLaughlin D. E., van der Marel R. P., 2005, ApJS, 161, 304
- Michard (2005) Michard R., 2005, A&A, 441, 451
- Miller et al. (1997) Miller B. W., Whitmore B. C., Schweizer F., Fall S. M., 1997, AJ, 114, 2381
- Ocvirk (2010) Ocvirk P., 2010, ApJ, 709, 88
- Paturel et al. (2003) Paturel G., Petit C., Prugniel P., Theureau G., Rousseau J., Brouty M., Dubois P., Cambrésy L., 2003, A&A, 412, 45
- Peng et al. (2006) Peng E. W., Jordán A., Côté P., Blakeslee J. P., Ferrarese L., Mei S., West M. J., Merritt D., Milosavljević M., Tonry J. L., 2006, ApJ, 639, 95
- Percival & Salaris (2011) Percival S. M., Salaris M., 2011, MNRAS, 412, 2445
- Perina et al. (2011) Perina S., Galleti S., Fusi Pecci F., Bellazzini M., Federici L., Buzzoni A., 2011, ArXiv e-prints
- Puzia et al. (2005) Puzia T. H., Kissler-Patig M., Thomas D., Maraston C., Saglia R. P., Bender R., Goudfrooij P., Hempel M., 2005, A&A, 439, 997
- Puzia et al. (2002) Puzia T. H., Saglia R. P., Kissler-Patig M., Maraston C., Greggio L., Renzini A., Ortolani S., 2002, A&A, 395, 45
- Puzia et al. (2002) Puzia T. H., Zepf S. E., Kissler-Patig M., Hilker M., Minniti D., Goudfrooij P., 2002, A&A, 391, 453
- Raimondo et al. (2005) Raimondo G., Brocato E., Cantiello M., Capaccioli M., 2005, AJ, 130, 2625
- Recio-Blanco et al. (2006) Recio-Blanco A., Aparicio A., Piotto G., de Angeli F., Djorgovski S. G., 2006, A&A, 452, 875
- Sánchez-Blázquez et al. (2006) Sánchez-Blázquez P., Gorgas J., Cardiel N., González J. J., 2006, A&A, 457, 809
- Sandage & Katem (1982) Sandage A., Katem B., 1982, AJ, 87, 537
- Sandage & Tammann (1981) Sandage A., Tammann G. A., 1981, A revised Shapley-Ames Catalog of bright galaxies. Washington: Carnegie Institution, 1981
- Schiavon et al. (2004) Schiavon R. P., Rose J. A., Courteau S., MacArthur L. A., 2004, ApJL, 608, L33
- Schlegel et al. (1998) Schlegel D. J., Finkbeiner D. P., Davis M., 1998, ApJ, 500, 525
- Schweizer (1987) Schweizer F., 1987, Star formation in colliding and merging galaxies. Springer: New York, pp p.18–25
- Schweizer et al. (1996) Schweizer F., Miller B. W., Whitmore B. C., Fall S. M., 1996, AJ, 112, 1839
- Spitler et al. (2008) Spitler L. R., Forbes D. A., Beasley M. A., 2008, MNRAS, 389, 1150
- Strader et al. (2004) Strader J., Brodie J. P., Forbes D. A., 2004, AJ, 127, 295
- Strader et al. (2003) Strader J., Brodie J. P., Schweizer F., Larsen S. S., Seitzer P., 2003, AJ, 125, 626
- Thomas et al. (2003) Thomas D., Maraston C., Bender R., 2003, MNRAS, 339, 897
- Tokunaga et al. (2002) Tokunaga A. T., Simons D. A., Vacca W. D., 2002, PASP, 114, 180
- Tonry et al. (2001) Tonry J. L., Dressler A., Blakeslee J. P., Ajhar E. A., Fletcher A. B., Luppino G. A., Metzger M. R., Moore C. B., 2001, ApJ, 546, 681
- Trager et al. (2000) Trager S. C., Faber S. M., Worthey G., González J. J., 2000, AJ, 120, 165
- Vazdekis et al. (2010) Vazdekis A., Sánchez-Blázquez P., Falcón-Barroso J., Cenarro A. J., Beasley M. A., Cardiel N., Gorgas J., Peletier R. F., 2010, MNRAS, 404, 1639
- Weidner et al. (2004) Weidner C., Kroupa P., Larsen S. S., 2004, MNRAS, 350, 1503
- Whitmore et al. (2002) Whitmore B. C., Schweizer F., Kundu A., Miller B. W., 2002, AJ, 124, 147
- Whitmore et al. (1999) Whitmore B. C., Zhang Q., Leitherer C., Fall S. M., Schweizer F., Miller B. W., 1999, AJ, 118, 1551
- Woodley et al. (2010) Woodley K. A., Harris W. E., Puzia T. H., Gómez M., Harris G. L. H., Geisler D., 2010, ApJ, 708, 1335
- Worthey (1994) Worthey G., 1994, ApJs, 95, 107
- Worthey et al. (1994) Worthey G., Faber S. M., Gonzalez J. J., Burstein D., 1994, ApJS, 94, 687
- Xin et al. (2011) Xin Y., Deng L., de Grijs R., Kroupa P., 2011, MNRAS, 411, 761
- Yi (2003) Yi S. K., 2003, ApJ, 582, 202
- Yoon et al. (2006) Yoon S., Yi S. K., Lee Y., 2006, Science, 311, 1129