Cold gas accretion by high-velocity clouds
and their connection to QSO absorption-line systems
Abstract
We combine H i 21cm observations of the Milky Way, M31, and the local galaxy population with QSO absorption-line measurements to geometrically model the three-dimensional distribution of infalling neutral gas clouds (“high-velocity clouds”, HVCs) in the extended halos of low-redshift galaxies. We demonstrate that the observed distribution of HVCs around the Milky Way and M31 can be modeled by a radial exponential decline of the mean H i volume filling factor in their halos. Our model suggests a characteristic radial extent of HVCs of kpc, a total H i mass in HVCs of , and a neutral-gas-accretion rate of yr-1 for M31/Milky-Way-type galaxies. Using a Holmberg-like luminosity scaling of the halo size of galaxies we estimate kpc for the most massive galaxies. The total absorption-cross section of HVCs at most likely is dominated by galaxies with total H i masses between and . Our model indicates that the H i disks of galaxies and their surrounding HVC population can account for percent of intervening QSO absorption-line systems with log (H i at . We estimate that the neutral-gas accretion rate density of galaxies at low redshift from infalling HVCs is yr-1 Mpc-3, which is close to the measured star-formation rate density in the local Universe. HVCs thus may play an important role for the on-going formation and evolution of galaxies.
Subject headings:
ISM: clouds – quasars: absorption lines – Galaxy: halo1. Introduction
One crucial aspect of galaxy formation and evolution concerns the continuous infall of intergalactic gas onto galaxies. While it is clear that galaxies do accrete substantial amounts of gas from intergalactic space to power star formation, the exact way of how galaxies get their gas is still a matter of debate. In the conventional sketch of galaxy formation and evolution gas is falling into a dark matter (DM) halo and then is shock-heated to approximately the halo virial temperature (a few K, typically), residing in quasi-hydrostatic equilibrium with the DM potential well (Rees & Ostriker 1977). The gas then cools slowly through radiation, condenses and settles into the center of the potential where it forms stars as part of a galaxy (‘hot mode’ of gas accretion). It has been argued, however, that for smaller DM potential wells the infalling gas may radiate its acquired potential energy at much lower temperatures ( K, typically), so that one speaks of the ‘cold mode’ of gas accretion (e.g., White & Rees 1978). For the cold mode of gas accretion the star-formation rate of the central galaxy is directly coupled to its gas-accretion rate (White & Frenk 1991). Numerical simulations indicate that for individual galaxies the dominating gas-accretion mode depends on the mass and the redshift (e.g., Birnboim & Dekel 2003; Kere et al. 2005). The general trend for is that the hot mode of gas accretion dominates for massive galaxies with DM-halo masses , while the cold accretion mode dominates for galaxies with smaller DM-halo masses (e.g., van de Voort et al. 2011).
Independently of the theoretically expected gas-accretion mode of galaxies it is known since a long time that galaxies at low and high are surrounded by large amounts of neutral and ionized gas that partly originates in the IGM. This material is complemented by neutral and ionized gas that is expelled from the galaxies as part of galactic fountains, galactic winds, and from merger processes (see, e.g., Richter 2006 for a review). Because the interplay between these circumgalactic gas components is manifold and the gas physics of such a turbulent multi-phase medium is complex, the circulation of neutral and ionized gas in the inner and outer halos currently cannot be modeled in full detail in hydrodynamical simulations. To improve current models of galaxy-evolution models it is of imminent importance to quantify the amount of cool, neutral gas in and around galaxies from observations and search for observational strategies to separate metal-deficient infalling intergalactic gas from metal-enriched gaseous material that is circulating in the circumgalactic environment of galaxies as a result of fountain processes and galaxy mergers.
In the Milky Way and other, very nearby spiral galaxies (e.g., M31), the infall of neutral gas onto to the disks can be observed directly by H i 21cm observations of extraplanar gas clouds that move through the halos of these galaxies. For the Milky Way, the so-called “high-velocity clouds” (HVCs) represent the prime candidates for neutral gas that is being accreted onto the Milky Way disk. HVCs represent high-latitude gaseous structures (located in the Galactic halo) observed in H i 21cm emission at high radial velocities, km s-1 (e.g.; Wakker & van Woerden 1998; Richter 2006). Halo clouds with somewhat smaller radial velocities in the range km s-1 are commonly referred to as “intermediate-velocity clouds” (IVCs). Throughout this paper, we will use the expression “HVC” for all neutral halo clouds (including IVCs), if not otherwise stated. The total neutral gas mass of the Milky Way’s HVC population is on the order of and the total accretion rate of neutral gas in the form of HVCs has been estimated to be yr-1 (e.g., Wakker et al. 2007, 2008; Wakker 2004). Also M31 exhibits a population of neutral halo clouds in a similar mass range (for simplicity, hereafter also referred to as “HVCs”; Thilker et al. 2004). These observations, together with H i 21cm measurements of other nearby galaxies (e.g., Sancisi et al. 2007), imply that HVCs represent a common phenomenon in the local Universe.
Another important method to study the gaseous outskirts of galaxies and their relation to the cosmic web is the analysis of intervening absorption-line systems in optical und ultraviolet (UV) spectra of QSOs (AGN). QSO absorption spectroscopy allows us to detect both neutral and ionized gas in the intergalactic medium and the halos of galaxies over eight orders of magnitude in column density and over more than 90 percent of the age of the Universe. It is therefore a particularly sensitive method to explore the multi-phase nature of circumgalactic gas and its origin (e.g., Bergeron & Boissé 1992; Steidel 1995; Charlton & Churchill 1998; Ding et al. 2005; Richter et al. 2011).
In this paper, we combine H i 21cm observations of the HVC population of Milky Way and M31 with 21cm data of the local galaxy population and QSO absorption-line measurements to study the three-dimensional distribution of (partly) neutral gas structures in the extended halos of low-redshift galaxies. While several previous studies have linked the Galactic HVC population to intervening QSO absorbers based on various arguments (e.g., Blitz et al. 1999; Charlton, Churchill & Rigby 2000; Pisano et al. 2004; Mshar et al. 2007; Schaye, Carswell & Kim 2007; Narayanan et al. 2008; Richter et al. 2009; Stocke, Keeney & Danforth 2010; Ribaudo et al. 2011), a detailed geometrical HVC model that connects key observables (column densities, covering fractions, absorber number densities) of HVCs and intervening absorbers with the gas-accretion rates of galaxies at low redshift has not been presented so far. The main goal of the present study is to model the radial distribution of HVC analogs in halos as a function of galaxy mass and size, determine their absorption-cross section at , and estimate the neutral-gas accretion rate of galaxies at low redshift.
We refrain from including H i 21cm observations of HVCs from other galaxies beyond the Local Group in our study, because these observations are strongly limited in sensitivity for detecting diffuse neutral halo gas (e.g., Oosterloo et al. 2007). In addition, beam-smearing effects are known to smoothen out the true spatial distribution of individual halo clouds in more distant galaxies, so that the observed filling factor of H i 21cm in these systems does not provide a realistic estimate for the absorption-cross section of this gas.
| HVC name | ||
|---|---|---|
| [kpc] | ||
| Complex A | 0.01 | |
| Complex C | 0.04 | |
| Complex H | 0.01 | |
| Magellanic Stream | 0.04 | |
| Complexes WA, WB | 0.01 |
The paper is organized as follows: in we discuss H i 21cm observations of the HVC population of the Milky Way and M31. In we develop a simple model for the radial distribution of neutral gas in the halos of these galaxies. In we generalize our HVC model for the local galaxy population, based on information on the H i mass function of low-redshift galaxies and the absorption-cross section of Damped Lyman absorbers (DLAs) and Lyman limit systems (LLS) at . The relation between HVCs and intervening QSO absorbers is discussed in . In we present the conclusions from our study.
2. High-velocity clouds in the halos of the Milky Way and M31
2.1. HVCs in the Milky Way
The HVC population of the Milky Way has a total sky covering fraction of for column densities (H i cm-2 and for column densities (H i cm-2 (Wakker 2004 and references therein). The largest Milky HVC is Complex C, which covers square-degree on the sky (). With a low metallicity of solar (e.g., Fox et al. 2004; Richter et al. 2001) and a distance of kpc (Wakker et al. 2007; Thom et al. 2008), Complex C most likely is a cloud that is being accreted from the IGM or from a satellite galaxy. The Magellanic Stream (MS) also covers an area of square-degree, but most likely has a distance as large as kpc (Gardiner & Noguchi 1996). The MS represents a tidal feature expelled from the Magellanic Clouds as they move through the extended Milky Way halo. With its large distance and its stream-like shape the MS is clearly distinct from most of the other Galactic HVCs, which predominantly are less extended and located at distances kpc from the disk (Wakker et al. 1999, 2007, 2008; Thom et al. 2006, 2008).
Other prominent Galactic HVCs are Complex A, Complex H, the Anti-Center Cloud, and Complexes WAWE. Covering fractions and distances for some of these complexes (as far as known) are summarized in Table 1. Because accurate distance information on the Milky Way HVCs is still limited, the total H i mass in HVCs and the H i mass-accretion rate ist not well constrained. The currently available information implies and yr-1 (Wakker et al. 2007; 2008; Wakker 2004). The H i column densities in HVCs follow a column-density distribution function (CDDF) in the form with for log (H i (Lockman et al. 2002).
2.2. The M31 HVC population
As has been shown by Braun et al. (2009), M31 has an H i disk that extends to radii of kpc for column densities above log (H i. Beyond kpc the H i disk appears to be truncated (Braun et al. 2009; Braun & Thilker 2004). The HVC population of M31 was studied in detail with the Green Bank Telescope (GBT) by Thilker et al. (2004). These authors detected more than 20 individual HVCs around M31 with H i column densities cm-2 and estimated a total H i mass of the HVCs of (see also Thilker, Braun & Westmeier 2005).
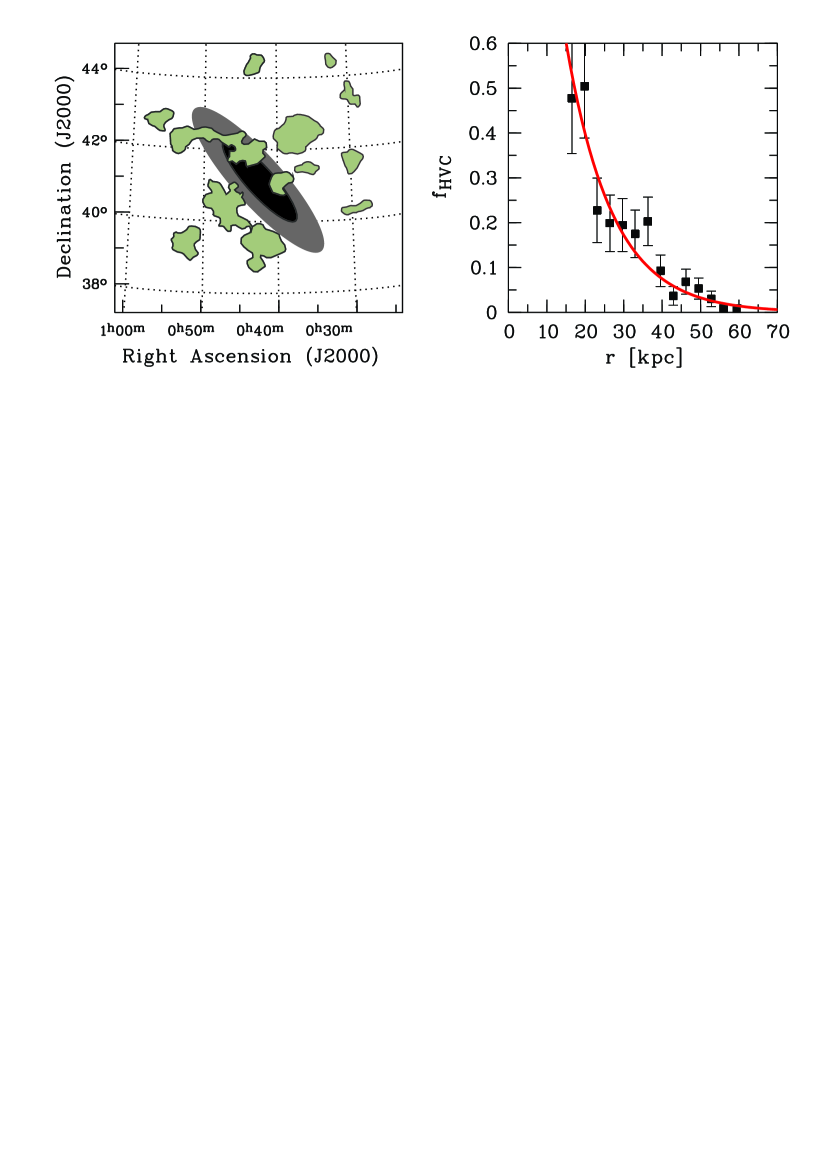
In the left panel of Fig. 1 we show the distribution of HVCs around the M31 disk, based on the GBT H i 21cm contour map presented by Thilker et al. (2004). The HVC population of M31 reaches out until kpc with a strongly decreasing HVC covering fraction towards larger radii. We assume kpc as distance for M31 (McConnachie et al. 2005), so that absolute distance estimates derived from angular coordinates are uncertain by percent. Some interesting conclusions about the radial distribution of neutral gas around M31 can be drawn from this HVC distribution map. Fig. 1, right panel, shows the radius-dependent projected covering fraction, , of the HVC population of M31 plotted against (indicated by the filled boxes), where is the projected radius. To calculate we have resampled the M31 HVC map of Thilker et al. (2004) and have transformed the () coordinate system into a polar coordinate system with coordinates and centered on M31. For each ring with radius and thickness the parameter then was derived by comparing the area covered by HVC gas with the total ring area. The error bars for shown in Fig. 1 have been calculated assuming Poisson-like statistics. Starting from at kpc the covering fraction decreases to values less than for radii larger than kpc. This trend for can be fitted by an exponential in the form exp with and , as shown by the solid red line in the right panel of Fig. 1. An exponential fit to the extraplanar H i features of M31 was also favored by Braun & Thilker (2004), who analyzed lower-resolution 21cm data of M31 from the Westerbork Synthesis Radio Telescope (WSRT).
For the inner regions of the M31 halo at kpc no HVC data are available. As discussed by Thilker et al. (2004), this does not imply that this region is devoid of HVC material. The lack of data for the disk-halo interface region at kpc (Fig. 1, left panel) rather indicates the incompleteness of the HVC map for small radii because of the confusion of neutral halo gas with the H i disk of M31 together with the stringent selection criteria defined by Thilker et al. to unambiguously identify HVC features. In the Milky Way, the disk-halo interface at kpc is filled with large amounts of neutral gas that gives rise to 21cm emission at intermediate and high velocities (e.g., Wakker 2004). Nearby edge-on galaxies such as NGC 891 also exhibit large amounts of neutral gas in the disk-halo interface region extending several kpc above and below the disk (see Sancisi et al. 2008). 21cm measurements of NGC 891 show that the (projected) covering fraction of neutral gas is for vertical distances kpc to the midplane of the NGC 891 disk (Oosterloo et al. 2007). If we extrapolate for M31 to small radii using the exponential defined above, becomes unity for kpc, in line with the extraplanar gas distribution observed in NGC 891. If we define as the radius beyond which the projected covering fraction of HVCs falls below 3 percent, we derive for M31 a value of kpc. The error reflects the uncertainties in the exponential parameters for .
| Parameter | Description | Value |
|---|---|---|
| Input | ||
| scale height of HVC population | kpc | |
| central HVC volume fraction | ||
| mean H i volume density | cm-3 | |
| upper -height limit for IVCs | kpc | |
| infall velocity | km s-1 for HVCs | |
| km s-1 for IVCs | ||
| Output | ||
| projected HVC covering fraction for radii kpc | exp | |
| projected HVC covering fraction for radii kpc | 1 | |
| mean IVC covering fraction from inside the sphere | ||
| mean HVC covering fraction from inside the sphere | ||
| mean HVC/IVC covering fraction from an outside vantage point | ||
| radius for which | 50 kpc | |
| (H i) | mean H i column density in HVCs/IVCs from inside the sphere | cm-2 |
| total neutral gas mass in HVCs/IVCs at | ||
| total neutral gas mass accretion rate for gas at | yr-1 | |
As shown by Braun & Thilker (2004), the high-resolution 21cm HVC data of M31 from Thilker et al. (2004) follows a “standard” H i CDDF in the form with in the column density range log (H i. The slope is very similar to the one derived for the Milky Way HVCs (Lockman et al. 2002; previous subsection) and is in good agreement with values derived for low-redshift QSO H i absorption-line systems (see Sect. 5.1).
3. Geometrical modeling of HVCs in the Local Group
3.1. Modeling setup
To combine the observational information on the HVC population of the Milky Way and M31 we have developed the custom-written numerical code halopath, which is based on a simple geometrical model assuming spherical symmetry. The code allows us to model the radial distribution of gas in the halos of galaxies, its mass distribution and its absorption-cross section from any given vantage point inside and outside the sphere. Because of the unknown size distribution of HVCs we here do no attempt to model individual H i clouds as HVC analogs, but instead consider the volume-filling factor of neutral gas as main input parameter, from which all relevant physical quantities (e.g., projected covering fraction, H i column density, H i mass) can be easily obtained and compared to observations.
To support the model with the necessary observational data, we assume that the HVC populations of the Milky Way and M31 are identical in a statistical sense (same radial distribution and same volume filling factor of gas with log (H i). In view of the similarity of both galaxies in terms of morphology, mass, luminosity, etc. this assumption is justified. As mentioned above, the key parameter that describes the spatial distribution of HVCs in our spherical model is the radius-dependent volume-filling factor of optically thick HVC gas with log (H i, , where is the physical radius (compared to the projected radius ). Because the projected (area) covering fraction of HVCs in the M31 halo can be described by an exponential (see above), we assume that follows an exponential, too, so that we write:
| (1) |
In this equation, is the volume-filling factor in the center of the sphere and is the scale height of the HVC population. Another important parameter in our model is the mean H i volume density in the HVC gas, as together with determines the neutral gas mass in HVCs per radial bin (= radial volume element), , with as hydrogen mass and as a factor that corrects for the presence of helium and heavy elements in the gas. In addition, determines the mean H i column density, (H i), measured along any given line of sight through the halo, since (H i, where is the absorption-path length through the halo. The parameters (H i) and are constrained by 21cm observations and ionization models of Galactic IVCs and HVCs. Note that in this study we do not model the gas physics in the halo clouds, but consider only the spatial distribution of neutral halo gas, its H i column density distribution, its total mass, and its infall rate.
To model the sky covering fraction of neutral gas from a vantage point inside the sphere (i.e., to model the projected neutral gas distribution in the Milky Way halo from the position of the sun) we introduce additional constraints based on results from 21cm observations of IVCs and HVCs. First, we only consider H i gas as neutral halo gas if it is located at vertical distances pc from the midplane of the disk (whose orientation can be chosen in the model). Second, we separate neutral halo gas close to the disk (small -heights) from more distant halo clouds via the parameter . This parameter enables us to distinguish between IVCs () and HVCs (). Finally, the parameter defines the infall velocity of the neutral halo gas; can be a function of or , or can be chosen to be constant for IVCs and HVCs, respectively. The neutral gas (mass) accretion rate per radial bin then is given by .
3.2. Modeling results
Using our geometrical model we are able reproduce the observed properties of the HVC population of the Milky Way and M31 using appropriate values for the above discussed input parameters. Our favorite model is summarized in Table 2. In this model, the scale-height of the HVC population is kpc and the central volume-filling factor of neutral halo gas is . The errors have been determined numerically; they reflect the 1 error range of the exponential parameters for in M31 (Sect. 2.2). In our model we assume that IVCs and HVCs are separated at a -height of kpc, in line with what is known about the distribution of IVC and HVC distances in the Milky Way halo (Wakker et al. 2007, 2008; Thom et al. 2006, 2008).
Only these three parameters (, , and ) are required to reproduce the observed exponential decline of the projected covering fraction of the HVC population of M31 ( exp for radii kpc) from a vantage point outside the sphere and the observed covering fractions of percent for IVCs and HVCs from a vantage point inside the sphere (see Sect. 2). Note that for kpc the projected covering fraction is set to unity. The characteristic radial extent of the HVC population around both galaxies is kpc. The mean projected covering fraction of neutral IVC/HVC gas in the halo region is .
Observations of H i, metal ions and molecular hydrogen suggest that the neutral hydrogen volume densities in IVCs and HVCs may span a large range over at least three orders of magnitude ( cm-3; e.g., Wakker et al. 1999, 2004; Richter et al. 2003a, 2003b, 2009; Sembach et al. 2001). For our model we adopt a value of cm-3, which is close to the one that has been derived for high-velocity cloud Complex C (Wakker et al. 1999). We consider this value as a realistic estimate for the volume-averaged mean neutral hydrogen density in IVCs and HVCs. As infall velocity we adopt km s-1 for HVCs and km s-1 for IVCs, assuming that the (vertical) infall velocities towards the disk are comparable to the observed radial velocities of IVCs and HVCs. Since the infall velocity of HVCs is determined by the balance between the gravitational force and the ram-pressure force provided by the surrounding hot coronal gas (e.g., Benjamin & Danly 1997; Brüns & Mebold 2004), a more precise modeling of would also require the modeling of the density distribution of hot halo gas, which is beyond the scope of this study. However, from grid-based hydrodynamical simulations of HVCs Heitsch & Putman (2009) derive infall velocities that are very similar to the velocities adopted by us.
With the above given values for and the mean H i column density in IVCs and HVCs (from the interior view) is (H i) cm-2, the total H i mass in the halo at is , and the total H i mass accretion rate for gas at is yr-1. These values are in excellent agreement with the observations (see ).
4. Modeling of galaxy absorbers
4.1. Galaxies and their absorption characteristics
In the previous section we have demonstrated that it is possible to reproduce the statistical properties of the HVC population of the Milky Way and M31 using a model that is based on very simple geometrical assumptions. In the following, we want to generalize our HVC model for the local galaxy population to constrain the absorption cross section of HVCs in the local Universe.
Galaxies and their circumgalactic gaseous environment can be traced by intervening absorption lines of H i and metal ions in the spectra of distant QSOs and AGN. The strongest intervening neutral-gas absorbers are the so-called Damped Lyman Absorbers (DLAs), which have H i column densities log (H i. These systems contain a substantial fraction of the neutral gas mass in the Universe (Wolfe et al. 1995). Although there still is no consistent picture about the host galaxies of DLAs, observations suggest that a mixed population of galaxies contribute to the absorption-cross section of DLAs at (e.g., Turnshek et al. 2001; Chen & Lanzetta 2003; Rao et al. 2003). From H i 21cm observations of the local galaxy population Zwaan et al. (2005) concludes, however, that the total DLA cross section at is dominated by the gaseous disks of and sub- galaxies with H i masses .
Based on H i 21cm observations of the Milky Way, M31, and other nearby galaxies it is expected that neutral gas absorbers in the extended halos of galaxies (i.e., HVC analogs) have H i column densities below that of DLAs (e.g., Wakker 2004; Thilker et al. 2004; Lockman et al. 2002; Murphy et al. 1995). Using the common absorber classification scheme, halo absorbers therefore are expected to be seen as so-called sub-DLAs ( log (H i) and Lyman-Limit Systems (LLS; log (H i). A large fraction of the LLS at low redshift therefore may represent distant analogs of the HVCs seen around the Milky Way and M31 (Richter et al. 2011).
As for HVCs, the H i column-density distribution function of intervening QSO absorbers at low and high redshift below the DLA column-density limit can be fitted by a power-law in the form . For QSO absorbers, has values between , depending on redshift and the column density interval chosen (see Lehner et al. 2007). Unfortunately, is poorly constrained for log (H i at due to the limited amount of low-redshift H i absorption-line data in the UV. In contrast, for high there exists a large data base that allows us to constrain at a relatively high accuracy (Ribaudo, Lehner & Howk 2011).
The incidence of intervening DLAs, sub-DLAs and LLS in QSO spectra, usually expressed by the quantity , the number of optically thick H i absorbers per unit redshift, can be obtained from the integration of the H i CDDF over the appropriate column-density range (in our case log (H i). Moreover, is proportional to the space density of galaxies, , and the mean geometrical cross section of optically thick H i, , in these galaxies :
| (2) |
We adopt , km s-1 Mpc-1, , and (Spergel et al. 2007). We assume that the covering fraction of optically thick H i gas is in the (inclined) disk of a galaxy and in the surrounding halo, where H i arises in the form of HVCs. Let be the geometrical cross section of the (inclined) disk and the cross section of the (spherical) halo region with radius . We then can introduce an effective HVC cross section for an individual galaxy, , so that the total area covered by optically thick H i in and around a galaxy is .
From H i 21cm measurements of the local galaxy population, Zwaan et al. (2005) have derived a DLA number density per unit redshift of , a result that is good agreement with previous estimates (e.g., Rosenberg & Schneider 2003; ). These measurements provide direct information on the individual geometrical cross section (i.e., ) of the gaseous disks at log (H i in low-redshift galaxies for a large range of galaxy morphologies and luminosities. These H i surveys are, however, not sensitive enough and do not provide sufficient spatial resolution to identify a possibly existing HVC population in the halos of these galaxies.
Based on the above-given relations, a QSO sightline passing through both an H i disk and HVC gas of a galaxy would show a DLA as absorption signature, while a sightline passing only through an optically thick HVC would exhibit a sub-DLA or LLS. We then can write for the total number density of H i absorbers with log (H i that trace gas disks of galaxies and their surrounding HVC population:
| (3) |
Our goal is to estimate from a generalized version of our HVC model for the local galaxy population (for which is known). This will enable us to estimate and link the HVC population at with the H i column-density distribution function of low-redshift QSO absorbers.
4.2. On the absorption cross section of neutral gas disks
| log | log | log | log | ||||
|---|---|---|---|---|---|---|---|
| in | [ in kpc | [kpc] | in kpc | in | yr | ||
| 0.03 | 2 | 0.35 | 0.41 | 3.38 | |||
| 0.33 | 3 | 0.23 | 0.88 | 4.21 | |||
| 0.63 | 4 | 0.21 | 0.97 | 4.82 | |||
| 0.93 | 7 | 0.15 | 1.51 | 5.46 | |||
| 1.23 | 9 | 0.17 | 1.73 | 5.91 | |||
| 1.53 | 13 | 0.18 | 2.05 | 6.39 | |||
| 1.83 | 19 | 0.18 | 2.40 | 6.85 | |||
| 2.13 | 27 | 0.19 | 2.70 | 7.29 | |||
| 2.43 | 39 | 0.19 | 3.00 | 7.73 | |||
| 2.73 | 55 | 0.20 | 3.30 | 8.15 | |||
| 3.03 | 78 | 0.20 | 3.61 | 8.56 | |||
| 3.33 | 110 | 0.22 | 3.91 | 8.95 |
Before we start to investigate the absorption cross-section of neutral gas in the halos of galaxies, it is useful to briefly discuss the relation between the absorption cross section, the total H i mass, and the scale-length of neutral gas disks in local galaxies, as derived from H i 21cm surveys. Using 21cm data from Arecibo and the Very Large Array (VLA) Rosenberg & Schneider (2003) have studied in detail these and other properties of 50 nearby galaxies in the context of the low-redshift DLA population. Rosenberg & Schneider find that the total (inclination-corrected) H i cross section of gas disks in their galaxy sample in the DLA column-density range (log ) is given by , where and are the major and minor axis parameters (in kpc) derived at the DLA column density limit (see also Rosenberg & Schneider 2003, their appendix.) They also find a remarkably tight correlation between and the total H i mass of the disk, (in solar mass units), as log log .
Since the mean value for in a sample of randomly inclined gas disks is expected to be , we can write for the mean disk area or log log. Combining this with the observed relation between and , we obtain a relation between the total H i mass and the disk radius at the DLA limit in the form log log . Finally, Rosenberg & Schneider (2003) find a (weak) correlation between the H i mass and the J-band luminosity in their sample, log log , where is in solar luminosity units.
4.3. On the absorption cross section of HVCs surrounding neutral gas disks
Surveys of the local galaxy population, such as the one presented by Rosenberg & Schneider (2003), show that galaxies span several orders of magnitude in parameters like H i mass, optical luminosity, and H i disk size. One crucial question that concerns the cross section of neutral gas in the halos of these galaxies is, how the size of the gaseous halo of a galaxy is related to the above listed parameters.
The standard approach to scale the size of a galaxy’s gaseous halo with its luminosity is to adopt a Holmberg-like luminosity scaling, so that the halo radius is given by
| (4) |
where and kpc for B-band luminosities, as derived from analyses of intervening Mg ii absorbers (which trace neutral and ionized gas in disks and halos) and their relation to galaxies (Steidel 1995; Kacprzak et al. 2008). It can be shown that with the above given relations between , , and a Holmberg-like luminosity scaling as given by equation (4) corresponds to a linear scaling of the halo radius with the H i disk radius. This is because (Rosenberg & Schneider 2003) and , which leads to , i.e., a Holmberg-like luminosity scaling with . For the following, we therefore assume a Holmberg-like luminosity scaling with , but we parametrize the halo size over the relation , where and is the H i disk radius for H i column densities above the DLA limit. For M31 (see Sect. 2.2).
To characterize the covering fraction of HVCs, , in galaxy halos, we assume that the exponential decline of observed in M31 reflects a general behavior of HVCs in galaxies in the local Universe. We then can express the projected covering fraction of HVCs around galaxies as a function of its H i disk length in the form
| (5) |
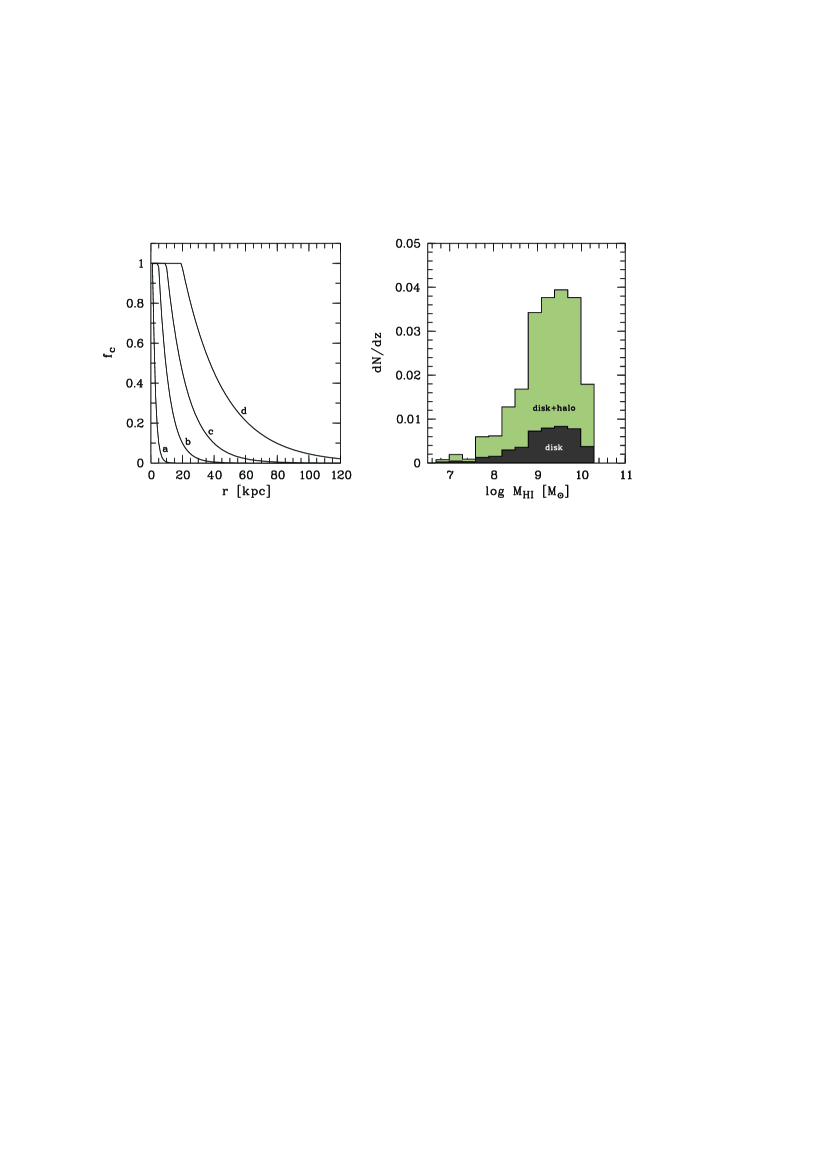
For M31, kpc (Braun et al. 2009; see above). In Fig. 2, left panel, we show for four different H i masses. In analogy to what has been discussed for the M31 HVC population, we define as the halo radius, beyond which falls below the 3-percent level and set . The scaling relation between the disk and halo radius in our model then comes out to for all halo radii considered (i.e., ).
Since log log (see above), equation (5) allows us to calculate the sizes of neutral gas halos of low-redshift galaxies as a function of their H i mass and luminosity. It also enables us to predict the cross section and number density of sub-DLAs and LLS that represent HVC analogs, their radial distribution, and estimate the neutral-gas accretion rate of galaxies in the local Universe.
4.4. Modeling results
As input for our generalized HVC model we adopt the H i mass distribution of low-redshift DLAs from Zwaan et al. (2005), as derived from a high-resolution 21cm survey of the local galaxy population. Using 21cm data from the WRST Zwaan et al. (2005) have studied the H i properties of 355 nearby galaxies and their contribution to the local DLA population. The expected values of for the different H i masses of the galaxies in their sample are shown as gray-shaded area in the right panel of Fig. 2. Obviously, galaxies with H i masses in the range log dominate the absorption cross section of DLAs at .
Based on these data, we derive for each galaxy H i mass bin the radius and area of the H i disk and the H i halo using the above discussed relations. Note that we here do not take into account the possibility that the neutral gas disks of galaxies significantly extend below the DLA column-density limit. Using our generalized HVC model we then calculate for each mass bin the radius-dependent (projected) HVC covering fraction (; equation 5), the effective HVC cross section (), and the expected number density of disk+halo H i absorbers (equation 3). Moreover, our model calculates for each galaxy H i mass bin the mean projected HVC covering fraction (), the total neutral gas mass in HVCs (), and the neutral gas mass accretion rate (). For the infall velocities we adopt the values for for IVCs and HVCs listed in Table 2. The expected number densities as a function of the galaxy H i mass are indicated with the green-shaded area in the right panel of Fig. 2. All results are summarized in Table 3. Based on these results we derive the following relation between the H i disk mass of galaxies, log (in solar units), and the radius of the neutral gas halo, (in [kpc]):
| (6) |
If we integrate the values of listed in Table 3 over the entire mass range, we derive a total number density of disk/halo absorbers of . This value is times larger than the number density of DLAs at (Zwaan et al. 2005), suggesting that the absorption-cross section of HVCs with log (H i exceeds that of DLAs by a factor of , on average. As for DLAs, the total absorption cross section of optically thick H i in disks and halos is dominated by galaxies in the mass range log . As our model indicates, the mean (projected) covering fraction of HVCs in galaxy halos is small, , typically.
4.5. Neutral gas accretion-rate density
Using the mass accretion rates () listed in Table 3 together with the H i mass function of the local galaxy population (Zwaan et al. 2005) we can estimate the neutral gas accretion-rate density of HVCs (mass accretion rate per unit volume) at low redshift. We obtain yr-1 Mpc-3. Note that this value is calculated under the assumption that all of the neutral gas in the halos of galaxies is being accreted onto their disks, independently of its origin inside or outside the host galaxies. The above estimate does not include the mass of the ionized gas component of HVCs, which may contribute substantially to the total mass of multi-phase halo clouds (e.g., Fox et al. 2010; Winkel et al. 2011). Also not included are partly neutral gas fragments with masses and angular sizes below the detection limit of 21cm HVC surveys. Such structures are known to exist in the Milky Way halo (Richter et al. 2009), but their (total) neutral gas mass most likely is small compared to the large, extended 21cm HVCs. The role of ionized gas is further discussed below.
The value of yr-1 Mpc-3 is remarkably close to the star-formation rate density at ( yr-1 Mpc-3, as derived from ultraviolet and infrared observational data (Hopkins & Beacom 2006). Therefore, cold-gas accretion by HVCs possibly plays an important (if not dominating) role in feeding galaxies at with gaseous material to power star formation.
The above given value for the accretion-rate density can also be compared with recent estimates of the “cold-mode” gas accretion-rate densities at from cosmological simulations. Using an SPH code, Kere et al. (2009) find yr-1 Mpc-3 for cold gas that never exceeded a maximum temperature of K. However, using SPH simulations with more realistic gas physics van de Voort et al. (2011) derive a much lower “cold-mode” gas accretion-rate density for galaxies at of yr-1 Mpc-3, while for the superordinate DM halos the cold-mode accretion-rate is estimated to be yr-1 Mpc-3, thus five-times higher. Therefore, only 20 percent of the cold gas that enters the DM halo in their simulation is actually being accreted as cold gas by the central galaxy. Unfortunately, these studies do not provide information on the absorption cross section of all the cold gas in the DM halos and its radial distribution around the galaxies (independently of whether it is being accreted or not), so that a detailed comparison between the simulation results and our HVC model is not possible at this point.
It needs to be mentioned that gas that is considered as “cold” in the cosmological simulations does not necessarily end up as H i high-velocity gas that is detectable via 21cm observations. It is expected that a substantial fraction of the accreted gas that never was heated up to the virial temperature of the host halo remains diffuse and “warm”, i.e., at low densities ( cm-3) and intermediate temperatures ( K). The neutral gas fraction in such warm gas is expected to be low, so that it remains unseen in H i 21cm emission (“warm“ mode of gas accretion; Heitsch & Putman 2009; Bland-Hawthorn 2008). The existence of such a warm, ionized gas component in the halos of galaxies is strongly supported by the detection of intermediate- and high-ion absorption (e.g., from Si iii, C iii, C iv, and Si iv) in the halo of the Milky Way (e.g., Fox et al. 2006; Sembach et al. 1995, 1999) and in the circumgalactic environments of other galaxies (e.g., Ribaudo et al. 2011). Also the ionized envelopes of 21cm HVC complexes represent significant gas reservoirs that need to be considered for a realistic estimate of the total (neutral and ionized) gas mass that is being accreted by galaxies (e.g., Winkel et al. 2011; Fox et al. 2010). The contribution of the ionized gas component to the total gas infall rate is difficult to determine, however, as the infall velocity of ionized gas may be substantially lower than for neutral gas because of hydrodynamical effects that affect the ionized cloud envelopes, such as gas stripping, turbulent mixing, and heat conduction. The same processes also affect the total cloud mass and the neutral gas fraction in HVCs and thus influence the H i volume filling factor in these clouds. These aspects clearly are best resolved through high-resolution hydrodynamical simulations (e.g., Heitsch & Putman 2009; Vieser & Hensler 2007).
5. HVCs and their relation to intervening QSO absorbers
5.1. HVCs and H i Ly absorbers
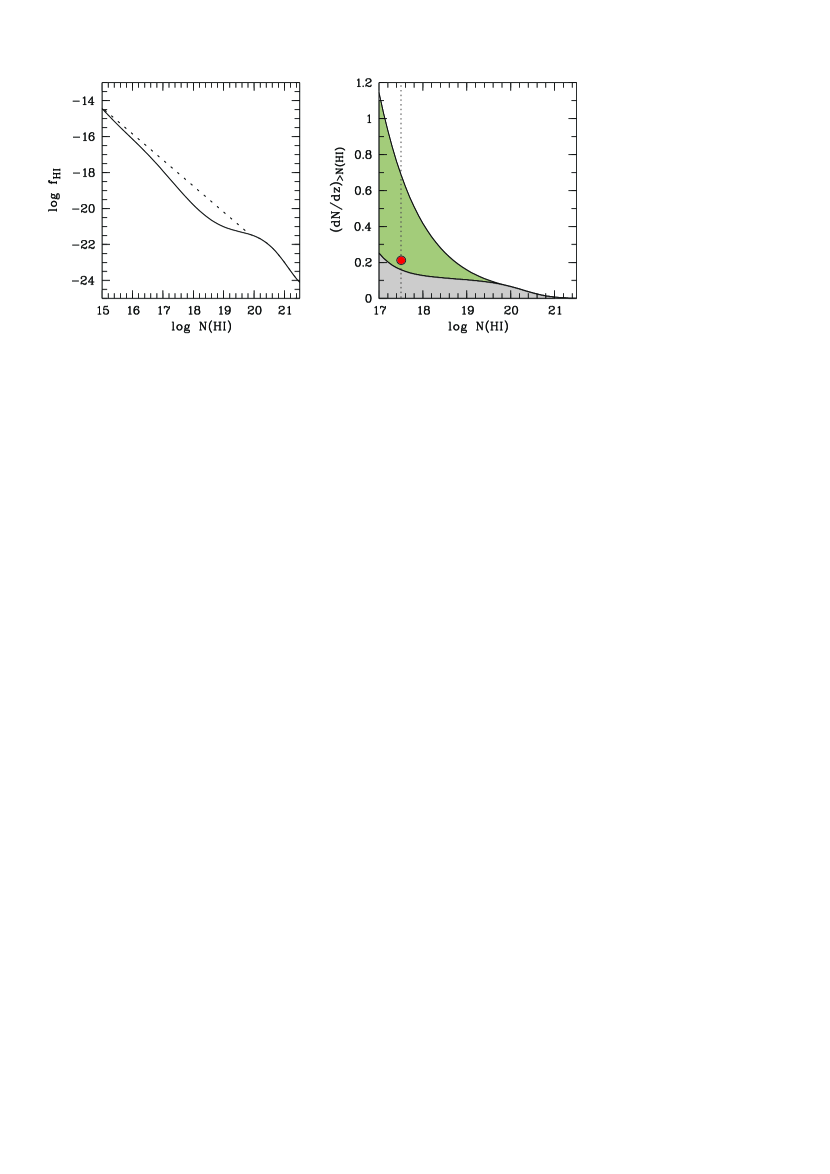
To estimate the contribution of H i HVCs to the number density of optically thick H i Ly absorbers at low , it is necessary to know the H i CDDF for log (H i at low redshift (equation 2). As mentioned above, the CDDF at is poorly constrained for this column density range owing to the fact that high-column density H i absorbers are rare and that the amount of the QSO absorption-line data in the ultraviolet is limited. Corbelli & Bandiera (2002) have combined absorption-line data for intermediate redshifts from Bandiera & Corbelli (2001), low-redshift absorption data from Weymann et al. (1998), and 21cm H i emission-line data from Ryan-Weber et al. (2003) to construct the H i CDDF in the range log (H i. The CDDF presented in Corbelli & Bandiera (2002) can be fitted by power laws in the ranges log (H i and log (H i, while at log (H i there seems to be a plateau in . Since this is exactly the column-density range of relevance for HVCs, these data imply that the total absorption-cross section of HVCs increases only mildly with a decreasing H i cutoff column density. To check the validity of this interesting feature in more absorption-line data for the range log (H i are required. To compare the frequency of sub-DLAs and LLS at low redshift with the HVC absorption cross section obtained from our model we have combined the absorption/emission-line data from Corbelli & Bandiera (2002) and Zwaan et al. (2005) and have constructed a “hybrid” H i CDDF at , in Fig. 3, left panel, shown as solid line.
Independent constraints for at low redshift come from the study by Lehner et al. (2007), how have analyzed low-redshift Ly absorbers based on high-resolution HST/STIS data. While their study is limited to the column density range log (H i, it is possible to extrapolate their CDDF from the three data points between log (H i (Lehner et al. 2007; their Fig. 14) to log (H i with a power law , where (Fig. 3, left panel, dashed line). This extrapolation nicely connects to the 21cm data from Zwaan et al. (2005), but lies substantially above the H i CDDF based on the Corbelli et al. results. For the following, we consider both representations of the H i CDDF shown in Fig. 3 as plausible input parameters to estimate the absorption cross section of H i in sub-DLAs and LLS at . In a recent study, Ribaudo, Lehner & Howk (2011) have compiled a large sample of LLS, most of them located at high redshifts (). Interestingly, their data points for fit well to the H i CDDF extrapolated from the Lehner et al. (2007) data.
Fig. 3, right panel, shows the (cumulative) number density of H i absorbers per unit redshift, , as a function of the cutoff H i column density, (H i), dervied from integrating the two representations of the H i CDDF over all column densities larger than (H i) (equation 2). This plot now can be directly compared to the results from our HVC model. The gray-shaded area indicates the allowed range ( percent contribution of HVCs to the H i absorber population) for the hybrid H i CDDF (Corbelli & Bandiera 2002; Zwaan et al. 2005; left panel, solid line), while the gray-shaded plus green-shaded area shows the allowed range based on the H i CDDF extrapolated from the Lehner et al. (2007) data (left panel, dashed line). The red filled circle indicates the value for derived from our HVC model. Thus, our HVC model predicts a value for from H i disk and halo absorbers that lies slightly above the value expected from the hybrid CDDF, but lies at a percent level of predicted by the CDDF extrapolated from the Lehner et al. (2007) data. We conclude that HVCs in our model contribute with percent to the population of H i Ly absorbers with log (H i at . Most likely, the contribution of HVCs is clearly less than percent, as extended neutral and partly-ionized gas disks with log (H i and galaxy outflows (as traced by strong Mg ii absorption; see next subsection) contribute to the population of Ly absorbers in the LLS and sub-DLA column density range.
A more detailed comparison between the absorption cross section of HVCs and the local H i Ly absorber population has to await a more precise determination of the H i CDDF at from HST/COS data.
5.2. HVCs and intervening Mg ii absorbers
The Mg ii resonant doublet near 2800 Å is commonly used to study neutral and ionized gas in the outskirts of galaxies at (e.g., Bergeron & Boissé 1991; Charlton & Churchill 1998; Ding et al. 2005). The so-called “strong” Mg ii systems represent intervening metal absorbers in QSO spectra that have rest-frame equivalent widths Å in the Mg ii line. They are commonly found within kpc of luminous galaxies and thus most likely are related to neutral and ionized gas in the disks and halos of low-redshift galaxies. The number density of strong intervening Mg ii systems in the local Universe is expected to be , as estimated from extrapolating the redshift evolution of strong Mg ii systems in the SDSS data from down to (Nestor, Turnshek & Rao 2005).
The value for is times higher than estimated from our HVC model, suggesting a substantially larger absorption cross section of strong Mg ii systems compared to HVC H i absorbers with log (H i. This is expected, because with an ionization potential of eV Mg ii traces both neutral and ionized gas in the disks and halos of galaxies. Kacprzak et al. (2008) estimated a Mg ii covering fraction of for galaxies and their gaseous halos from a sample of 37 Mg ii selected galaxies at intermediate redshift. This is roughly two times the mean value for in our HVC model.
In the Milky Way halo, the Mg ii absorption cross section in HVCs has not been determined yet, mostly because of the lack of appropriate high-resolution NUV data. The covering fractions of other low and intermediate ions with strong transitions in the FUV and with ionization potentials comparable to that of Mg ii (e.g., C ii, Si ii) are larger than the covering fraction of optically thick H i (Richter et al. 2009), but not large enough to explain the high value for in the local Universe. Recent studies suggest, indeed, that many strong Mg ii absorbers at low redshift arise in bipolar outflows and galactic winds (e.g., Bond et al. 2001; Bouché et al. 2011) and thus are related to halo environments with larger Mg ii covering fractions in galaxies that are more actively star-forming than the Milky Way and M31. From our estimate for we conclude that the contribution of infalling gas clouds (HVCs) to the absorption cross section of strong Mg ii absorbers most likely is small, but not negligible ( percent).
5.3. HVCs and intervening Ca ii absorbers
Next to the Mg ii doublet in the near-UV, the two Ca ii H&K lines in the optical near 4000 Å represent valuable tracers for neutral gas in the inner and outer regions of galaxies. For instance, Ca ii absorption is frequently observed in Galactic HVCs (e.g., Richter, Westmeier & Brüns 2005; Ben Bekhti et al. 2008) and is used as diagnostic line to derive distance brackets for IVCs and HVCs from optical data (e.g., Wakker et al. 2007, 2008; Thom et al. 2006, 2008). Based on archival high-resolution optical spectra of more than 300 QSOs, obtained with the VLT/UVES spectrograph Richter et al. (2011) have investigated intervening Ca ii absorbers at and their relation to disk and halo gas components. They derive a number density per unit redshift of for Ca ii systems with log (Ca ii, which is roughly 55 percent of the cross section of H i HVCs with log (H i estimated from our model.
In the Milky Way halo, the covering fraction of Ca ii for log (Ca ii is (Ben Bekhti et al. 2008), thus percent of that of 21cm HVCs with log (H i. As discussed in Richter et al. (2011), Ca ii absorbers with log (Ca ii predominantly trace neutral gas clouds with log (H i. This is due to the presence of dust in the gas (Ca is strongly depleted into dust grains) and the mostly sub-solar metallicities of the absorbers. From these numbers it follows that intervening Ca ii absorbers arise only in specific regions in HVCs, where the H i column density is large enough to compensate for the Ca dust-depletion and abundance effects.
6. Conclusions
Several previous studies have discussed a possible link between intervening metal-line and H i absorbers in QSO spectra and the HVC phenomenon in the Milky Way (e.g., Blitz et al. 1999; Charlton, Churchill & Rigby 2000; Mshar et al. 2007; Narayanan et al. 2008; Richter et al. 2009; Stocke, Keeney & Danforth 2010; Ribaudo et al. 2011). In this study, we move this idea forward by bringing together in a quantitative manner the properties of HVCs in the Milky Way and M31, QSO absorption-line statistics, and neutral gas-accretion rates of galaxies in the local Universe. We demonstrate that it is possible to explain the star-formation rate density in the local Universe through the infall of cold gas in the form of HVCs by using a simple geometrical model. In this model we project the observed statistical properties of the H i HVCs in the Local Group onto the local galaxy population, assuming a Holmberg-like luminosity scaling of the halo size. The main results from our modeling are summarized in Tables 2 and 3.
We emphasize at this point that we have not tuned any of the input parameters to fit the HVC cross section to the H i absorber population or any other above discussed QSO absorber observables. Our generalized HVC model is based solely on observed properties of the HVC population in the Local Group and the local galaxy population without any further assumptions. Note that the exact radial dependence of projected HVC covering fraction, (here assumed to be an exponential, based on the M31 data), is unimportant for the total absorption cross section of HVCs, as only the effective area (i.e., the product of total halo area and the mean HVC covering fraction) is relevant for in a sample of randomly distributed QSO sightlines. However, because the shape of reflects the volume-filling factor and thus the mass distribution of neutral gas around galaxies, is closely related to the H i accretion rate of galaxies . Thus, for a more precise estimate of the neutral-gas accretion rate of galaxies at it will be important to constrain the radial distribution of HVCs around other low-redshift galaxies beyond the Local Group using sensitive, high-resolution 21cm observations. Such observations need to be accompanied by a more precise estimate of the dynamics of neutral gas structures along their infall path through the hot coronal gas in the halos of galaxies of different masses, e.g., from hydrodynamical simulations (Kaufmann et al. 2009; Kere et al. 2010).
Since most of the gaseous material that is being accreted by galaxies at may be diffuse, ionized gas (“warm accretion”; Bland-Hawthorn 2008) rather than cold, neutral gas in the form of 21cm HVCs, it will be important for future studies to investigate the distribution and mass of ionized gas in galaxy halos. Diffuse ionized gas structures in the extended halos of galaxies are expected to have temperatures K, relatively low gas densities, and low neutral gas fractions (i.e., they remain unseen in 21cm HVC surveys). Such structures can be observed best in absorption in the FUV in the lines of low and intermediate ions such as C ii, C iii, Si ii, and Si iii (Fox et al. 2006; Ribaudo et al. 2011). Over the next few years large amounts of such spectral data hopefully will become available from the many ongoing observational campaigns with HST/COS. Results from these observations can be easily implemented in our halo model to predict the ionized-gas accretion rate for low-redshift galaxies.
In conclusion, the increasing amount of information on the distribution and physical properties of gas in the inner and outer halos of galaxies from observations, simulations, and semi-analytic models now can be used to substantially improve our understanding of gas-accretion processes of galaxies in the local Universe. Our study has shown one possible way of how to combine information from the local HVC population and QSO absorption-line systems at to investigate these processes for the local galaxy population. More detailed studies of this kind (e.g., including constraints for ionized halo gas) thus could be of great importance to constrain the role of gas-accretion processes for the ongoing formation and evolution of galaxies at low and to characterize their connection to the cosmic web.
REFERENCES
Bandiera, R. & Corbelli, E. 2001, ApJ, 552, 386
Ben Bekhti, N., Richter, P., Westmeier, T., & Murphy, M.T. 2008,
A&A, 487, 583
Benjamin, R.A. & Danly, L. 1996, ApJ, 481, 764
Bergeron, J. & Boissé, P. 1991, A&A, 243, 344
Birnboim, Y. & Dekel, A. 2003, MNRAS, 345, 349
Bland-Hawthorn, J. 2008, in IAU Symposium 254,
The Galaxy Disk in Cosmological Context,
astro-ph/08112467
Blitz, L., Spergel, D.N., Teuben, P.J., Hartmann, D.,
& Burton, W.B. 1999, ApJ, 514, 818
Bouché, N., Hohensee, W., Vargas, R., Kacprzak, G.G., Martin, C.L.,
Cooke, J., Churchill, C.W. 2011, astro-ph/11105877
Bond, N.A., Churchill, C.W., Charlton, J.C. & Vogt, S.S. 2001,
ApJ, 557, 761
Braun, R., Thilker, D.A., Walterbros, R.A.M., & Corbelli, E. 2009,
ApJ, 695, 937
Braun, R., & Thilker, D.A. 2004, A&A, 417, 421
Brüns, C. & Mebold, U. 2004, in ASSL, Vol. 312,
High-Velocity Clouds, ed. van Woerden et al.
(Kluwer Academic Publishers), 251
Charlton, J.J., Churchil. C.W., & Rigby, J.R. 2000, ApJ, 544, 702
Charlton, J.C. & Churchill C.W. 1998, ApJ, 499, 181
Chen, H.-W. & Lanzetta, K.M. 2003, ApJ, 597, 706
Corbelli, E. & Bandiera, R. 2002, ApJ, 567, 712
Ding, J., Charlton, J.C., Churchill C.W. 2005, ApJ, 621, 615
Fox, A.J., Wakker, B.P., Smoker, J.V., Richter, P., Savage, B.D.,
& Sembach, K.R. 2010, ApJ, 718, 1046
Fox, A.J., Savage, B.D., & Wakker, B.P. 2006, ApJS, 165, 229
Fox, A.J., Savage, B.D., Wakker, B.P., Richter, P., Sembach, K.R.,
& Tripp, T.M. 2004, ApJ, 602, 738
Gardiner, L.T. & Noguchi, M. 1996, MNRAS, 278, 191
Heitsch, F. & Putman, M.E. 2009, ApJ, 698, 1485
Hopkins, A.M. & Beacom, J.F. 2006, ApJ, 651, 142
Kacprzak, G.G., Churchill, C.W., Steidel, C.C., & Murphy, M.T. 2008,
AJ, 135, 922
Kaufmann, T., Bullock, J.S., Maller, A.H., Fang, T., & Wadsley, J. 2009,
MNRAS, 396, 191
Kere, D., Katz, N., Fardal, M., Davé, R., & Weinberg, D.H. 2009a,
MNRAS, 395, 160
Kere, D. & Hernquist, L. 2009b, ApJ, 700, L1
Kere, D., Katz, N., Weinberg, D.H., & Davé, R. 2005, MNRAS, 363, 2
Lehner, N., Savage, B.D., Richter, P., Sembach, K.R., Tripp, T.M.,
& Wakker, B.P. 2007, ApJ, 658, 680
Lockman, F.J., Murphy, E.M., Petty-Powell, S., & Urick, V.J. 2002, ApJS, 140, 331
McConnachie, A.W., Irwin, M.J., Ferguson, A.M.N., Ibata, R.A.,
Lewis, G.F., & Tanvir, N. 2005, MNRAS, 356, 979
Murphy, E.M., Lockman, F.J., & Savage, B.D. 1995, ApJ, 447, 642
Mshar, A.C., Charlton, J.C., Lynch, R.S., Churchill, C.W.,& Kim, T.-S. 2007,
ApJ, 669, 135
Narayanan, A., Charlton, J.C., Misawa, T., Green, R.E., & Kim, T.-S. 2008,
ApJ, 689, 782
Nestor, D.B., Turnshek, D.A., & Rao 2005, ApJ, 628, 637
Oosterloo, T., Fraternali, F., & Sancisi, R. 2007, ApJ, 134, 1019
Pisano, D.J., Barnes, D.G., Gibson, B.K., Staveley-Smith, L., Freeman, K.C.,
Kilborn, V.A. 2004, ApJ, 610, L17
Rao, S.M., Nestor, D.B., Turnshek, D.A., Lane, W.M.,
Monier, E.M., & Bergeron, J. 2003, ApJ, 595, 94
Rees, M.J., Ostriker, J.P., 1977, MNRAS, 179, 541
Ribaudo, J., Lehner, N., Howk, J.C., Werk, J., Tripp, T.M.,
Prochaska, J.X., Meiring, J.D. & Tumlinson J. 2011,
ApJ, 743, 207
Ribaudo, J., Lehner, N., & Howk, J.C. 2011, ApJ, 736, 42
Richter, P., Krause, F., Fechner, C., Charlton, J.C.,
& Murphy, M.T. 2011, A&A, 528, A12
Richter, P., Charlton, J.C., Fangano, A.P.M., Ben Bekhti, N.,
& Masiero, J.R. 2009, ApJ, 695, 1631
Richter, P. 2006, Reviews in Modern Astronomy, 19, 31
Richter, P., Westmeier, T., & Brüns 2005, A&A, 442, L49
Richter, P., Sembach, K.R. & Howk, J.C. 2003a, A&A, 405, 1013
Richter P., Wakker B.P., Savage B.D., & Sembach K.R 2003b, ApJ, 586, 230
Richter, P., Savage, B.D., Wakker, B.P., Sembach, K.R., Kalberla, P.M.W.
2001, ApJ, 549, 281
Rosenberg, J.L. & Schneider, S.E. 2003, ApJ, 585, 256
Ryan-Weber, E.V., Webster, R.L., & Stavely-Smith, L. 2003, MNRAS, 343, 1195
Sancisi, R., Fraternali, F., Oosterloo, T., & van der Hulst, T. 2008,
A&ARv, 15, 189
Schaye, J., Carswell, R.F., & Kim, T.-S. 2007, MNRAS, 379, 1169
Sembach, K.R., Howk, J.C., Savage, B.D., Shull, J.M. 2001,
AJ, 121, 992
Sembach, K.R., Savage, B.D., Lu, L., & Murphy, E.M. 1999, ApJ, 515, 108
Sembach, K.R., Savage, B.D., Lu, L., &
Murphy, E.M. 1995, ApJ, 451, 616
Spergel, D.N., Bean, R., Doreé, O., et al. 2007, ApJS, 170, 377
Steidel, C.C., Kollmeier, J.A., Shapley, A.E., Churchill, C.W., Dickinson, M.
& Pettini, M. 2002, ApJ, 570, 526
Stocke, J.T., Keeney, B.A., & Danforth, C.W. 2010, PASA, 27, 256
Thilker, D.A., Braun, R., Westmeier, T. 2005, in: Extra-planar gas,
ASP Conference Series, 331, 113
Thilker, D.A., Braun, R., Walterbos, R.A.M., et al. 2004, ApJ, 601, L39
Thom, C., Peek, J.E.G., Putman, M.E., Heiles, C., Peek, K.M.G.,
& Wilhelm, R. 2008, ApJ, 684, 364
Thom, C., Putman, M.E., Gibson, B.K., Christlieb, N., Flynn, C.,
Beers, T.C., Wilhelm, R., Lee, Y.S. 2006, ApJ, 638, L97
Turnshek, D.A., Rao, S., Nestor, D., Lane, W., Monier, E.,
Bergeron, J., & Smette, A. 2001, ApJ, 553, 288
van de Voort, F., Schaye, J., Booth, C.M., & Dalla Vecchia, C. 2011,
MNRAS, 414, 2458
Vieser, W. & Hensler, G. 2007, A&A, 475, 251
Wakker, B.P., York, D.G., Wilhelm, R., Barentine, J.C., Richter, P.,
Beers, T.C., Ivezi\a’c, Z., & Howk, J.C. 2008, ApJ, 672, 298
Wakker, B.P., York, D.G., Howk, J.C., et al. 2007, ApJ, 670, L113
Wakker, B.P. 2004, in ASSL, Vol. 312,
High-Velocity Clouds, ed. van Woerden et al.
(Kluwer Academic Publishers), 251
Wakker, B.P. 2001, ApJS, 136, 463
Wakker, B.P., Howk, J.C., Savage, B.D. 1999, Nature, 402, 388
Wakker, B.P. & van Woerden, H. 1998, ARA&A, 35, 217
Weymann, R.J., Jannuzi, B.T., Lu, L., et al. 1998, ApJ, 506, 1
White, S.D.M. & Frenk, C.S. 1991, ApJ, 379, 52
White, S.D.M. & Rees, M.J. 1978, MNRAS, 183, 341
Winkel, B., Ben Bekhti, N., Darmstädter, V., Flöer, L., Kerp, J.,
& Richter, P. 2011, A&A, 533, A105
Wolfe, A.M., Lanzetta, K.M., Foltz, C.B., & Chaffee, F.H. 1995,
ApJ, 454, 698
Zwaan, M.A., van der Hulst, J.M., Briggs, F.H., Verheijen, M.A.W., &
Ryan-Weber, E.V. 2005, MNRAS, 364, 1467