Dense gas and exciting sources of the molecular outflow in the AFGL 437 star-forming region
Abstract
We present Very Large Array (VLA) high resolution observations of the NH3(1,1) and NH3(2,2) molecular transitions towards the high mass star forming region AFGL 437. Our aim was to investigate if the poorly collimated CO molecular outflow previously detected in the region is the result of a projection effect, with no intrinsic bipolarity, as suggested by Gómez et al. We complemented our observations with radio continuum archived data from the VLA at 2 and 3.6 cm, and with unpublished public data at 450 m taken with Submillimetre Common-User Bolometer Array at the James Clerk Maxwell Telescope. Ammonia emission was found mainly in three clumps located at the south and east of the position of the compact infrared cluster of AFGL 437, where the CO outflow seemed to have its origin. One of the NH3(1,1) clumps coincides with the maximum of NH3(2,2) and with a local peak of emission at 450 m. A near infrared source (s11) is also found at that position. Our continuum map at 2 cm shows extended elongated emission associated with the infrared source AFGL 437W. This elongated morphology and its spectral index between 3.6 and 2 cm () suggest the presence of a jet in AFGL 437W. We suggest that several molecular bipolar outflows may exist in the region. The observed CO outflow would be the superposition of those individual outflows, which would explain its low degree of collimation observed at larger scales.
keywords:
ISM: jets and outflows - ISM: individual objects: AFGL 437 - stars: formation1 Introduction
Mass-loss phenomena are one of the best-known manifestations of the star formation process. In our current understanding of the formation of low-mass stars via accretion (e.g., McKee & Ostriker 2007), highly collimated jets are necessarily present in the first stages of protostellar evolution, coeval with the formation of circumstellar disks. Jets could be the agent releasing angular momentum excess, so that the protostar can continue accreting material from its environment.
Evidence for highly collimated mass-loss is widespread in low-mass young stellar objects (YSOs): e.g., jets traced by Herbig-Haro objects, radio continuum emission, or masers, as well as bipolar molecular outflows. However the case for high-mass stars ( M⊙) is less clear. Energetic mass loss is indeed present in those sources, although it is, in general, less collimated than in low-mass objects (Wu et al., 2004). Highly collimated jets seems to be restricted to the earliest phases of the evolution ( years; Shepherd 2005) of massive YSOs.
This is important from a more global perspective, since it is not yet clear whether high-mass stars form via accretion, like their low-mass counterparts (e.g., Yorke & Sonnhalter 2002; McKee & Tan 2003; Krumholz et al. 2009), or by coalescence of lower-mass objects (Bonnell, Bate & Zinnecker 1998). The presence of circumstellar disks and collimated outflows are key ingredients of the accretion scenario. The detection of disks (Patel et al., 2005) and jets (e.g., Martí, Rodríguez & Reipurth 1993; Rodríguez et al. 1994; Davis et al. 2004; Patel et al. 2005) in several high-mass objects clearly indicate that formation via accretion is possible in these objects, but we still do not know if this process is of general application.

Here we will study the AFGL 437 region, which hosts an interesting molecular outflow. The AFGL 437 region comprises a cluster of at least YSOs (Weintraub & Kastner, 1996; Kumar Dewangan & Anandarao, 2010), although infrared images are dominated by a compact () central cluster of four sources (named AFGL 437N, S, E, and W by Wynn-Williams et al. 1981), which seem to have recently emerged from the near side of the molecular cloud. AFGL 437 shows clear signs of ongoing star formation, such as the presence of radio continuum emission (probably tracing ultracompact HII regions associated with sources W and S, Wynn-Williams et al. 1981; Torrelles et al. 1992; Kurtz, Churchwell & Wood 1994), water masers (close to sources N and W, Torrelles et al. 1992), and a molecular outflow traced by CO (Gómez et al., 1992). At least sources W and S are thought to be massive stars, of early B type (Wynn-Williams et al., 1981; Torrelles et al., 1992).
The molecular outflow, observed with single dish at angular resolution (Gómez et al., 1992), is roughly oriented in the north-south direction, but it shows a very low degree of collimation, with high-velocity CO emission completely surrounding the central cluster. Interestingly, all observed CO isotopes show the same distribution of blue- and red-shifted gas. Given the location of the YSOs close to the edge of the parental cloud, Gómez et al. (1992) suggested a possible interpretation for the nature of the molecular outflow, alternative to more classical models: if the winds from the YSOs, that can be isotropic at the origin, shock obliquely against the walls of the cavity opened in the cloud, they can produce a laminar flow of molecular gas along these walls. When this flow is observed under a particular angle of view, it may give the appearance of a bipolar molecular outflow. The observed bipolarity would then be a projection effect, not an intrinsic characteristic of the mass-loss itself. An alternative explanation for the morphology of the molecular outflow would be the superposition of several outflows excited by different sources in the cluster.
The IR observations showed two different sources towards AFGL 437N (Rayner & McLean, 1987; Weintraub & Kastner, 1996), one of which (WK 34) is associated with a bipolar polarized nebula (Weintraub & Kastner 1996; Meakin, Hines & Thompson 2005) oriented N-S (i.e., roughly in the same direction as the CO outflow) with a centrosymmetric polarisation pattern. This led Weintraub & Kastner (1996) to suggest that WK 34 is the main driving source of the molecular outflow. However, the nature of this source is still uncertain: while Meakin et al. (2005) argued that it is a low-mass YSO, recent SED modelling including Spitzer data (Kumar Dewangan & Anandarao, 2010) suggest that it could be massive, but of young age, with effective temperature still not sufficient to create an HII region. On the other hand, high-resolution infrared observations show elongated (monopolar) emission associated with source AFGL 437S (Alvarez et al., 2004). This suggests that more than one source in the region could be undergoing mass loss.
In this paper we present high resolution ammonia observations of the AFGL 437 region, designed to test whether the bipolarity of the outflow is as a projection effect (as suggested by Gómez et al. 1992) or if, alternatively, the observed outflow is the superposition of individual outflows from different sources. In the case of a projection effect, we should expect the ammonia to show a spatio-velocity pattern similar to that of CO isotopes, with blueshifted gas to the south and redshifted one to the north. On the other hand, if this is a more classical example of molecular outflow, we expect ammonia emission to peak near the exciting source of the outflow, and possibly tracing a disk/toroid elongated in the E-W direction, i.e., perpendicular to the collimation axis (e.g., Estalella et al. 1993; Wiseman et al. 2001).
We complement the ammonia observations with archival data of continuum emission at centimetre and submillimetre wavelengths to further study the nature of the sources in this region.
| Clump | R.A.1 | Dec 1 | 2 | 3 | 4 | 5 | 6 | 7 | 8 |
|---|---|---|---|---|---|---|---|---|---|
| (J2000) | (J2000) | ||||||||
| C1 | 03 07 27.9 | 58 30 34 | |||||||
| C2 | 03 07 25.7 | 58 30 42 | |||||||
| C3 | 03 07 21.4 | 58 30 06 |
1. Coordinates of the positions of the local peak in the integrated intensity map of NH3(1,1) (see Fig. 1). Units of right ascension are hours, minutes, and seconds; units of declination are degrees, arcminutes, and arcseconds.
2. Intensity of the main hyperfine component of the NH3(1,1) line, at that position.
3. Intensity of the inner satellite component of NH3(1,1).
4. LSR velocity of the NH3(1,1) line.
5. Full width at half maximum (FWHM) of the main hyperfine component of the NH3(1,1) line. It was derived from a simple Gaussian fit, without considering the magnetic hyperfine structure within the lines.
6. Intensity of the main hyperfine component of the NH3(2,2) line.
7. LSR velocity of the NH3(2,2) line.
8. FWHM of the main hyperfine component of the NH3(2,2) line.
2 Observations
We observed the (1,1) and (2,2) inversion transitions of the NH3 molecule (rest frequencies 23694.496 and 23722.634 MHz, respectively) towards the AFGL 437 region, using the Very Large Array (VLA) of the National Radio Astronomy Observatory111The National Radio Astronomy Observatory is a facility of the National Science Foundation operated under cooperative agreement by Associated Universities, Inc. in its D configuration on 2004 August 16 (project AG665). The phase centre was located at R.A.(J2000) = , Dec(J2000) = . We observed both lines simultaneously in dual circular polarisation, using the 4IF mode of the VLA. This allowed us to sample each line with 63 spectral channels of 48.8 kHz (0.62 km s-1) width, centred at = km s-1. The flux calibrator was J0137+331, with an assumed flux density of 1.05 Jy using the latest VLA values (1999.2). The phase and bandpass calibrator was J0359+509, with bootstrapped flux density of 9.5 Jy. We calibrated and imaged the data using the standard procedures of the Astronomical Image Processing System (AIPS) of the National Radio Astronomy Observatory (NRAO). Continuum emission was subtracted using task UVLIN. Mapping and deconvolution was carried out with task IMAGR, using a natural weighting of the visibilities. To improve the signal-to-noise ratio for extended emission we convolved the resulting images with a Gaussian beam, to obtain a final synthesised beam size of .
We have also reprocessed archival radio continuum data of this region at 2 and 3.6 cm. These observations correspond to VLA projects AC240 (1989 March 19, B configuration), AT121 (1991 May 25, D configuration), and AT122 (1991 January 30, CnD configuration), and were published in Torrelles et al. (1992; projects AT121 and AT122) and Kurtz et al. (1994; project AC240). The description of those observations can be found in these papers. Further self-calibration was possible for the data observed in 1991. We combined together the visibility data at each wavelength before imaging. With this combination we can properly sample the emission at both, larger (as traced by the Torrelles et al. data), and smaller scale (given by the higher-resolution Kurtz et al. data). Imaging of the combined data was carried out with a robust weighting of the visibilities, with robust parameters 0 and 5 for the data at 3.6 and 2 cm, respectively. With these parameters, the final data have a similar size of their synthesised beams ( at 3.6 cm, and at 2 cm).

We have also retrieved publicly available submillimetre data at 450 and 850 m, taken with SCUBA at the James Clerk Maxwell Telescope (JCMT)222The James Clerk Maxwell Telescope is operated by the Joint Astronomy Centre on behalf of the Science and Technology Facilities Council of the United Kingdom, the Netherlands Organisation for Scientific Research, and the National Research Council of Canada. on 2003 November 6, corresponding to project M03BU13. The data at 850 m have been presented in Curran & Chrysostomou (2007) and Matthews et al. (2009), but in this paper we are using for our analysis the original data ( angular resolution), without applying any spatial convolution (final angular resolution of in Matthews et al. 2009). The data at 450 m are presented here for first time. The angular resolution of the JCMT at 450 m is .

3 Results
3.1 Ammonia observations
Fig. 1 shows the integrated intensity maps of the main hyperfine component of NH3(1,1) and (2,2) lines. No significant emission is present at the central cluster of stars. Two clumps are clearly present in both maps, to the east and south of the centre (labelled as C1 and C3 in the figures). Their morphology appears elongated, specially in the (1,1) map. The spectra toward the peaks of those clumps are shown in Fig. 2. The main and inner satellite components of the electric quadrupole hyperfine structure of the (1,1) transition are evident. A weaker clump (labelled C2) is also visible in the (1,1) map, west from C1. In tables 1 and 2 we list the observed and the derived physical parameters, respectively, of those three clumps. Line intensities, central positions and widths in Table 1 were obtained with Gaussian fits to the emission. Physical parameters in Table 2 were obtained following the formulation of Ho & Townes (1983), and Mangum et al. (1992).
Clump C1 (the most intense one in NH3) appears to have the highest column density. Moreover, its lines are wider than the rest. There is an infrared source, detected in Spitzer IRAC bands (s11, Kumar Dewangan & Anandarao 2010), close to its maximum, at the exact position of the NH3(2,2) peak. These characteristics may imply that C1 harbours a protostar inside. No infrared source appears clearly associated to the peak of clumps C2 and C3.
Channel maps are shown in Fig. 3 for the (1,1) and (2,2) lines. We do not see any obvious velocity pattern within the region, although there is a hint of redshifted emission to the north (see panel at km s-1). This would suggest a trend (redshifted to the north, and blueshifted to the south) similar to that found in the CO outflow (Gómez et al., 1992), although the low signal to noise ratio of the emission, apart from clumps C1 and C2 precludes any firm conclusion based on the velocity pattern.
| Clump | 1 | 2 | 3 | size 4 | 5 |
|---|---|---|---|---|---|
| (K) | ( cm-2) | (arcsec) | (M⊙) | ||
| C1 | 0.6 | 18 | 5 | ||
| C2 | 1.4 | 20 | 0.7 | ||
| C3 | 0.8 | 19 | 4 |
1. Optical depth of the main hyperfine component of the
NH3(1,1) line.
2. Rotational temperature.
3. Column density of hydrogen, assuming local thermodynamic equilibrium, with kinetic and excitation temperature of NH3 lines equal to , and an abundance of
NH3 relative to hydrogen of .
4. FWHM size of the clump.
5. Estimated mass of the clump.
We note that single-dish observations (obtained with the Effelsberg antenna, angular resolution 40”; Wu et al. 2006) show ammonia emission associated with the central cluster, specially in the (2,2) transition. Since we do not detect this in our observations, it is possible that the emission detected by Wu et al. (2006) is extended and relatively uniform, so that either it is below the sensitivity limit when observed at resolution, or a fraction of it is missed because of the lack of short interferometer spacings. To estimate the amount of emission that our interferometric observations are missing, we have convolved our integrated intensity maps with an elliptical Gaussian, to obtain a final angular resolution of , corresponding to that of Effelsberg at the ammonia frequency. We then compared the integrated intensities tabulated by Wu et al. (2006) with the values in our convolved map. At the position given by Wu et al. (2006), the VLA is recovering % and % of the NH3(1,1) and (2,2) emission, respectively. Therefore, we are missing a significant fraction of the NH3 emission, which would complicate any conclusion based on large-scale structures. However, at smaller scales, we are confident that the individual ammonia clumps seen in Fig. 1 are real structures, given their good correspondence with submillimeter emission (see next section). To get a complete picture of the overall distribution of ammonia map, we should combine both interferometric and single-dish data. Unfortunately, the available single-dish data are not enough to properly carry out such a combination, since the Wu et al. (2006) maps are not fully sampled (their observed points have full-beam separation).
3.2 Submillimeter continuum emission
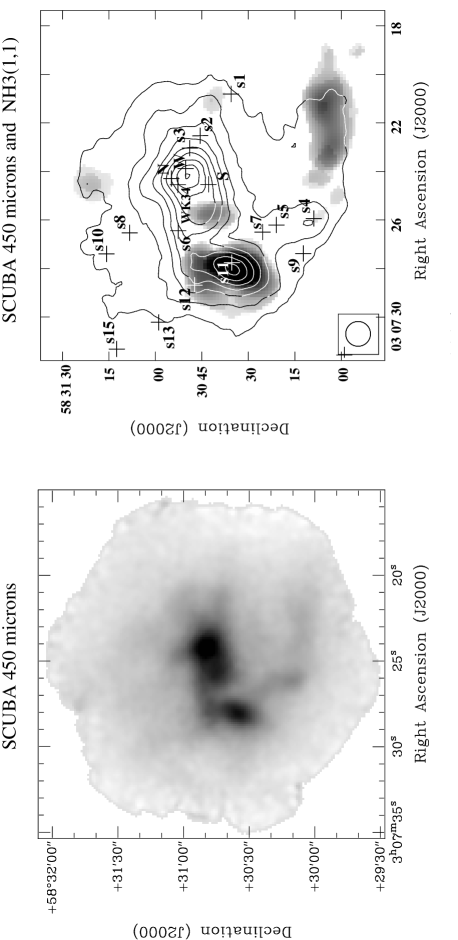
The SCUBA maps at 850 m presented in Curran & Chrysostomou (2007) and Matthews et al. (2009) showed extended, elongated emission oriented in the northwest-southeast direction. However, in the maps at 450 m, (Fig. 4), we can clearly distinguish two local maxima. One of them is located at the position of the central cluster, and the other one coincides with C1 (with its maximum located at R.A.(J2000) , Dec(J2000) ). We also note that the central submillimeter emission extends to the east, toward C2. There is also a weaker finger of emission elongated toward the south that peaks at the position of the IR source s4 (see Fig. 4), and extended, very faint emission coincident with C3. Apart from the central peak, the submillimeter emission tends to follow the distribution of NH3. This gives us confidence that the ammonia clumps seen in Fig. 1 are real entities, and not artifacts generated by the lack of short spacings in the interferometer.
From the map at 450 m, we can estimate the mass of the observed submillimeter clumps, using the formula , where is the flux density, is the distance to the source (2 kpc), is the mass absorption coefficient, and is the Planck function for the dust temperature, . The value of is highly uncertain, and is very sensitive to the particular dust properties of the object. We have adopted the prescription suggested by Hildebrand (1983), cm2 g-1, which assumes a gas to dust ratio of 100. To estimate the dust emissivity index () we convolved the 450 m map with an elliptical gaussian, to match the angular resolution of the one at 850 m. After this convolution, the ratio between those maps is , which yields , a value within the range found in other high-mass stars (Molinari et al., 2000). With these parameters, flux densities of 6.9 and 5.6 Jy represent masses of 44 and 39 M⊙ for the central submillimeter peak and the one associated with the ammonia clump C1, respectively. In the latter case, the mass obtained from the submillimeter data is larger than the one from ammonia (5 M⊙), but consistent with our estimate that the ammonia data may be recovering only % of the total flux.
3.3 Centimeter continuum emission
Maps of the continuum at 3.6 and 2 cm are shown in Fig. 5. As reported previously (Wynn-Williams et al., 1981; Torrelles et al., 1992; Kurtz et al., 1994), there are two main radio continuum sources, as seen in Fig. 5, associated with sources AFGL 437W and S. Parameters of the continuum sources are shown in Table 3. However, our map at 2 cm shows extended, elongated emission in AFGL 437W, in the NE-SW direction (P.A. ). This elongated emission was not clearly seen in the individual datasets that we combined together to obtain this map. It is possible that the elongated structure only shows up with good enough coverage of the uv-plane, which would also explain why it is not seen in the 3.6 cm data. If this interpretation is correct, further observations at 3.6 cm with a better uv-coverage could detect the elongated structure.
| Source | 1 | 2 | 3 |
|---|---|---|---|
| (mJy) | (mJy) | ||
| W | |||
| S |
1. Flux density at 3.6 cm.
2. Flux density at 2 cm.
3. Spectral index between 3.6 and 2 cm, defined as .

The elongated radio continuum emission suggests the presence of a jet, and it is reminiscent of other jets traced by radio continuum in high-mass star-forming regions, like Cepheus A or W75N (Torrelles et al. 1996, 1997). The derived spectral index of this source () is similar to that expected from constant-velocity winds (). Following the formulation by Reynolds (1986), the spectral index would indicate the presence of a confined jet (i.e, narrower than a purely biconical shape). This formulation assumes a power-law dependence of width () with distance from the center (), of the form . In our case, the derived index is .
The mass loss rate of the ionized jet can be estimated from eq. 19 of Reynolds (1986). We assumed a wind velocity of 500 km s-1, a turnover frequency for the radio continuum emission of 10 GHz, a temperature of the ionized gas of K, a jet opening angle of , and an inclination angle with respect to the line of sight of . We have chosen a turnover frequency between the two observed ones, since the derived spectral index (0.4) is partially optically thick. However, the value of the mass loss rate depends only weakly on the turnover frequency (to the power of ), and the possible error introduced by this value is small. Under these assumptions, we obtain a mass-loss rate of M⊙ yr-1. The assumed velocity of 500 km s-1 would imply a momentum rate of M⊙ km s-1 yr-1 for this jet, which could be enough to drive the large scale CO outflow in the region, given that the derived momentum rate of jet and outflow are of the same order (Gómez et al. 1992).
We also note that mid-infrared images of this source (de Wit et al., 2009) show extended emission slightly elongated along the same direction.
In the 2 cm map, there seems to be also some radio continuum emission northeast of AFGL 437S, and an extension to the southeast of AFGL 437W. We have searched in data archive for possible infrared counterparts of those emissions, but none was found. At this point, we cannot ascertain whether these represent two real sources, or they are instrumental artifacts. If they are indeed real sources, the lack infrared counterpart for the weak 2 cm continuum emission may suggest the presence of young, deeply embedded sources. Some weak continuum emission may also be associated with AFGL 437N.
4 Discussion
Gómez et al. (1992) suggested an interpretation for the molecular outflow in terms of motions of gas along the wall of a cavity opened in the molecular cloud by the massive stars in the cluster. With this anisotropic distribution of molecular gas, even if the stellar winds are isotropic, the outflow could appear as bipolar, and of low collimation, to the observer.
Our NH3 observations were specifically designed to test whether this “alternative” interpretation for the outflow is valid, or this is a more “classical” bipolar outflow, where there is intrinsic collimation in the mass-loss process, probably driven by source WK 34. There are several key characteristics to be investigated with these observations, such as the velocity pattern, the morphology, and the location of NH3.
4.1 The velocity pattern of NH3
If the interpretation given by Gómez et al. (1992) for the outflow, as motions along the walls of a cavity is correct, this drag of material should be seen in all molecular tracers. In particular, the spatial distribution of blue- and redshifted velocities of the dense gas traced by NH3 should be similar to the one seen in CO.
Our results (Fig. 3) are not conclusive to reject the Gómez et al.’s hypothesis. There is some hint of more redshifted gas to the north, and more blueshifted one to the south, but the low signal-to-noise ratio of the emission, specially that to the north does not allow firm conclusions. On the other hand, the most intense ammonia emission (C1) seems to be related to a particular infrared source (s11), which also emits in the submillimeter. The ammonia seems to trace individual clumps, well defined in velocity, rather than a continuous distribution with a velocity gradient, which one could expect from the model proposed by Gómez et al. (1992).
4.2 The morphology and location of NH3
Classical examples of bipolar outflows show interstellar toroids of dense gas, perpendicular to molecular outflows and/or jets (e.g., Torrelles et al. 1983; Wiseman et al. 2001). In the past, these interstellar toroids have been proposed as the collimating agents of these outflows, although the actual collimators seem to be much smaller circumstellar disks. However, given the usual relationship outflow-interstellar toroid, the presence of a dense structure (traced with NH3) perpendicular to the outflow, and located close to is center, would have favored a more “classical” interpretation of the outflow. Moreover, ammonia emission has been used as a tool to identify the excitation source of bipolar outflows. Excitation source of outflows usually coincides with the maximum emission of ammonia (Anglada et al., 1989). This is usually confirmed with the presence of local enhancements of temperature (with a higher ratio of the emission of ammonia (2,2) to (1,1) transitions), and turbulence (wider ammonia lines).
The overall distribution of NH3 does not show any preferential orientation with respect to the molecular outflow. Only clump 3 shows an E-W orientation, roughly perpendicular to the outflow. However, it is located to the south, on the blueshifted lobe of the CO emission, rather than towards the central cluster, and no infrared source is located near its maximum.
Using the maximum of ammonia (clump C1) as a criterium to search for the powering source of the outflow, source s11 would be a good candidate. Its spectral energy distribution (Kumar Dewangan & Anandarao, 2010) and its distinctive nature as a submillimeter source shows that s11 is a YSO. Nevertheless, source s11 is clearly offset from the center of the outflow, and it is hard to imagine that it could be its main driving source. However, we note that both, the redshifted and blueshifted CO lobes show extensions to the east (Gómez et al., 1992). We suggest that these extensions could in fact be part of an independent outflow driven by source s11, while the bulk of the CO outflow would be driven by the sources in the central cluster.
4.3 Sources of mass loss in the region
There are several sources in AFGL 437 that could be undergoing mass-loss simultaneously. Source WK 34 is associated with an infrared polarized nebula (Weintraub & Kastner, 1996; Meakin et al., 2005), and has been suggested to be the dominant exciting source of the outflow. The infrared nebula and its association with a water maser (Torrelles et al., 1992; Weintraub & Kastner, 1996) clearly indicate that this source is an active source of mass-loss. Source AFGL 437S also shows elongated infrared emission (Alvarez et al., 2004), which is also suggestive of a star undergoing mass-loss, although this extension is weak, and close to the resolution limit of the maps.
Our radio continuum map at 2 cm (Fig. 5) shows, for the first time, the presence of a collimated jet associated to source AFGL 437W. The previous detection of both radio continuum and water maser emission (Torrelles et al. 1992) already signaled this source as a young object, but now we see that its mass loss is highly collimated.
Therefore we have strong evidence that at least WK 34 and AFGL 437W (and possibly AFGL 437S) are undergoing collimated mass loss. This seems not to support the model of Gómez et al. (1992), which suggested that the mass loss could be isotropic (and the observed CO bipolarity would be a projection effect). We now favor that the observed CO outflow is the superposition of several bipolar outflows, which would explain its low degree of collimation. Sources WK 34, AFGL 437W (and possibly AFGL 437S) could be responsible for the bulk of high-velocity CO emission close to the center. We also propose that source s11 is a young embedded object that could drive an additional outflow, traced by the eastern extensions of the CO lobes. Weintraub & Kastner (1996) and Kumar Dewangan & Anandarao (2010) noticed that the infrared emission near WK 34 is oriented in the N-S direction next to the source, but it bends to the northeast away from it. Kumar Dewangan & Anandarao (2010) suggested that this bending may be due to the interaction of the outflow from WK 34 with mass loss from source AFGL 437N, but we suggest that it could reflect the interactions between the outflows from WK 34 and AFGL 437W.
This superposition of several individual outflows, giving rise to complex morphologies when observing at low angular resolution, is also found in other high-mass star forming regions (e.g., Beuther et al. 2002, 2006; Ginsburg et al. 2009).
An alternative scenario would be that only one source is significantly driving the (low-collimation) outflow, even when present evidence is of highly collimated jets, if both a collimated jet and a low-collimation wind are driven simultaneously by the same source. Evidence for simultaneous presence of high- and low-collimation mass loss has been found for the first time in a high-mass young star in water maser observations of Cepheus A (Torrelles et al., 2011).
To test these scenarios, we propose that the molecular outflow should be observed with millimeter/submillimeter interferometers, at scales of a few arcseconds, to be able to discriminate the possible individual outflows driven by these sources. Being able to trace the molecular outflow close to its driving source(s) would provide direct evidence of whether there is a superposition of outflows or if one source is responsible for it.
5 Conclusions
We presented new interferometric NH3(1,1) and (2,2) observations of the region of high-mass star formation AFGL 437, with the aim to understand the nature of the low-collimation bipolar molecular outflow previously detected in CO (Gómez et al. 1992). These observations were complemented with archive data of radio continuum emission at 2 cm, 3.6 cm, and 450 m. Our main conclusions are as follow:
-
1.
The ammonia emission in our interferometric maps is located mainly in three clumps at the south and east of the central cluster.
-
2.
The analysis of the velocity pattern of the ammonia transitions in the whole region is not conclusive and, in principle, it does not allow us to accept or reject the model proposed by Gómez et al. (1992).
-
3.
One of the clumps seen in NH3(1,1) coincides with the maximum of NH3(2,2) emission, and with a local maximum of emission at 450 m. A near infrared source (s11) is also found at that position. We identify this source as possible active young stellar object, and it might be a source of mass-loss in the AFGL 437 region.
-
4.
The radiocontinuum map at 2 cm shows extended, elongated emission in the source AFGL 437W, not detected in previous studies. This elongated morphology and its spectral index () suggest the presence of a jet in that source.
-
5.
The collimated mass loss observed in sources WK 34 and AFGL 437W sources does not support the model proposed by Gómez et al. (1992), which suggested an isotropic mass loss in the region.
-
6.
We suggest that several bipolar outflows may exist in the AFGL 437 region. The CO outflow would be the superposition of them, what would explain its low degree of collimation. An alternative scenario is that the CO outflow could be produced by a main source driving both less and highly collimated winds. Observations with millimeter/submillimeter interferometers to scales of several arc seconds may identify the individual outflows.
Acknowledgments
GM, JFG and IdG acknowledge partial support from Ministerio de Ciencia e Innovación (Spain), grant AYA2008-06189-C03-01. JFG is also supported by Junta de Andalucía (TIC-126). This research used the facilities of the Canadian Astronomy Data Centre operated by the the National Research Council of Canada with the support of the Canadian Space Agency.
References
- Alvarez et al. (2004) Alvarez C., Hoare M., Glindemann A., Richichi A., 2004, A&A, 427, 505
- Anglada et al. (1989) Anglada G., Rodríguez L. F., Torrelles J. M., Estalella R., Ho P. T. P., Cantó J., Lopez R., Verdes-Montenegro L., 1989, ApJ, 341, 208
- Beuther et al. (2002) Beuther, H., Schilke, P., Gueth, F., McCaughrean, M., Andersen, M., Sridharan, T. K., & Menten, K. M. 2002, A&A, 387, 931
- Beuther et al. (2006) Beuther, H., Zhang, Q., Sridharan, T. K., Lee, C.-F., & Zapata, L. A. 2006, A&A, 454, 221
- Bonnell et al. (1998) Bonnell I. A., Bate M. R., Zinnecker H., 1998, MNRAS, 298, 93
- Curran & Chrysostomou (2007) Curran R. L., Chrysostomou A., 2007, MNRAS, 382, 699
- Davis et al. (2004) Davis C. J., Varricatt W. P., Todd S. P., Ramsay Howat S. K., 2004, A&A, 425, 981
- de Wit et al. (2009) de Wit W. J. et al., 2009, A&A, 494, 157
- Estalella et al. (1993) Estalella R., Mauersberger R., Torrelles J. M., Anglada G., Gómez J. F., Lopez R., Muders D., 1993, ApJ, 419, 698
- Ginsburg et al. (2009) Ginsburg, A. G., Bally, J., Yan, C.-H., & Williams, J. P. 2009, ApJ, 707, 310
- Gómez et al. (1992) Gómez J.F., Torrelles J. M., Estalella R., Anglada G., Verdes-Montenegro L., Ho P. T. P., 1992, ApJ, 397, 492
- Hildebrand (1983) Hildebrand R. H., 1983, QJRAS, 24, 267
- Ho & Townes (1983) Ho P. T. P., Townes C. H., 1983, ARA&A, 21, 239
- Kumar Dewangan & Anandarao (2010) Kumar Dewangan L., Anandarao B. G., 2010, MNRAS, 402, 2583
- Kurtz et al. (1994) Kurtz S., Churchwell E., Wood D. O. S., 1994, ApJS, 91, 659
- Krumholz et al. (2009) Krumholz M. R., Klein R. I., McKee C. F., Offner S. S. R., Cunningham A. J., 2009, Science, 323, 754
- Mangum et al. (1992) Mangum J. G., Wootten A., Mundy L. G., 1992, ApJ, 388, 467
- Marti et al. (1993) Marti J., Rodríguez L. F., Reipurth B., 1993, ApJ, 416, 208
- Matthews et al. (2009) Matthews B. C., McPhee C. A., Fissel L. M., Curran R. L., 2009, ApJS, 182, 143
- McKee & Ostriker (2007) McKee C. F., Ostriker E. C., 2007, ARA&A, 45, 565
- McKee & Tan (2003) McKee C. F., Tan J. C., 2003, ApJ, 585, 850
- Meakin et al. (2005) Meakin C. A., Hines D. C., Thompson R. I., 2005, ApJ, 634, 1146
- Molinari et al. (2000) Molinari S., Brand J., Cesaroni R., Palla F., 2000, A&A, 355, 617
- Patel et al. (2005) Patel N. A. et al., 2005, Nature, 437, 109
- Rayner & McLean (1987) Rayner J., McLean I., 1987, in Wynn-Williams C. G. and Becklin E.E., eds, Proceedings of the Workshop on Ground-based Astronomical Observations with Infrared Array Detectors, University of Hawaii, Honolulu p. 272
- Reynolds (1986) Reynolds S. P., 1986, ApJ, 304, 713
- Rodríguez et al. (1994) Rodríguez L. F., Garay G., Curiel S., Ramirez S., Torrelles J. M., Gómez Y., Velazquez A., 1994, ApJ, 430, L65
- Shepherd (2005) Shepherd D., 2005, in Cesaroni R., Felli M., Churchwell E., Walmsley M., eds, Proc. IAU Symp. 227, Massive Star Birth: A Crossroads of Astrophysics, Cambridge University Press, Cambridge, p. 237
- Torrelles et al. (2011) Torrelles J. M. et al., 2011, MNRAS, 410, 627
- Torrelles et al. (1992) Torrelles J. M., Gómez J. F., Anglada G., Estalella R., Mauersberger R., Eiroa C., 1992, ApJ, 392, 616
- Torrelles et al. (1996) Torrelles J. M., Gómez J. F., Rodríguez L. F., Curiel S., Ho P. T. P., Garay G., 1996, ApJ, 457, L107
- Torrelles et al. (1997) Torrelles J. M., Gómez J. F., Rodríguez L. F., Ho P. T. P., Curiel S., Vazquez R., 1997, ApJ, 489, 744
- Torrelles et al. (1983) Torrelles J. M., Rodríguez L. F., Cantó J., Carral P., Marcaide J., Moran J. M., Ho P. T. P., 1983, ApJ, 274, 214
- Weintraub & Kastner (1996) Weintraub D. A., Kastner J. H., 1996, ApJ, 458, 670
- Wiseman et al. (2001) Wiseman J., Wootten A., Zinnecker H., McCaughrean M., 2001, ApJ, 550, L87
- Wu et al. (2004) Wu Y., Wei Y., Zhao M., Shi Y., Yu W., Qin S., Huang M., 2004, A&A, 426, 503
- Wu et al. (2006) Wu Y., Zhang Q., Yu W., Miller M., Mao R., Sun K., Wang Y., 2006, A&A, 450, 607
- Wynn-Williams et al. (1981) Wynn-Williams C. G., Becklin E. E., Beichman C. A., Capps R., Shakeshaft J. R., 1981, ApJ, 246, 801
- Yorke & Sonnhalter (2002) Yorke H. W., Sonnhalter, C., 2002, ApJ, 569, 846