: a molecular cloud progenitor of an Arches-like cluster
Abstract
Young massive clusters (YMCs) with stellar masses of M⊙ and core stellar densities of stars per cubic pc are thought to be the ‘missing link’ between open clusters and extreme extragalactic super star clusters and globular clusters. As such, studying the initial conditions of YMCs offers an opportunity to test cluster formation models across the full cluster mass range. is an excellent candidate YMC progenitor. We make use of existing multi-wavelength data including recently available far-IR continuum (Herschel/Hi-GAL) and mm spectral line (HOPS and MALT90) data and present new, deep, multiple-filter, near-IR (VLT/NACO) observations to study . These data show is a high mass (M⊙), low temperature (T20 K), high volume and column density (n cm-3; N cm-2) molecular clump which is close to virial equilibrium (M) so is likely to be gravitationally-bound. It is almost devoid of star formation and, thus, has exactly the properties expected for the initial conditions of a clump that may form an Arches-like massive cluster. We compare the properties of to typical Galactic cluster-forming molecular clumps and find it is extreme, and possibly unique in the Galaxy. This uniqueness makes detailed studies of extremely important for testing massive cluster formation models.
Subject headings:
ISM: clouds — ISM: molecules — stars: formation — galaxies: star clusters1. INTRODUCTION
One of the ground breaking discoveries of the Hubble Space Telescope was that massive stellar clusters, with properties that rival (or even exceed) those found in globular clusters in terms of mass and stellar density, are still forming in the universe today (Holtzman et al., 1992). These young massive clusters (YMCs) can be broadly defined as stellar clusters more massive than 104 M⊙ and with ages that are 100 Myr but that also exceed the current crossing time by a factor of a few, so are gravitationally-bound (see e.g. Ashman & Zepf, 2001; Portegies Zwart et al., 2010) . The discovery of YMCs in the Galaxy has allowed a detailed study of their structural and stellar properties (e.g. Arches, Quintuplet, Westerlund 1 and 2, RSCG1, 2 and 3, GLIMPSE-CO1, NGC 3603: Figer et al., 1999; Clark et al., 2005; Ascenso et al., 2007; Figer et al., 2006; Davies et al., 2011; Beccari et al., 2010). Like their extragalactic counterparts, these Galactic YMCs have stellar masses of M⊙ and core stellar densities of stars per cubic pc. The stellar masses and densities are orders of magnitude larger than typical open clusters and comparable to those in globular clusters, super star clusters seen in merging/starburst galaxies and those inferred from observations of massive clusters forming at the epoch of peak star formation density () (Whitmore, 2000; Johnson & Kobulnicky, 2003; Swinbank et al., 2010; Danielson et al., 2011). As such, YMCs are potentially local-universe-analogs of these massive extragalactic and high- stellar clusters. Within our own Galaxy, observations show a smooth continuum in the properties of young clusters, suggesting that YMCs merely represent the extreme end of the open cluster (OC) distribution function. Thus, understanding how YMCs form may provide a direct handle on i) globular and super star cluster formation, ii) cluster formation at the epoch of peak star formation density (), iii) the most extreme conditions for star formation in the local universe, and iv) whether or not there are different formation modes across the cluster mass range.
Despite their importance, the formation process of YMCs is not well constrained observationally due to the lack of known potential gas clouds as progenitors. As a result it has not been possible to study the initial conditions of the molecular gas from which YMCs form (see e.g. Santangelo et al., 2009). Progress requires first finding and then deriving the properties of the most massive molecular gas clouds which are on the verge of forming YMCs. Such YMC progenitor clouds are expected to have a high mass (105 M⊙) and small radii (a few pc) with high volume and column densities (104 cm-3; 1023 cm-2). Before the onset of star formation, the gas is also expected to be very cold ( K). In order to resolve the internal structure of objects with radii pc requires limiting the search to gas clouds within our own Galaxy.
Compared to the objects found in recent surveys of dense cluster-forming molecular clumps, one object, , stands out as extreme (e.g. Sridharan et al., 2002; Hill et al., 2005; Beuther et al., 2002; Schuller et al., 2009; Bally et al., 2010; Aguirre et al., 2011; Molinari et al., 2010a; Rathborne et al., 2006; Simon et al., 2006a, b; Pillai et al., 2006; Peretto & Fuller, 2009; Jackson et al., 2006; Rathborne et al., 2009; Longmore et al., 2007; Purcell et al., 2006, 2009; Walsh et al., 2008, 2011; Jackson et al., 2011). Identified as an infrared dark cloud (IRDC), it is clearly seen as a prominent extinction feature in mid-IR images (see Figure 1). Molinari et al. (2011) place in the “elliptical ring” feature orbiting the Galactic center, putting it pc in front of the Galactic center, at a distance of 8.4 kpc (Reid et al., 2009). With a dust temperature of 20 K, volume density of 104 , dust mass of 105 M⊙, and almost no signs of star-formation, , has exactly the properties expected for the precursor to a massive, Arches-like cluster (Lis et al., 1994; Lis & Menten, 1998; Lis et al., 2001; Bally et al., 2010).
Despite having the expected global properties for a YMC precursor, the dynamical state and fate of future star formation in remains uncertain. While the detection of a weak water maser suggests there may be a small number of low-mass stars forming (Lis et al., 1994), it is unclear whether the gas is globally bound and collapsing (and therefore going to form a massive cluster) or unbound and transient (Lis & Menten, 1998). This ambiguity is complicated by the extreme environmental conditions within the Galactic center region (e.g. crowding, intense radiation fields, large magnetic fields, tidal shear). Given its importance as a potential precursor to a YMC, we make use of higher resolution and sensitivity data to study in detail and attempt to ascertain its dynamical state.
2. Survey data and new observations
2.1. Survey data
We make use of multi-wavelength archival data from the United Kingdom Infrared Digital Sky Survey (UKIDSS: Lawrence et al., 2007, data release 7), the Spitzer Galactic Legacy Infrared Mid-Plane Survey Extraordinaire (GLIMPSE: Benjamin et al., 2003), the Submillimetre Common-User Bolometer Array (SCUBA) on the James Clerk Maxwell Telescope (JCMT) (Di Francesco et al., 2008) and the methanol multi-beam survey (MMB: Caswell et al., 2010). We also make use of recently available data from the Herschel Infrared Galactic Plane Survey (HiGAL: Molinari et al., 2010b, 2011), the H2O southern Galactic plane survey (HOPS: Walsh et al., 2008, 2011) and the Millimetre Astronomy Legacy Team 90 GHz Survey (MALT90: Jackson et al., 2011; Foster et al., 2011). Details of the surveys including observational parameters and references outlining the data acquisition/reduction procedures can be found in Table 1.
| Survey/Archive | Telescope(s) | continuum/line | Reference(s) | ||
|---|---|---|---|---|---|
| UKIDSS | UKIRT | 1.2, 1.6, 2.2 m | continuum | 1′′ | Lawrence et al. (2007) |
| GLIMPSE | Spitzer | 3.6, 4.5, 5.6, 8.0 m | continuum | 2′′ | Benjamin et al. (2003) |
| HiGAL | Herschel | 70, 160, 250, 350, 500 m | continuum | 536′′ | Molinari et al. (2010b, 2011) |
| SCUBA Archive | JCMT | 450, 850 m | continuum | 8′′ | (Di Francesco et al., 2008) |
| MALT90 | Mopra | 3 mm | line | 35′′ | (Jackson et al., 2011; Foster et al., 2011) |
| HOPS | Mopra | 12 mm | line | 2 | (Walsh et al., 2008, 2011) |
| MMB | Parkes & ATCA | 3 cm | line | 1′′ | (Caswell et al., 2010) |
2.2. VLT/NACO Observations
Deep, near-IR data were obtained with the Nasmyth Adaptive Optics System Near-Infrared Imager and Spectrograph (NAOS-CONICA, or NACO) on the Very Large Telescope (VLT) on May 5th 2011. A field of view of centered on , (J2000) was imaged in , and . Although offset from the nominal center of , this position was chosen to be centered on a foreground star which was bright enough to use the Natural Guide Star adaptive optics system guiding with camera S54 and dichroic N20C80. After flatfielding and sky subtraction using IRAF111IRAF is distributed by the National Optical Astronomy Observatories, which are operated by the Association of Universities for Research in Astronomy, Inc., under cooperative agreement with the National Science Foundation. standard tools, the six dithered exposures of 10s each in each filter were shifted and combined into the final , and images. The source extraction and PSF photometry were done with IRAF DAOPHOT using standard techniques and error cuts. We used Topcat222Taylor (2005): http://www.star.bris.ac.uk/mbt/topcat/ to match all the stars towards observed by VLT/NACO with the UKIDSS data (see 3.1). Differences in filter wavelengths were corrected to first order using the principles described in Stead & Hoare (2009) and Appendix A of Schödel et al. (2010). Remaining uncertainties in color effects and from the statistical scatter mean the error in calibration is no more than mag at each wavelength. The final NACO catalog contains 358, 1001 and 1830 sources, detected to the level up to 21.3, 20.5 and 19.8 mag in , and , respectively. Despite the error cuts, up to 2% of the sources in the catalog in each filter are still spurious detections.
3. Results
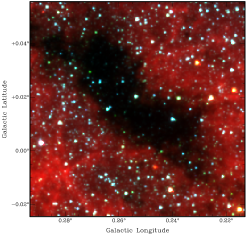
Figure 1 shows continuum images of at 3.68.0m, 70m and 450m. is elongated with an aspect ratio of approximately 3:1 and is seen as an extinction feature from 3.6 to 70m with no obvious embedded emission sources. As such it must be both cold and dense and sit in front of the majority of the diffuse Galactic mid-IR background emission. At wavelengths 170m, bright emission is seen across (Molinari et al., 2011) with similar morphology to the 450m emission shown in Figure 1. The lack of embedded emission sources at wavelengths up to 70m combined with results from recent maser surveys which show no 6.7 GHz CH3OH masers (Caswell et al., 2010) or new 22 GHz H2O maser detections (Walsh et al., 2011) strongly reinforces the paucity of active star formation within the cloud.
3.1. Near-IR extinction
From continuum observations alone it is not possible to determine whether the emission from arises from a single physical entity or from multiple clouds along the same line of sight. Extinction measurements can be used to distinguish between these two scenarios. Additionally, given the confusion and the difficulty deriving kinematic distances towards the Galactic center, extinction measurements also offer an independent distance determination.
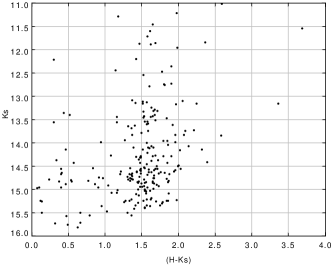
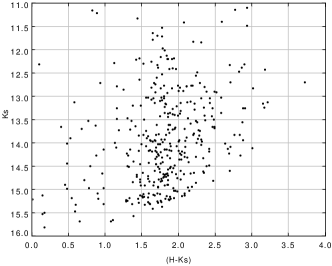
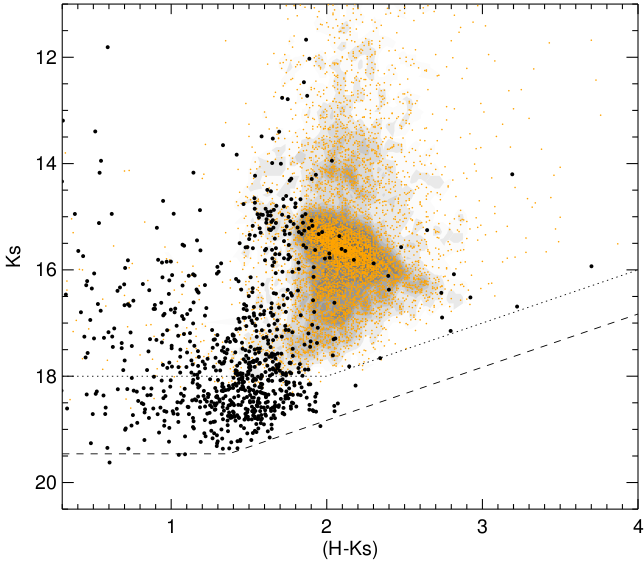
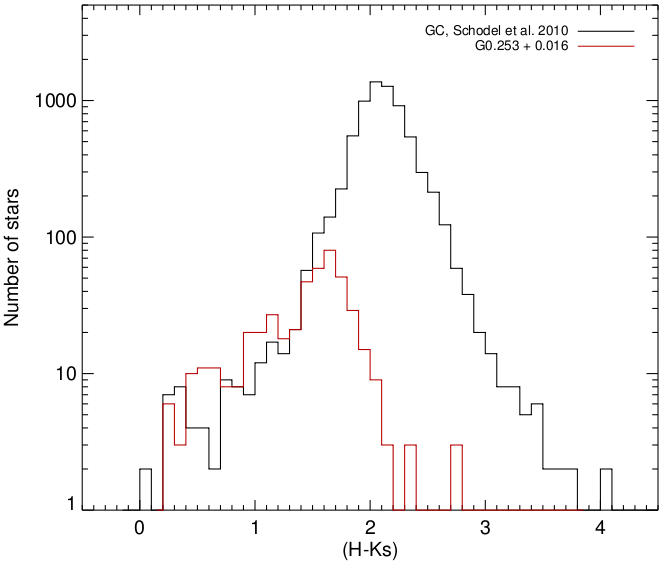
We used data from UKIDSS, specifically the Galactic Plane Survey (GPS: Lucas et al., 2008), and deep VLT/NACO observations (see 2.2) to investigate the near-IR extinction towards . We downloaded the infrared sources in a 15 x 15 region centered on from the UKIDSS data base, which allowed for a direct and coherent comparison of the cloud and off-cloud properties. The comparison of on- and off-source vs. color-magnitude diagrams (CMDs) showed that there are far fewer very red stars in the direction of than in any of the off-source diagrams, with a clear and maintained deficit in the number of red stars well established by mag (see top panel of Figure 2)333 It should be noted that across the UKIDSS field examined there is also considerable variation in the foreground extinction, not surprising in a field so close to the Galactic Centre direction. . This is equally clearly seen when comparing the NACO data for with similar field of view, albeit shallower, NACO observations toward the Galactic Centre by Schödel et al. (2010): Figure 2 shows the vs. CMD, and the histogram of colors for that Galactic Centre field and for . Toward the Galactic center, the red giant branch bump feature is clearly seen extending to 2.6 mag, after which it is effected by completeness limits. However, despite being 2 mag deeper, the number of sources toward drops rapidly above an of 1.7 mag, clearly showing that the extinction is produced by a sharp increase in dust density as expected from a dense cloud, as opposed to being produced by several low-density clouds along the line-of-sight which would be seen as a much more gradual decrease in the number of red stars.
We used the NACO data and Eq. 2 of Nishiyama et al. (2006) to estimate the distance to the cloud, using the red clump (RC) stars around mag. We assume an absolute magnitude for the RC stars of mag444 We adopt the Schödel et al. (2010) value of rather than that of in Nishiyama et al. (2006) as we are directly comparing our data to the former., a population correction , and the extinction law of Schödel et al. (2010) for the Galactic Centre (). The distance modulus is then given by , where is the observed, de-reddened magnitude. We are looking for the distance to the near side of the cloud, so we used mag to determine the extinction, since this is the color where we start to lose stars with respect to the Galactic Centre of Schodel et al. (2010) (see Figure 2, right-hand panel). Using the aforementioned extinction law, we derive mag for an effective wavelength of m, which, when applied to the observed magnitude of the RC stars ( mag), yields a de-reddened mag, or considering the difference between and (Nishiyama et al., 2006). The distance modulus is then , translating into a distance of kpc and independently placing it just foreground of the Galactic Centre. The greatest source of uncertainty in this analysis is undoubtedly the extinction law, and we note that a difference of only 10% in the exponent of the extinction law in particular translates into an approximately 10% change in the derived distance.
In summary, based on the UKIDSS and NACO data we conclude that we have undoubtedly detected the extinction caused by , and that this is a single physical entity (as opposed to multiple clouds separated by large distances along the line of sight) with a distance consistent with being close in proximity to the Galactic Centre. Within the uncertainties, the IR-derived distance to of kpc is consistent with the distance of 8.4 kpc that would be inferred if is part of the “100 pc” ring orbiting the Galactic center, as proposed by Molinari et al. (2011). The distance to the “100 pc ring”, in turn, is based on the distance to the Galactic center determined by Reid et al. (2009). As the formal uncertainty in the distance to the Galactic center is smaller than that from the IR-derived distance, we adopt a distance to G0.253+0.016 of 8.4 kpc for the remainder of the paper. The results of the paper remain valid if the nearer distance were adopted.
3.2. Dust temperature, column density, radius and dust mass
HiGAL data of the inner 2 of the Galactic center covering the Central Molecular Zone and are presented by Molinari et al. (2011). Because continuum emission at these wavelengths is typically optically-thin and arises from the dust, we can use the Herschel data to derive the dust temperature and column density of .
The dust temperature and gas column density of were estimated from a two-step pixel-to-pixel graybody fit to the Hi-GAL data. In the first coarse-angular-resolution step, graybody fits were calculated using the 170 - 500 m data, scaled to the resolution of the 500 m image (36′′). These results were used as inputs to the second, high-angular-resolution graybody fits to the 170 - 350 m data, which were scaled to the resolution of the 350 m image (25′′). Both steps used a fixed of 1.75 and did not include the 70 m point due to the high optical depth at this wavelength. The fitting method is similar to that described in Bernard et al. (2010) and Compiègne et al. (2011) but with the diffuse component of the emission removed (see Battersby et al., 2011, for full details on the methodology).
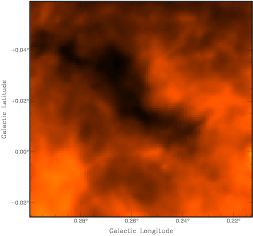
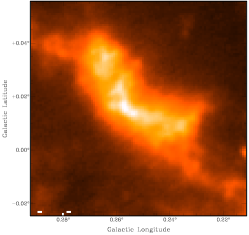
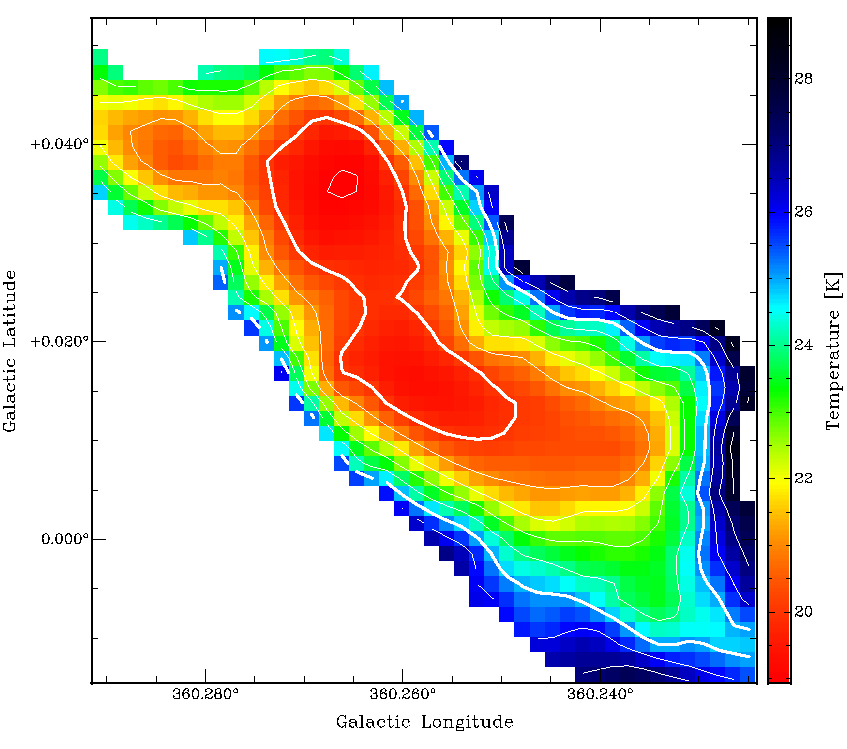
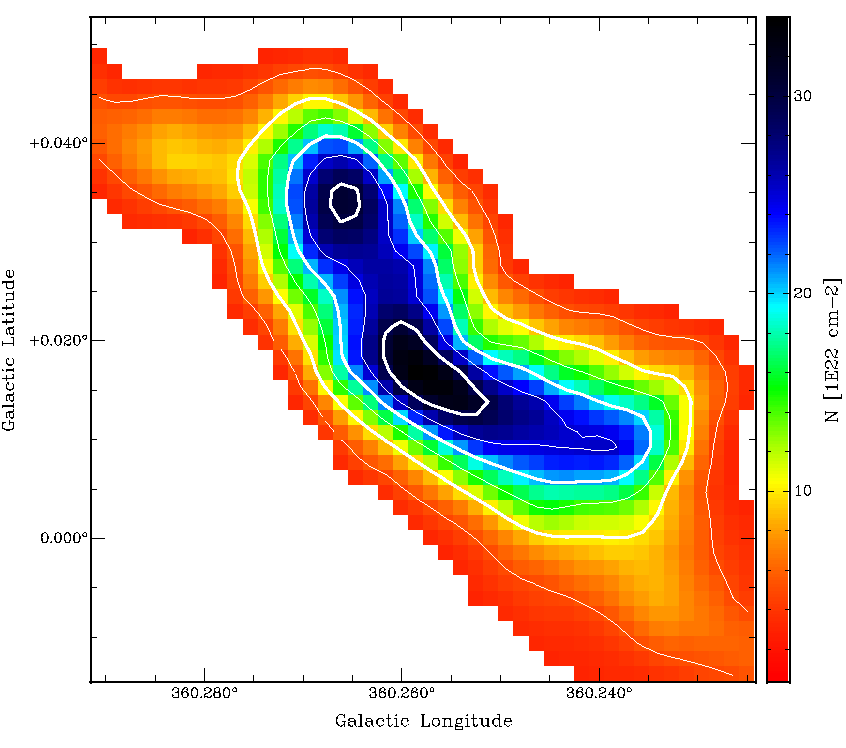
Figure 3 shows the derived dust temperature and column density maps. We find the dust temperature overall is low, increasing smoothly from 19 K at the center to 27 K at the edge. There are no obvious small pockets of heated dust from any embedded sources. The derived external temperature of is significantly warmer (35 K).
The column density and dust temperature are anticorrelated as expected for an externally-heated, dense clump. The derived peak column density is 3.31023 cm-2 and decreases smoothly towards the edge. The cloud area was defined using a column density threshold of 31022 cm-2 which covers all the emission at T K. Within this area the average column density is 11023 cm-2. The emission is elongated with semi-major and semi-minor axes of , corresponding to a physical radius of 4.71.7 pc for a distance of 8.4 kpc. Taking the geometric mean, we derive an effective radius of 2.8 pc for .
Given the strong dependence of dust emissivity with temperature and to account for the dust temperature variation across , we calculate the dust mass directly from the derived column density rather than from mm continuum emission which assumes a single dust temperature. The dust mass was calculated by multiplying the column density of each pixel by the pixel area, assuming a mean molecular weight of 2.8MH-atom (Kauffmann et al., 2008) and gas-to-dust ratio of 100:1 (Hildebrand, 1983)555Due to the metallicity gradient in the disk (Balser et al., 2011), it is possible the gas-to-dust ratio in the CMZ may be lower than the canonical value of 100:1 commonly adopted in the literature. However, as individual metallicity measurements across the CMZ vary from 1 to 4 Solar (Shields & Ferland, 1994; Maeda et al., 2002; Najarro et al., 2009) and no independent measurements exist for , we opt for the standard gas-to-dust ratio of 100:1, while noting the dust-based mass may possibly be lower., and summing over the pixels in the cloud area. The total mass is not particularly sensitive to the column density threshold, varying by 10% for threshold values of 151022 cm-2. We derive a dust mass for of 1.3105 M⊙ and estimate the uncertainty to be of order 20%.
3.3. Molecular line data: linewidth and virial mass
To determine whether is gravitationally-bound we compared the dust mass with the virial mass, Mvir. Mvir is related to the measured radius, R, and linewidth, V, through M, where the constant of proportionality depends on the geometry and gas density profile (MacLaren et al., 1988; Bertoldi & McKee, 1992; Dunham et al., 2010). Clearly, small differences in linewidth can strongly affect the virial mass so it is important to ensure the measured linewidth reflects the underlying gas kinematics and has not been affected via other mechanisms (e.g. different excitation conditions, outflows, shocks, chemistry and optical-depth effects).
We used recently available data from the ongoing MALT90 molecular line survey (Jackson et al., 2011; Foster et al., 2011) to investigate the velocity structure of . Detailed analysis and modelling of the emission from the many detected molecular line transitions are underway and will be presented in a subsequent paper (Rathborne et al. in preparation). Here we focus on the global line properties with the aim of deriving the most reliable, representative linewidth for .
The brightest, optically-thick lines [e.g. HCO+(1-0), HNC(1-0)] show the velocity structure towards this region is complicated. Emission is seen from several distinct velocity components over the spatial extent of defined in 3.2. The most prominent of these are: a component at 0 kms-1 seen at the north-east edge of the filament; a component at 35 kms-1 covering a similar emission area as the spatial extent of defined above; and a component at 75 kms-1 seen towards the south west edge of the filament. Given the spatial extent of the 35 kms-1 component closely matches that of the dust emission, we take this component as the emission from , with the other components being from unrelated clouds along the line of sight.
The 35 kms-1 component shows evidence for shifts in the peak Vlsr with changes in spatial position (ie a velocity gradient). This means that taking a spectra from an individual spatial position would not accurately recover the integrated linewidth over the whole region, as the linewidth-broadening from the velocity gradient would not be taken into account. To overcome this requires extracting spectra which are integrated over the spatial extent of .
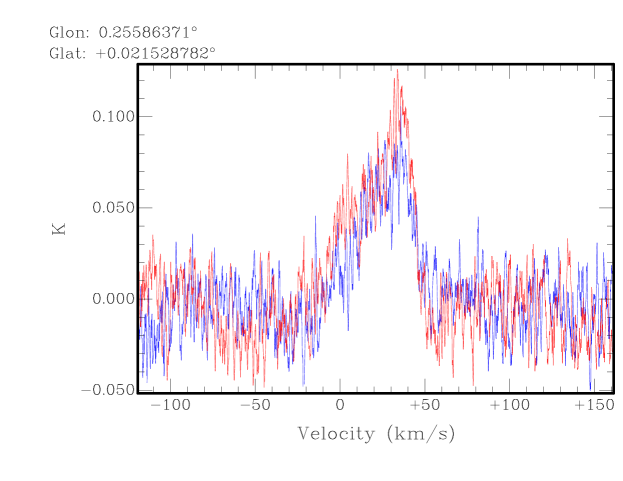
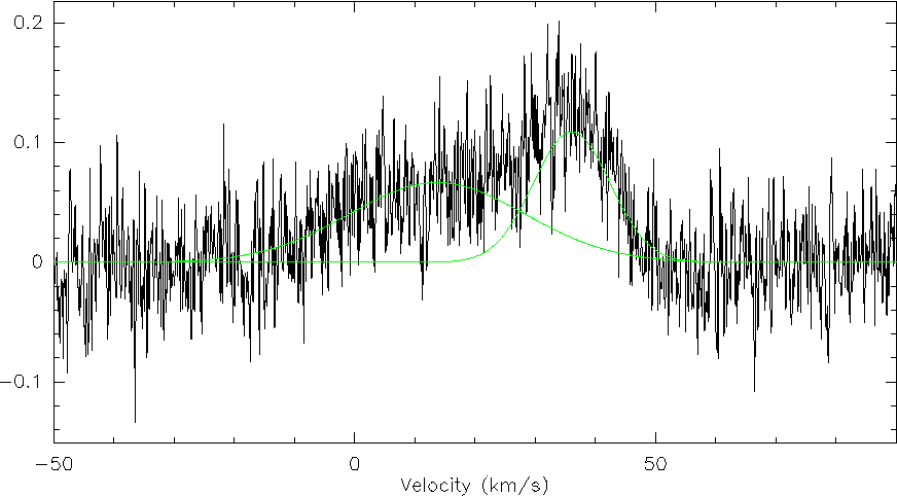
We selected bright, optically-thin emission as the most likely reliable tracer of the underlying gas kinematics. The top panel of Figure 4 shows Hanning-smoothed spectra from the H13CO+(1-0) and HN13C(1-0) transitions integrated over the spatial extent of the cloud (as determined in 3.2). The line profiles for both transitions are similar, giving confidence that they are robustly tracing the underlying gas kinematics. Both the V component from and the V component are seen but the 75 kms-1 component is too faint in these optically-thin transitions to be detected. The bottom panel of Figure 4 shows the spatially-averaged HN13C(1-0) emission with no Hanning smoothing. This emission was fit with a two-component Gaussian profile using the tasks within the CLASS666CLASS is part of the GILDAS software environment: http://iram.fr/IRAMFR/GILDAS/ software package. To avoid biasing the fit results we did not constrain any of the parameters but rather left them all as free variables. From the resulting fits, which are overlayed on the spectra in the bottom panel of Figure 4, we derive the peak velocity and FWHM of the gas associated with to be V and V, respectively. We adopt an upper limit linewidth of 16 kms-1 for for the remainder of the paper.
The derived virial mass can vary by an order of magnitude depending on the assumed geometry and density distribution. Assuming a spherical source with a density distribution gives a virial mass estimate of 9104 M⊙ (MacLaren et al., 1988, Eq 3). However, more realistically, for a centrally-condensed cloud elongated with axis ratio 3:1 and density , the virial mass would be 4105 M⊙ (Bertoldi & McKee, 1992; Dunham et al., 2010). Despite the assumptions and systematic uncertainties, the dust and virial mass estimates agree to within a factor of a few. Thus it is likely is close to virial equilibrium.
4. Discussion
The global properties of derived in 3 are summarized in Table 2. Based on these results, is a strong candidate precursor of an Arches-like YMC. The only other two similar Galactic YMC-forming clouds that have been studied to date are Sgr B2 and W49A (e.g. Goldsmith et al., 1990; Alves & Homeier, 2003). However, these are both much more evolved, with massive cluster formation well underway. The powerful feedback from ongoing star formation has strongly affected the cloud structure in these regions, so observations of the gas do not probe the initial conditions prior to the onset of star formation.
We speculate that may be unique in representing the initial conditions of a Galactic molecular cloud on the verge of forming a YMC. As such, its detailed study can reveal important clues about massive cluster formation and help test theoretical models. Current theories suggest that the early evolution of stellar clusters depends crucially on the spatial and kinematic distribution of stars (e.g. Goodwin & Bastian, 2006; Allison et al., 2010). However, while the distribution of emergent stellar populations as “hierarchical” or “centrally-condensed” may be straightforward to quantify when analyzing stars, quantifying the small-scale distribution of the gas in a similar way is complicated (see e.g. Lomax et al., 2011). Because gas can not easily be counted in discreet, observationally-defined units, the results of algorithms attempting to quantify gas substructure are notoriously subjective to the values of user-defined inputs (see e.g. Pineda et al., 2009).
Regardless of the exact details of the formation mechanism, the properties of the emergent stellar population must be directly related to the initial global gas properties. Assuming a reasonable star formation efficiency (SFE) (e.g. 30% for gas cm-3; Alves et al., 2007), may form a cluster with stellar mass and density similar to that of other YMCs like the Arches. Whether or not such a cluster remains gravitationally-bound depends on the SFE and environmental conditions (tidal shear, interaction with GMCs etc, e.g. Kruijssen, 2011; Elmegreen & Hunter, 2010). However, it is clear that has enough mass to form an Arches-like cluster without accreting any additional gas or stars from outside the present-day observed boundary.
With only a single candidate YMC precursor it is not possible to determine how representative is of all YMC progenitors. It is clearly desirable to search for other proto-YMC molecular clouds, especially within the Galaxy. In the last decade much observational effort has been directed towards searching for, and characterizing the physical properties of molecular clouds which are likely the progenitors of stellar clusters. As a result, a large fraction of the gas in the Galaxy available to form YMCs has been surveyed in dust continuum and dense molecular gas tracers.
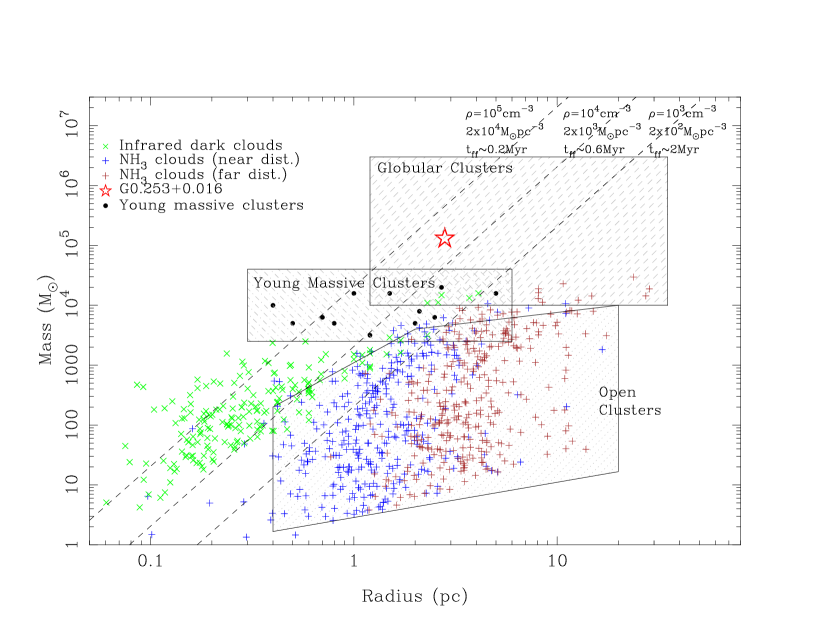
Figure 5 summarizes the results from two of these surveys and places in the context of Galactic molecular clouds and stellar clusters. Plus symbols show ammonia clumps detected in HOPS (Walsh et al., 2011). The critical density of ammonia is close to the volume density threshold of 104 cm-3 proposed by Lada et al. (2010) as the threshold required to form stars. As such HOPS is ideal for identifying and characterizing the properties of star forming gas within the Galaxy. Green crosses show IRDCs from the survey of Rathborne et al. (2006). IRDCs are thought to be precursors of high mass stars and clusters. The region of the mass-radius plane covered by the HOPS clouds and IRDCs is similar to that of clouds detected in other surveys, both targeted (e.g. as compiled by Kauffmann & Pillai, 2010) and blind, large-area surveys (BGPS – Aguirre et al. (2011); ATLASGAL – Schuller et al. (2009), Tachenberg et al submitted and Beuther et al. priv. comm). The hatched rectangles show the mass-radius range of different stellar clusters (Portegies Zwart et al., 2010) and the black dots show Galactic YMCs. With the exception of a few clouds which may form small YMCs, assuming a reasonable star formation efficiency, most of the observed molecular clouds seem destined to form open clusters. is marked with a red star and clearly stands out. It is significantly more massive for its size compared to the other Galactic molecular clouds. It is potentially the only object with an observed gas mass and density which may be able to directly form a cluster with stellar mass and densities in the YMC/globular cluster regime.
The potential uniqueness of has profound implications for YMC formation in the Galaxy. We posit three scenarios. If all YMCs form from molecular clouds with similar properties to , either i) is unique in the Galaxy, or, ii) surveys have missed the other similar clouds. Alternatively, iii) if the properties of are not representative of other molecular clouds destined to form YMCs, there may be precursors to YMCs in the Galaxy which have already been observed but not identified as YMC precursors.
To distinguish between these scenarios it is important to predict how many proto-YMC molecular clouds are likely to exist at any given time in the Galaxy. One way to estimate this is following the analytical approach of Gieles (2009). Assuming a star formation rate of 1 M⊙/yr with 10% of stars forming in clusters and a cluster mass function index of , we would expect 10 clusters of 104 M⊙ with ages 10 Myr. This estimate is consistent with the number of YMCs currently known in the Galaxy. If the number of Galactic YMCs is constant, assuming it takes of order a Myr to evolve from precursor to forming cluster we would expect from zero to a few precursors at any given time. An alternative method to estimate the expected number of proto-YMC molecular clouds in the Galaxy is extrapolating the observed embedded cluster mass function (ECMF), which, for embedded clusters up to M⊙ within 2 kpc of the Sun, is a power-law with index (Lada & Lada, 2003). Assuming this represents the Galactic ECMF (see Gieles, 2009), one can scale it to the total volume of the Galactic disk to estimate the number of embedded clusters expected in the Galaxy. Extrapolating this to higher cluster masses, we expect young clusters with masses between and M⊙. Assuming a cluster lifetime of 10 Myr we predict proto-YMCs per Myr in the Galaxy. Both of these approaches suggest there may be other Galactic YMC progenitors. While these estimates are approximate, they predict that only a small number of proto-YMCs should exist in the Galaxy at any given time. However, the uncertainties are sufficiently large that it is not possible to use these estimates to rule out as being unique. Therefore, it is currently not possible to distinguish between scenarios i) and ii).
Returning to scenario iii), there are many molecular cloud complexes known with sufficient mass to form YMCs but their present-day gas density is much lower than the expected final YMC stellar density. Examples of these are seen clearly in Figure 5 as clouds with mass M⊙ and radii pc. Such clouds seem destined to form massive, but unbound, associations. However, it may be possible to form the required YMC stellar densities over time from the convergence of molecular gas flows on large scales and subsequent global gravitational collapse. Indeed, such large-scale gravitational collapse has been directly observed towards a number of massive protoclusters (e.g. W33A (Galván-Madrid et al., 2010), DR21 (Schneider et al., 2010), G10.6 (Keto et al., 1988; Baobab Liu et al., 2010), G8.67 (Longmore et al., 2011)) and is predicted by numerical simulations (Smith et al., 2009; Klessen & Hennebelle, 2010). In this scenario, star formation would proceed over several crossing times, leading to a large age spread in cluster members. In this regard, it is interesting to note that an age spread of Myr among cluster members are reported in several YMCs (NGC 3603, NGC 346, 30 Doradus – Beccari et al., 2010; De Marchi et al., 2011a, b). However, there is some debate in the literature over the uncertainty in the age determination of cluster members using this method and whether or not these data are also consistent with age spreads of 3 Myr (Tobin et al., 2009; Baraffe et al., 2009; Littlefair et al., 2011; Jeffries et al., 2011). Detailed studies of the large-scale gas motions in the youngest and most massive molecular clouds are needed to determine whether the gas/stellar density will increase over time to form YMCs as opposed to more diffuse and gravitationally-unbound OB associations as would be predicted by their current global gas density.
With this scenario in mind, it is interesting to note that large-scale emission from shocked-gas tracers is detected towards . Combined with gas temperatures of 80 K (Lis et al., 2001, Rathborne et al. in prep), which is much warmer than the dust temperature, this suggests may have formed from a cloud-cloud collision or convergence of large scale flows. As the gas has not yet had the chance to heat up the dust, this must have happened recently. If this is the case, before the postulated collision/convergence, the gas properties of may have been much more similar to the typical Galactic molecular cloud population and thus may not have stood out as extreme in Figure 5.
Given the location of near to the Galactic center, it is tempting to invoke the extreme conditions at the Galactic center (e.g. interstellar radiation field enhanced by 103, external pressure P/k108, strong magnetic fields, gamma rays) to justify why it may be unique. In this regard it is interesting to note that lies at a projected distance of only 18 pc from the Arches and Quintuplet clusters. While it is not possible to directly link the formation of the Arches with , it seems plausible that the Arches could have formed at its present distance from the Galactic center. On larger scales appears to be part of a 106 M⊙ filament of interconnected clumps of which is the most massive (Lis et al., 2001). This filament is itself thought to be part of the 3107 M⊙, 100 pc ring identified by Molinari et al. (2011). The 100 pc ring is orbiting the Galactic center at 80 kms-1 so a single orbit would take 3.6 Myr. Given the free-fall time for is 1 Myr (see Table 2), it seems unlikely would survive a whole orbit without additional support – not implausible given the extreme conditions at the Galactic center. If such additional support could be maintained against the rapid turbulent energetic decay, this may explain why the cloud has remained dense and starless.
Alternatively, the fate of the may be more intimately linked to the dynamics of the 100 pc ring. Gas is thought to enter the ring at the intersection points of the innermost stable X1 orbits and the X2 orbits. These intersection or “crashing” points coincide with Sgr B2 and Sgr C – the only places in the 100 pc ring with prodigious star formation activity. If the gas comprising were to have entered the 100 pc ring at Sgr C it would have joined only a small fraction of an orbit time ago. In around a free-fall time, the whole 106 M⊙ filament in which is located will have reached the position of Sgr B2. As such, this larger filament could be in the process of forming a 106 M⊙, Sgr B2-like complex.
However, while it is tempting to invoke the extreme conditions at the Galactic center to justify why may be unique, several of the most massive YMCs in the Galaxy are not located near the Galactic center suggesting the extreme environmental conditions are not a necessary condition to form a YMC.
5. Conclusions
We make use of existing multi-wavelength data including recently available far-IR continuum (Herschel/Hi-GAL) and mm spectral line (HOPS and MALT90) data and present new, deep, multiple-filter, near-IR (VLT/NACO) observations to study the infrared-dark cloud . From these data we have derived the global properties of . It has a high mass (M M⊙), low dust temperature (23 K), small radius (2.8 pc), high volume density (7.3 cm-3) and high column density (3.5 cm-2). It is close to virial equilibrium with almost no signs of active star formation. As such it appears to be a prime candidate for the initial conditions of a molecular cloud destined to form an Arches-like YMC.
Comparing the properties of to other Galactic dense molecular clouds shows it to be extreme. We discuss implications of this for the formation of massive protoclusters and posit three scenarios. If all YMCs form from molecular clouds with similar properties to , either i) is unique in the Galaxy, or, ii) surveys have missed the other similar clouds. Currently it is not possible to distinguish between scenarios i) and ii). Nevertheless, clouds with properties like must be very rare in the Galaxy making extremely important for testing massive cluster formation models. Alternatively, in scenario iii) the properties of do not represent those of other molecular clouds destined to form YMCs. We note there are many molecular clouds in the Galaxy with sufficient mass to form YMCs but their present-day gas density is much lower than the expected YMC stellar densities. However, it may be possible to form the required stellar densities over time from the convergence of molecular gas flows on large scales and subsequent global gravitational collapse, as observed towards several lower-mass protoclusters. Detailed studies of the large-scale gas motions in the youngest and most massive molecular clouds are needed to determine whether the gas/stellar density will increase over time to form YMCs as opposed to more diffuse and gravitationally-unbound OB associations as would be predicted by their current global gas density.
In future work we will study the internal structure and kinematics of in detail to investigate its recent dynamical history, test the plausibility that it formed from cloud-cloud collisions or converging large-scale flows, and directly test models of massive protocluster formation.
6. Acknowledgments
We thank the anonymous referee for constructive comments that improved the manuscript. SNL would like to thank Jens Kauffmann, Thushara Pillai, Qizhou Zhang, Henrik Beuther, Peter Schilke and Adam Ginsburg for useful discussions. This research made use of the NASA Astrophysical Data System. The research leading to these results has received funding from the European Community’s Seventh Framework Programme (/FP7/2007-2013/) under grant agreement No 229517.
| M | D | R | Tdust | V | N | ||||
| (M⊙) | (kpc) | (pc) | (K) | (km/s) | (cm-3) | (cm-2) | (Myr) | (Myr) | (Myr) |
| 1.3E5 | 8.4 | 2.8 | 19-27 | 16 | 7.3E4 | 3.5E23 | 0.17 | 8 | 0.74 |
 |
 |
 |
 |
 |
 |
 |
 |
 |
References
- Aguirre et al. (2011) Aguirre, J. E., Ginsburg, A. G., Dunham, M. K., & et al. 2011, ApJS, 192, 4
- Allison et al. (2010) Allison, R. J., Goodwin, S. P., Parker, R. J., Portegies Zwart, S. F., & de Grijs, R. 2010, MNRAS, 407, 1098
- Alves & Homeier (2003) Alves, J. & Homeier, N. 2003, ApJL, 589, L45
- Alves et al. (2007) Alves, J., Lombardi, M., & Lada, C. J. 2007, A&A, 462, L17
- Ascenso et al. (2007) Ascenso, J., Alves, J., Beletsky, Y., & Lago, M. T. V. T. 2007, A&A, 466, 137
- Ashman & Zepf (2001) Ashman, K. M. & Zepf, S. E. 2001, AJ, 122, 1888
- Bally et al. (2010) Bally, J., Aguirre, J., Battersby, C., & et al. 2010, ApJ, 721, 137
- Balser et al. (2011) Balser, D. S., Rood, R. T., Bania, T. M., & Anderson, L. D. 2011, ApJ, 738, 27
- Baobab Liu et al. (2010) Baobab Liu, H., Ho, P. T. P., Zhang, Q., Keto, E., Wu, J., & Li, H. 2010, ApJ, 722, 262
- Baraffe et al. (2009) Baraffe, I., Chabrier, G., & Gallardo, J. 2009, ApJL, 702, L27
- Battersby et al. (2011) Battersby, C., Bally, J., Ginsburg, A., & et al. 2011, ArXiv e-prints
- Beccari et al. (2010) Beccari, G., Spezzi, L., De Marchi, G., & et al. 2010, ApJ, 720, 1108
- Benjamin et al. (2003) Benjamin, R. A., Churchwell, E., Babler, B. L., & et al. 2003, PASP, 115, 953
- Bernard et al. (2010) Bernard, J.-P., Paradis, D., Marshall, D. J., & et al. 2010, A&A, 518, L88+
- Bertoldi & McKee (1992) Bertoldi, F. & McKee, C. F. 1992, ApJ, 395, 140
- Beuther et al. (2002) Beuther, H., Schilke, P., Menten, K. M., & et al. 2002, ApJ, 566, 945
- Caswell et al. (2010) Caswell, J. L., Fuller, G. A., Green, J. A., & et al. 2010, MNRAS, 404, 1029
- Clark et al. (2005) Clark, J. S., Negueruela, I., Crowther, P. A., & Goodwin, S. P. 2005, A&A, 434, 949
- Compiègne et al. (2011) Compiègne, M., Verstraete, L., Jones, A., & et al. 2011, A&A, 525, A103+
- Danielson et al. (2011) Danielson, A. L. R., Swinbank, A. M., Smail, I., & et al. 2011, MNRAS, 410, 1687
- Davies et al. (2011) Davies, B., Bastian, N., Gieles, M., & et al. 2011, MNRAS, 411, 1386
- De Marchi et al. (2011a) De Marchi, G., Panagia, N., & Sabbi, E. 2011a, ApJ, 740, 10
- De Marchi et al. (2011b) De Marchi, G., Paresce, F., Panagia, N., & et al. 2011b, ApJ, 739, 27
- Di Francesco et al. (2008) Di Francesco, J., Johnstone, D., Kirk, H., MacKenzie, T., & Ledwosinska, E. 2008, ApJS, 175, 277
- Dunham et al. (2010) Dunham, M. K., Rosolowsky, E., Evans, II, N. J., & et al. 2010, ApJ, 717, 1157
- Elmegreen & Hunter (2010) Elmegreen, B. G. & Hunter, D. A. 2010, ApJ, 712, 604
- Figer et al. (1999) Figer, D. F., Kim, S. S., Morris, M., & et al. 1999, ApJ, 525, 750
- Figer et al. (2006) Figer, D. F., MacKenty, J. W., Robberto, M., & et al. 2006, ApJ, 643, 1166
- Foster et al. (2011) Foster, J. B., Jackson, J. M., Barris, E., & et al. 2011, ArXiv e-prints
- Galván-Madrid et al. (2010) Galván-Madrid, R., Zhang, Q., Keto, E., & et al. 2010, ApJ, 725, 17
- Gieles (2009) Gieles, M. 2009, MNRAS, 394, 2113
- Goldsmith et al. (1990) Goldsmith, P. F., Lis, D. C., Hills, R., & Lasenby, J. 1990, ApJ, 350, 186
- Goodwin & Bastian (2006) Goodwin, S. P. & Bastian, N. 2006, MNRAS, 373, 752
- Hildebrand (1983) Hildebrand, R. H. 1983, QJRAS, 24, 267
- Hill et al. (2005) Hill, T., Burton, M. G., Minier, V., & et al. 2005, MNRAS, 363, 405
- Holtzman et al. (1992) Holtzman, J. A., Faber, S. M., Shaya, E. J., & et al. 1992, AJ, 103, 691
- Jackson et al. (2011) Jackson, J. M., Foster, J., Brooks, K., Rathborne, J., & Longmore, S. 2011, in American Astronomical Society Meeting Abstracts, Vol. 218, American Astronomical Society Meeting Abstracts 218, 217.02–+
- Jackson et al. (2006) Jackson, J. M., Rathborne, J. M., Shah, R. Y., & et al. 2006, ApJS, 163, 145
- Jeffries et al. (2011) Jeffries, R. D., Littlefair, S. P., Naylor, T., & Mayne, N. J. 2011, MNRAS, 1538
- Johnson & Kobulnicky (2003) Johnson, K. E. & Kobulnicky, H. A. 2003, ApJ, 597, 923
- Kauffmann et al. (2008) Kauffmann, J., Bertoldi, F., Bourke, T. L., Evans, II, N. J., & Lee, C. W. 2008, A&A, 487, 993
- Kauffmann & Pillai (2010) Kauffmann, J. & Pillai, T. 2010, ApJL, 723, L7
- Keto et al. (1988) Keto, E. R., Ho, P. T. P., & Haschick, A. D. 1988, ApJ, 324, 920
- Klessen & Hennebelle (2010) Klessen, R. S. & Hennebelle, P. 2010, A&A, 520, A17+
- Kruijssen (2011) Kruijssen, J. M. D. 2011, ArXiv e-prints
- Lada & Lada (2003) Lada, C. J. & Lada, E. A. 2003, ARA&A, 41, 57
- Lada et al. (2010) Lada, C. J., Lombardi, M., & Alves, J. F. 2010, ApJ, 724, 687
- Lawrence et al. (2007) Lawrence, A., Warren, S. J., Almaini, O., & et al. 2007, MNRAS, 379, 1599
- Lis & Menten (1998) Lis, D. C. & Menten, K. M. 1998, ApJ, 507, 794
- Lis et al. (1994) Lis, D. C., Menten, K. M., Serabyn, E., & Zylka, R. 1994, ApJL, 423, L39
- Lis et al. (2001) Lis, D. C., Serabyn, E., Zylka, R., & Li, Y. 2001, ApJ, 550, 761
- Littlefair et al. (2011) Littlefair, S. P., Naylor, T., Mayne, N. J., Saunders, E., & Jeffries, R. D. 2011, MNRAS, 413, L56
- Lomax et al. (2011) Lomax, O., Whitworth, A. P., & Cartwright, A. 2011, MNRAS, 412, 627
- Longmore et al. (2007) Longmore, S. N., Burton, M. G., Barnes, P. J., & et al. 2007, MNRAS, 379, 535
- Longmore et al. (2011) Longmore, S. N., Pillai, T., Keto, E., Zhang, Q., & Qiu, K. 2011, ApJ, 726, 97
- Lucas et al. (2008) Lucas, P. W., Hoare, M. G., Longmore, A., & et al. 2008, MNRAS, 391, 136
- MacLaren et al. (1988) MacLaren, I., Richardson, K. M., & Wolfendale, A. W. 1988, ApJ, 333, 821
- Maeda et al. (2002) Maeda, Y., Baganoff, F. K., Feigelson, E. D., Morris, M., Bautz, M. W., Brandt, W. N., Burrows, D. N., Doty, J. P., Garmire, G. P., Pravdo, S. H., Ricker, G. R., & Townsley, L. K. 2002, ApJ, 570, 671
- Molinari et al. (2011) Molinari, S., Bally, J., Noriega-Crespo, A., & et al. 2011, ApJL, 735, L33+
- Molinari et al. (2010a) Molinari, S., Swinyard, B., Bally, J., & et al. 2010a, A&A, 518, L100+
- Molinari et al. (2010b) —. 2010b, PASP, 122, 314
- Najarro et al. (2009) Najarro, F., Figer, D. F., Hillier, D. J., Geballe, T. R., & Kudritzki, R. P. 2009, ApJ, 691, 1816
- Nishiyama et al. (2006) Nishiyama, S., Nagata, T., Sato, S., & et al. 2006, ApJ, 647, 1093
- Peretto & Fuller (2009) Peretto, N. & Fuller, G. A. 2009, A&A, 505, 405
- Pillai et al. (2006) Pillai, T., Wyrowski, F., Carey, S. J., & Menten, K. M. 2006, A&A, 450, 569
- Pineda et al. (2009) Pineda, J. E., Rosolowsky, E. W., & Goodman, A. A. 2009, ApJL, 699, L134
- Portegies Zwart et al. (2010) Portegies Zwart, S. F., McMillan, S. L. W., & Gieles, M. 2010, ARA&A, 48, 431
- Purcell et al. (2006) Purcell, C. R., Balasubramanyam, R., Burton, M. G., & et al. 2006, MNRAS, 367, 553
- Purcell et al. (2009) Purcell, C. R., Longmore, S. N., Burton, M. G., & et al. 2009, MNRAS, 394, 323
- Rathborne et al. (2006) Rathborne, J. M., Jackson, J. M., & Simon, R. 2006, ApJ, 641, 389
- Rathborne et al. (2009) Rathborne, J. M., Johnson, A. M., Jackson, J. M., Shah, R. Y., & Simon, R. 2009, ApJS, 182, 131
- Reid et al. (2009) Reid, M. J., Menten, K. M., Zheng, X. W., & et al. 2009, ApJ, 700, 137
- Santangelo et al. (2009) Santangelo, G., Testi, L., Gregorini, L., & et al. 2009, A&A, 501, 495
- Schneider et al. (2010) Schneider, N., Csengeri, T., Bontemps, S., & et al. 2010, A&A, 520, A49+
- Schödel et al. (2010) Schödel, R., Najarro, F., Muzic, K., & Eckart, A. 2010, A&A, 511, A18+
- Schuller et al. (2009) Schuller, F., Menten, K. M., Contreras, Y., & et al. 2009, A&A, 504, 415
- Shields & Ferland (1994) Shields, J. C. & Ferland, G. J. 1994, ApJ, 430, 236
- Simon et al. (2006a) Simon, R., Jackson, J. M., Rathborne, J. M., & Chambers, E. T. 2006a, ApJ, 639, 227
- Simon et al. (2006b) Simon, R., Rathborne, J. M., Shah, R. Y., Jackson, J. M., & Chambers, E. T. 2006b, ApJ, 653, 1325
- Smith et al. (2009) Smith, R. J., Longmore, S., & Bonnell, I. 2009, MNRAS, 400, 1775
- Sridharan et al. (2002) Sridharan, T. K., Beuther, H., Schilke, P., Menten, K. M., & Wyrowski, F. 2002, ApJ, 566, 931
- Stead & Hoare (2009) Stead, J. J. & Hoare, M. G. 2009, MNRAS, 400, 731
- Swinbank et al. (2010) Swinbank, A. M., Smail, I., Longmore, S., & et al. 2010, Nature, 464, 733
- Taylor (2005) Taylor, M. B. 2005, in Astronomical Society of the Pacific Conference Series, Vol. 347, Astronomical Data Analysis Software and Systems XIV, ed. P. Shopbell, M. Britton, & R. Ebert, 29–+
- Tobin et al. (2009) Tobin, J. J., Hartmann, L., Furesz, G., Mateo, M., & Megeath, S. T. 2009, ApJ, 697, 1103
- Walsh et al. (2011) Walsh, A. J., Breen, S. L., Britton, T., & et al. 2011, MNRAS, 416, 1764
- Walsh et al. (2008) Walsh, A. J., Lo, N., Burton, M. G., & et al. 2008, PASA, 25, 105
- Whitmore (2000) Whitmore, B. C. 2000, ArXiv Astrophysics e-prints