Clustering of sub-millimeter galaxies in a self-regulated baryon collapse model
Abstract
We have investigated the Cosmic Infrared Background (CIB) anisotropies in the framework of the physical evolutionary model for proto-spheroidal galaxies by Granato et al. (2004). After having re-calibrated the cumulative flux function at m using the available determinations of the shot noise amplitude (the original model already correctly reproduces it at shorter wavelengths) the CIB power spectra at wavelengths from m to mm measured by Planck, Herschel, SPT and ACT experiments have been fitted using the halo model with only 2 free parameters, the minimum halo mass and the power-law index of the mean occupation function of satellite galaxies. The best-fit minimum halo mass is , higher than, but consistent within the errors, with the estimate by Amblard et al. (2011) and close to the estimate by Planck Collaboration (2011). The redshift evolution of the volume emissivity of galaxies yielded by the model is found to be consistent with that inferred from the data. The derived effective halo mass, , of sub-millimeter galaxies is close to that estimated for the most efficient star-formers at the same redshift. The effective bias factor and the comoving clustering radius at yielded by the model are substantially lower than those found for a model whereby the star formation is fueled by steady gas accretion, but substantially higher than those found for a merging-driven galaxy evolution with a top-heavy initial mass function.
keywords:
submillimetre: galaxies – galaxies: statistics – galaxies: haloes – galaxies: high redshift.1 Introduction
The Herschel surveys have allowed clustering studies (Maddox et al. 2010; Cooray et al. 2010) of sub-millimeter galaxies with a statistics at least one order of magnitude better than previously possible (Blain et al. 2004; Scott et al. 2006). These studies have been complemented by determinations of the angular power spectrum of the Cosmic Infrared Background (CIB) anisotropies on BLAST (Viero et al. 2009), Planck (Planck Collaboration 2011), and Herschel (Amblard et al. 2011) maps. Due to the unique power of sub-millimeter surveys in piercing the distant universe, thanks to the strongly negative K-correction, the clustering properties contain signatures of the large scale structure at high redshifts and can allow us to discriminate between different formation mechanisms that have been proposed for sub-millimeter galaxies. For example, merger driven galaxy evolution models, that follow the evolution of both the disk and the spheroidal components of galaxies, predict much lower clustering strengths for sub-mm galaxies (e.g. Almeida et al. 2011; Kim et al. 2011) than models whereby the star formation is fueled by steady accretion of large amounts of cold gas (e.g. Davé et al. 2010).
In this paper, building on the work by Negrello et al. (2007), we investigate the constraints set by mm and sub-mm clustering data on the physical model worked out by Granato et al. (2001, 2004) and further elaborated by Lapi et al. (2006) and Mao et al. (2007).
A specific prediction of the model is that high- massive proto-spheroidal galaxies dominate the sub-mm counts over a limited flux density range (cf. Lapi et al. 2011). At m the Euclidean normalized differential counts of these objects peak at mJy; above mJy and below mJy the counts are dominated by quiescent and star-bursting late-type galaxies, less massive and less clustered than the high- proto-spheroidal galaxies. The flux density range where proto-spheroidal galaxies dominate broadens and the peak shifts to brighter flux densities with increasing (sub-)mm wavelength. Therefore, in this scenario, the expected clustering strengths depend on the flux density range that is being probed and on wavelength.
Several other analyses of data on the angular correlation function of (sub-)mm sources and of the power spectrum of the CIB anisotropies have been carried out. They however use phenomenological parameterized models for the evolution of extragalactic sources (Hall et al. 2010; Planck Collaboration 2011; Millea et al. 2011; Pénin et al. 2011) or even of the clustering power (Addison et al. 2011). Also data at different wavelengths are usually fitted separately (Planck Collaboration 2011; Amblard et al. 2011). On the contrary, the present analysis relies on a physical model for the evolution of proto-spheroidal galaxies (although the treatment of spiral and starburst galaxies is phenomenological) and aims at accounting simultaneously for clustering data over a broad range of wavelengths, from m to a few mm.
It should be noted, however, that the physical model is exploited only to compute the cumulative flux function that weights the redshift-dependent spatial power spectrum in the Limber approximation for the angular power spectrum. The Halo Occupation Distribution (HOD), which is a statistical description of how dark matter halos are populated with galaxies, is dealt with in a simplified manner, without including the relationship between luminosity and halo mass. This is the standard practice, justified by the complexity of a thorough treatment that does not appear to be required by existing data. In the Granato et al. (2004) model the star-formation rate is related to the halo mass, to the virialization redshift and to the age of the galaxy. Including these additional ingredients in the analysis is impractical at the present stage. A pioneering model that explicitly includes a relationship between infrared luminosity and halo mass has been presented by Shang et al. (2011).
The plan of the paper is the following. In § 2 we present a short overview of the evolutionary model for the relevant galaxy populations. In § 3 we describe the halo model formalism used to compute the contributions to the power spectrum of Cosmic Infrared Background (CIB) anisotropies and to the angular correlation function of detected galaxies (§ 4). Our main results are presented in § 5 and our main conclusions are summarized in § 6.
We adopt a standard flat CDM cosmology with and a local matter density .
2 Overview of the model
The sub-millimeter extragalactic sources are a mixed bag of various populations of dusty galaxies and of flat-spectrum radio sources (see, e.g., Lapi et al. 2011).
Our model interprets powerful high- sub-mm galaxies as massive proto-spheroidal galaxies in the process of forming most of their stellar mass (see also Blain et al. 2004; Narayanan et al. 2010; Davé et al. 2010). It hinges upon high resolution numerical simulations showing that dark matter halos form in two stages (Zhao et al. 2003; Wang et al. 2011; Lapi & Cavaliere 2011). An early fast collapse of the halo bulk, including a few major merger events, reshuffles the gravitational potential and causes the dark matter and the stellar component to undergo (incomplete) dynamical relaxation. A slow growth of the halo outskirts in the form of many minor mergers and diffuse accretion follows; this second stage has little effect on the inner potential well where the visible galaxy resides.
The star formation is triggered by the fast collapse/merger phase of the halo and is controlled by self-regulated baryonic processes. It is driven by the rapid cooling of the gas within a region of kpc, where is the halo mass, is regulated by the energy feedback from supernovae (SNe) and Active Galactic Nuclei (AGNs), is very soon obscured by dust and is stopped by quasar feedback. The AGN feedback is relevant especially in the most massive galaxies and is responsible for their shorter duration (yr) of the active star-forming phase. In less massive proto-spheroidal galaxies the star formation rate is mostly regulated by SN feedback and continues for a few Gyr.
Since spheroidal galaxies are observed to be in passive evolution at (e.g., Renzini 2006), they are visible at sub-mm wavelength only at high redshifts. Lapi et al. (2011) have shown that the Granato et al. (2004) model, as further elaborated by Lapi et al. (2006), provides a reasonably good fit to the observed counts from m to mm as well as to the luminosity functions in the range and to the redshift distributions at estimated from Herschel-ATLAS (Eales et al. 2010) data.
The fit was obtained using of a single SED (that of the well studied strongly lensed galaxy SMM J2135-0102, “The Cosmic Eyelash”; Ivison et al. 2010, Swinbank et al. 2010) for the whole population of proto-spheroidal galaxies. This is obviously an oversimplification and indeed the Lapi et al. (2011) counts are somewhat high at mm wavelengths, especially at relatively bright flux densities. As a consequence, the model overestimates the Poisson (shot-noise) contribution to the power spectrum of intensity fluctuations since such contribution is directly related to the source counts [see eq. (21)]. Consistency with the shot-noise levels estimated by Planck Collaboration (2011) at 353 GHz and measured by Hall et al. (2010), Dunkley et al. (2011) at 220 and 150 GHz is recovered scaling down the cumulative flux function [see eq. (19)] of proto-spheroidal galaxies by a factor of 0.81, 0.71, and 0.55 at 353, 217, and 150 GHz (m, 1.38 mm, 2 mm), respectively. No correction was applied at higher frequencies. In practice, we use the determination of the shot noise amplitude to recalibrate the function to be used to compute the clustering power spectrum, which is measured independently. This correction mimics the effect of adopting a SED decreasing with increasing wavelength beyond the peak a bit more steeply than the one adopted by Lapi et al. (2011).
As suggested in the latter paper, the overestimate of mm-wave counts may be cured if higher- galaxies, that yield larger and larger contributions to the bright counts at increasing mm wavelengths, have SEDs slightly hotter than SMM J2135-0102 and closer to that of G15.141 (Cox et al. 2011; see Fig. 2 of Lapi et al. 2011). We have checked that indeed a good fit of the counts at all the frequencies considered here is obtained using the SMM J2135-0102 SED for galaxies at and the SED of G15.141 at higher z. However the match of the frequency spectrum of the shot-noise amplitude also improves but not enough to reach consistency with observational estimates at the longer wavelengths. Since the shot noise amplitude can be computed directly from the counts, this suggests that there may be some small, but non-negligible, offsets between the calibration of point source flux densities and that of the diffuse background. This is not surprising since, in addition to the possibility of an imperfect photometric calibration, at mm wavelengths the recovery of the contribution of dusty galaxies to the power spectrum requires a delicate subtraction of the other components (Cosmic Microwave Background, cirrus emission, fluctuations due to radio sources). A rescaling to match the shot noise spectrum seems to be the only practical way for correcting for these offsets. Since the modification is only significant at m (in the observer frame), i.e. well beyond the peak for most sources, the impact on the bolometric luminosity, which is related to the halo mass, is minor. For galaxies at redshifts up to , accounting for essentially all the signal, the bolometric luminosity varies by . For comparison, the coefficient of the relationship between the star formation rate (SFR; given by the model) and the bolometric luminosity has an uncertainty of (Kennicutt 1998).
The Granato et al. (2004) model is meant to take into account the star formation occurring within galactic dark-matter halos virialized at and bigger than , which are, crudely, associated to massive spheroidal galaxies. We envisage disk (and irregular) galaxies as associated primarily to halos virializing at , which have incorporated, through merging processes, a large fraction of halos less massive than virializing at earlier times, which may become the bulges of late type galaxies. The model, however, does not follow the formation and evolution of disk and bulge components of galaxies. For spiral and starburst galaxies we adopt the phenomenological model described by Negrello et al. (2007). On the other hand, as shown in the following, these galaxies are essentially non influential for the purposes of the present paper in the considered frequency range: proto-spheroids dominate the contributions both to the power spectrum of fluctuations and to the angular correlation function of detected sources.
Because of the strong dilution due to their very broad luminosity function, the contribution of radio sources to the clustering power spectrum can be safely neglected in the wavelength range considered here. Their contribution to Poisson fluctuations was computed using the De Zotti et al. (2005) model.
3 Halo Model Formalism
To compare the clustering properties expected from our model with observational data we adopt the halo model formalism (Cooray & Sheth 2002). The power spectrum of the galaxy distribution is parameterized as the sum of the 1-halo term, that dominates on small scales and depends on the distribution of galaxies within the same halo, and the 2-halo term, that dominates on large scales and is related to correlations among different halos:
| (1) | |||||
| (2) | |||||
| (3) |
where is the halo mass function (Sheth & Tormen 1999) and the linear matter power spectrum, , has been computed using the CAMB code111http://camb.info/ (Lewis, Challinor & Lasenby 2000). Here, denotes the Fourier transform of the mass density profile of the galaxy distribution within the dark matter halo, that we assume to be approximately the same as that of the dark matter, i.e. we take .
is the mean number of galaxies in a halo of mass , subdivided in “central” and “satellite” galaxies (), while is the mean number density of galaxies:
| (4) |
We model the HOD using a central-satellite formalism (see, e.g., Zheng et al. 2005): this assumes that the first galaxy to be hosted by a halo lies at its center, while any remaining galaxies are classified as satellites and are distributed in proportion to the halo mass profile. Following Tinker & Wetzel (2010), the mean occupation functions of central and satellite galaxies are parameterized as:
| (5) | |||||
| (6) |
where , , , and are free parameters assumed to be redshift independent. In this formalism halos below do not contain galaxies while halos above this threshold contain a central galaxy plus a number of satellite galaxies with a power-law mass function with slope .
The mean mass density profile of halos of mass is (Navarro, Frenk, & White 1996):
| (7) |
| (8) |
with . The normalized Fourier transform of this profile is:
| (9) | |||||
where and are the sine and cosine integrals, respectively:
| (10) |
Following Bullock et al. (2001), we approximate the dependence of the concentration on and as
| (11) |
where is the characteristic mass scale at which ; .
In the 1-halo term [eq. (2)] we set , in analogy with the corresponding term for the dark matter power spectrum, if . Otherwise we set since if the halo contains only one galaxy, it will sit at the center. Taking into account that and that only the galaxies that are not at the center get factors of we have:
| (12) | |||||
| (13) | |||||
with ,
| (14) |
and . On large scales, where the 2-halo term dominates, and with:
| (15) |
We also define the effective large-scale bias, , as
| (16) |
and the effective mass of the halo, ,
| (17) |
4 Angular Power Spectrum of Intensity Fluctuations
The angular power spectrum of intensity fluctuations due to clustering of sources fainter than some flux density limit is a projection of the spatial power spectrum of such sources at different redshifts , . In the Limber approximation, valid if the angular scale is not too large (i.e. ), the relation between and is:
| (18) |
where is the redshift distribution of the cumulative flux of sources with
| (19) |
is the epoch-dependent comoving luminosity function per unit interval of , and is the comoving volume element, , being the comoving radial distance:
| (20) |
Poisson fluctuations add a white noise contribution to the power spectrum of fluctuations:
| (21) |
with
| (22) |
We have computed the functions for each galaxy population using the the cosmological model specified in § 1 and the evolutionary models briefly described in § 2. As mentioned in § 2, the functions for proto-spheroidal galaxies at frequencies GHz (m) have been scaled down by constant factors to comply with the measurements or the best estimates of the shot-noise levels. At higher frequencies our model accurately fits the observed source counts and therefore provides directly reliable estimates of the shot noise level.
We have chosen to deal with the shot noise and the clustering contributions to the power spectrum of CIB fluctuations independently of each other because the former are independent of the parameters describing the clustering and are strongly constrained by the available source counts. Moreover, when only relatively low resolution data are available, as is the case for Planck, there is a degeneracy between the shot-noise and the 1-halo clustering term. As clearly highlighted by Planck Collaboration (2011), an unsupervised least-square fit of the full CIB power spectrum measured by Planck, taking the shot-noise amplitude as a free parameter, leads to fits of similar quality with and without a substantial contribution from the 1-halo term. But fits with a low contribution from the 1-halo term imply shot noise amplitudes far in excess of those estimated from the source counts. The higher resolution of Herschel, SPT and ACT data breaks the degeneracy at GHz and at GHz, respectively, allowing a direct estimate of the shot-noise amplitude.
As for the halo model, we have considered two distinct populations, i.e. proto-spheroidal galaxies and late-type galaxies, both quiescent and starbursting. Taking into account the constraints on clustering of late-type galaxies coming from IRAS data (Mann et al. 1995; Hawkins et al. 2001) we find that the contribution of these sources is always sub-dominant and, correspondingly, their halo model parameters are very poorly constrained. Moreover the values of and are poorly constrained also for proto-spheroidal galaxies (Planck Collaboration 2011). We have therefore fixed and [within the ranges found by Tinker & Wetzel (2010) from clustering studies of optical galaxies] for both populations, and and . We are then left with only 2 free parameters, i.e. and , for proto-spheroidal galaxies.
The angular power spectra of CIB anisotropies at 217, 353, 545, and 857 GHz on the multipole range have been determined by Planck Collaboration (2011) using Planck maps of six regions of low Galactic dust emission with a total area of . In the same paper, the power spectrum measurements by Amblard et al. (2011), using Herschel/SPIRE data at 250, 350, and m and extending down to sub-arcmin angular scales, i.e. up to , were re-analyzed. It was found that Amblard et al. (2011) overestimated the correction for contamination by Galactic cirrus. Moreover, the diffuse-emission calibration of SPIRE data was improved using the more accurate Planck/HFI calibration. We have used the Amblard et al. (2011) data as corrected by Planck Collaboration (2011) at 350 and m. No correction could be applied at m so that the data points at this wavelength could be underestimated.
Power spectrum measurements at mm wavelengths (around 150 and 220 GHz) have been obtained with the SPT and the ACT (Hall et al. 2010; Dunkley et al. 2011; Shirokoff et al. 2011; Das et al. 2011). The subtraction of the other components (CMB, Sunyaev-Zeldovich effect, radio sources) has been done using the best fit values given in the papers. Note that the units quoted as are actually sr. The conversion factor from these units to sr is . The factor is at 150 GHz and at 217 GHz.
The angular correlation function for a single source population writes, in terms of the 2D power spectrum :
| (23) |
where is the Bessel function of order 0.
Here we have two sub-populations, proto-spheroidal and spiralsstarburst galaxies, with different clustering properties. If their cross-correlations can be ignored the signal for the whole is given by (Wilman et al. 2003):
| (24) |
where and are the fractional contributions of proto-spheroidal and spiralsstarburst galaxies, respectively, to the total counts:
| (25) |
being the redshift distribution. Ignoring the cross-correlations between the two source populations is justified because of the widely different redshift distributions implied by the adopted evolutionary model: as mentioned in § 2, proto-spheroidal galaxies are associated to galactic-size halos virialized at while disk (and irregular/starburst) galaxies are associated primarily to halos virializing at .
The spatial correlation function is the Fourier anti-transform of the 3D power spectrum:
| (26) |
The clustering radius is defined by .
5 Results
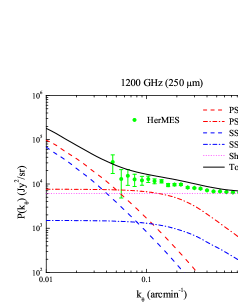
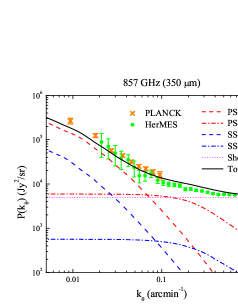
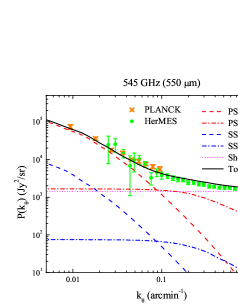
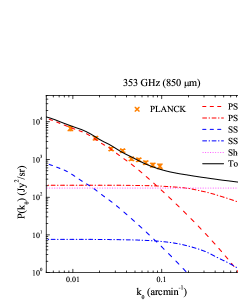
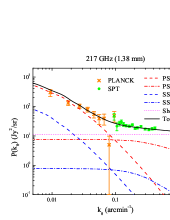
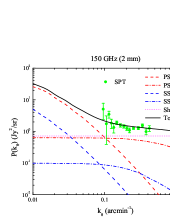
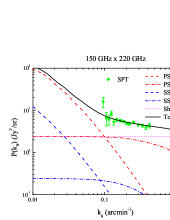
Figures 1 and 2 compare the best fit model power spectrum with Planck, Herschel, and SPT data in the wavelength range mmm. The agreement is generally good except at m where the model is consistently above the data points by Amblard et al. (2011) which, however, could be underestimated (see § 4). As mentioned above, we have only two free parameters, i.e. the minimum mass and the power-law index of the mean occupation function of satellite galaxies of proto-spheroidal galaxies. The constraints we obtain are and (). The nominal errors on each parameter have been computed marginalizing on the other and correspond to . We caution that the true uncertainties are likely substantially higher than the nominal values, both because the model relies on simplifying assumptions that may make it too rigid and because of possible systematics affecting the data.
The fact that the same values of these parameters account for the clustering data from 2 mm to m confirms the conclusion by Planck Collaboration (2011) that CIB fluctuations over this wavelength range are dominated by a single sub-population of dusty galaxies. According to our model, this sub-population is made of proto-spheroidal galaxies making most of their stars at . We find that only at m other dusty galaxy populations, normal disk and starburst galaxies, make a significant, but still sub-dominant contribution to the clustering power spectrum. As shown by Lapi et al. (2011), according to our model, proto-spheroidal galaxies also account for the bulk of the CIB intensity in this wavelength range, consistent with the finding by Planck Collaboration (2011) that the CIB anisotropies have the same frequency spectrum as the CIB intensity.
Our estimate of the minimum mass is higher than, but consistent, within the errors, with those found by Amblard et al. (2011) considering a single galaxy population and 5 free parameters per frequency (but one of the parameters is unconstrained by the data within the prior range): at m, at m, and at m. Our value of is also consistent with those by Amblard et al.: at m, at m and m. In Planck Collaboration (2011) two or three free parameters per frequency were used; the derived minimum masses are in the range .
There is however an interesting difference with Planck Collaboration (2011), due to the different redshift distributions of sources. The crossover between the 1-halo and the 2-halo term occurs, according to the model by Planck Collaboration (2011), at multipole numbers ranging from at 857 GHz (m) to at 217 GHz (mm) corresponding to angular scales ranging from at 857 GHz to at 217 GHz. According to the Béthermin et al. (2011) model used in that paper, the contribution to the CIB intensity at 857 GHz peaks at where the angular scale of corresponds to a physical linear scale Mpc; at 217 GHz the bulk of the CIB contribution comes from where an angular scale of corresponds to a physical linear scale Mpc. The non-linear masses corresponding to an overdensity on these scales are and , respectively. For comparison, the characteristic non-linear masses computed from ( being the rms overdensity) are and . This suggests that structures going non-linear on the considered scales are extremely rare at the corresponding redshifts. This potential difficulty is eased in our model because the crossover scales are lower by almost a factor of 2. As shown by Figs. 1 and 2, the 1-halo/2-halo crossover occurs at at 857 GHz and at at 217 GHz, corresponding to angular scales of and , respectively.
Our value of implies an effective halo mass [eq. (17)] at of proto-spheroidal galaxies, making up most of the CIB, , close to the estimated halo mass of the most effective star formers in the universe. Tacconi et al. (2008) estimated their mean comoving density at to be . For the standard CDM cosmology this implies that they are hosted by dark matter halos of (Dekel et al. 2009).
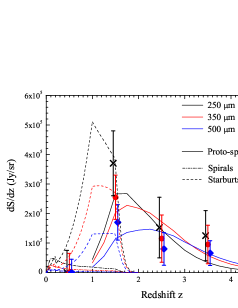
Figure 3 compares the flux density coming from different redshifts, [eq. (19)], predicted by the model at the SPIRE wavelengths with the best fit estimates by Amblard et al. (2011). Planck Collaboration (2011) give (their Table 7) the best fit values of the redshift-independent volume emissivity, , for [their eq. (43)]. The values of given by our model (52, 175, 265, and at 217, 353, 545, and 857 GHz, respectively) are consistent with the best-fit results.
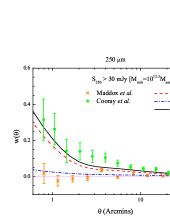
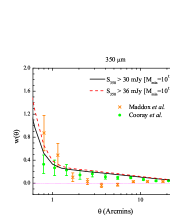
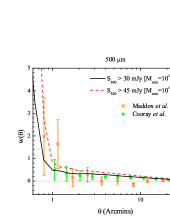
As for the angular correlation function, , of detected SPIRE galaxies, Cooray et al. (2010) reported measurements of for sources brighter than 30 mJy at all SPIRE wavelengths and inferred values of ranging from at m to at m. On the other hand, Maddox et al. (2010) did not detect a significant clustering for their m selected sample with a flux limit of , but detected strong clustering at m and m, albeit with relatively large uncertainties. Our model entails a relationship between the far-IR/sub-mm luminosity of proto-spheroidal galaxies (that provide the dominant contribution to , see the left-hand panel of Fig. 4) and the associated halo masses (Lapi et al. 2011). For the flux density limit adopted by Cooray et al. (2010), 30 mJy at all SPIRE wavelengths, the model yields , 13, and 13.2 at 250, 350, and m, respectively, while for the flux density limits of Maddox et al. (2010; 33, 36, and 45 mJy) we have , 13.1, and 13.4. The corresponding predictions for are compared with the data in Fig. 4. The agreement of the model with the data is generally good, although the situation at m is unclear since there is a discrepancy between the Cooray et al. (2010) and the Maddox et al. (2010) results.
6 Discussion and conclusions
According to the Granato et al. (2004) model, the steep portion of sub-mm counts is dominated by massive proto-spheroidal galaxies in the process of forming most of their stars on a timescale varying with halo mass (shorter for more massive galaxies), but typically of Gyr, i.e. with a duty cycle of at , where their redshift distribution peaks. As shown above, this model allows us to reproduce the power spectrum of CIB fluctuations over a broad frequency range, from m to a few mm, with only 2 free parameters. The model also yields an effective volume emissivity at different redshifts consistent with observational estimates. The derived effective halo mass, , is close to that estimated for the most efficient star-formers at .
The multipole number at which the 1-halo term starts exceeding the 2-halo contribution to the clustering power spectrum ranges from at 857 GHz to at 217 GHz. These values are almost a factor of 2 higher (and, consequently, the corresponding angular scales are almost a factor of 2 lower) than those found by Planck Collaboration (2011). Since, at the redshifts where the contribution to the CIB intensity peaks, the corresponding masses are well above , this difference translates into a much larger abundance of the relevant halos.
Alternative models make quite different predictions for the clustering properties of sub-mm galaxies. A widespread view is that these objects are powered by major merger events. Two major theories have been worked out in this general framework. One view is that sub-mm galaxies are massive objects, seen during a short-duration, intense, merger-induced burst of star formation (e.g. Narayanan et al. 2009). Since massive galaxies are rare at high- and, because of the short duration of the burst, only a small fraction of them are in the sub-mm bright phase at a given time, this scenario has difficulty in reproducing the observed counts. This difficulty may be overcome assuming an extremely top-heavy initial stellar mass function that would allow much less massive (hence far more abundant) galaxies to reach the required luminosities (e.g. Baugh et al. 2005; Lacey et al. 2010).
The clustering implied by the latter scenario has been investigated by Almeida et al. (2011) who found, at , a comoving correlation length of Mpc for galaxies with m flux densities brighter than 5 mJy or an effective bias factor ; for galaxies with mJy they found . Our model implies for sources with mJy and for sources with mJy. The corresponding values of the clustering radius and of the effective bias factor are Mpc, at m, and Mpc, at m. The study by Kim et al. (2011) confirms that the clustering data require a higher amplitude of the 2-halo term, i.e. more massive halos than implied by the major mergers plus top-heavy initial stellar mass function scenario.
Davé et al. (2010) investigated the clustering properties of rapidly star-forming galaxies at in the framework of a very different scenario based on cosmological hydrodynamic simulations whereby the star formation is not powered by mergers but by steady gas accretion and cooling that can fuel the star formation for several Gyrs. In this scenario typical sub-mm galaxies at live in massive () halos and have a duty cycle . They are expected to be strongly clustered, with a clustering radius Mpc and a bias factor of . These values are well in excess of those following from our analysis which yields, for the bulk of galaxies at , Mpc, .
These results illustrate the power of accurate measurements of the CIB power spectrum and of the correlation function of galaxies at (sub-)millimeter wavelengths to discriminate among competing evolutionary models for the population of dusty galaxies.
Acknowledgments
Thanks are due to G. Lagache for clarifications on the CIB power spectra derived from Planck data and to the referee for a careful reading of the manuscript and useful comments. Our numerical analysis was performed on the Deepcomp 7000 system of the Supercomputing Center of Chinese Academy of Sciences. We acknowledge financial support from ASI (ASI/INAF Agreement I/072/09/0 for the Planck LFI activity of Phase E2) and MIUR PRIN 2009. MV is supported by ASI/AAE, PD-INFN 51, PRIN INAF and the FP7 cosmoIGM grants.
References
- [\citeauthoryearAddison et al.2011] Addison G. E., et al., 2011, arXiv:1108.4614
- [\citeauthoryearAlmeida, Baugh, & Lacey2011] Almeida C., Baugh C. M., Lacey C. G., 2011, MNRAS, 417, 2057
- [\citeauthoryearAmblard et al.2011] Amblard A., et al., 2011, Natur, 470, 510
- [\citeauthoryearBaugh et al.2005] Baugh C. M., Lacey C. G., Frenk C. S., Granato G. L., Silva L., Bressan A., Benson A. J., Cole S., 2005, MNRAS, 356, 1191
- [\citeauthoryearBlain et al.2004] Blain A. W., Chapman S. C., Smail I., Ivison R., 2004, ApJ, 611, 725
- [\citeauthoryearBullock et al.2001] Bullock J. S., Kolatt T. S., Sigad Y., Somerville R. S., Kravtsov A. V., Klypin A. A., Primack J. R., Dekel A., 2001, MNRAS, 321, 559
- [\citeauthoryearCooray & Sheth2002] Cooray A., Sheth R., 2002, PhR, 372, 1
- [\citeauthoryearCooray et al.2010] Cooray A., et al., 2010, A&A, 518, L22
- [\citeauthoryearCox et al.2011] Cox P., et al., 2011, ApJ, 740, 63
- [\citeauthoryearDas et al.2011] Das S., et al., 2011, ApJ, 729, 62
- [\citeauthoryearDavé et al.2010] Davé R., Finlator K., Oppenheimer B. D., Fardal M., Katz N., Kereš D., Weinberg D. H., 2010, MNRAS, 404, 1355
- [\citeauthoryearDekel, Sari, & Ceverino2009] Dekel A., Sari R., Ceverino D., 2009, ApJ, 703, 785
- [\citeauthoryearde Zotti et al.2005] de Zotti G., Ricci R., Mesa D., Silva L., Mazzotta P., Toffolatti L., González-Nuevo J., 2005, A&A, 431, 893
- [\citeauthoryearDunkley et al.2011] Dunkley J., et al., 2011, ApJ, 739, 52
- [\citeauthoryearEales et al.2010] Eales S., et al., 2010, PASP, 122, 499
- [\citeauthoryearGranato et al.2004] Granato G. L., De Zotti G., Silva L., Bressan A., Danese L., 2004, ApJ, 600, 580
- [\citeauthoryearGranato et al.2001] Granato G. L., Silva L., Monaco P., Panuzzo P., Salucci P., De Zotti G., Danese L., 2001, MNRAS, 324, 757
- [\citeauthoryearHall et al.2010] Hall N. R., et al., 2010, ApJ, 718, 632
- [\citeauthoryearHawkins et al.2001] Hawkins E., Maddox S., Branchini E., Saunders W., 2001, MNRAS, 325, 589
- [\citeauthoryearIvison et al.2010] Ivison R. J., et al., 2010, A&A, 518, L35
- [\citeauthoryearKennicutt1998] Kennicutt R. C., Jr., 1998, ARA&A, 36, 189
- [\citeauthoryearKim et al.2011] Kim H.-S., Lacey C. G., Cole S., Baugh C. M., Frenk C. S., Efstathiou G., 2011, arXiv, arXiv:1111.0721
- [\citeauthoryearKitayama & Suto1996] Kitayama T., Suto Y., 1996, ApJ, 469, 480
- [\citeauthoryearLacey et al.2010] Lacey C. G., Baugh C. M., Frenk C. S., Benson A. J., Orsi A., Silva L., Granato G. L., Bressan A., 2010, MNRAS, 405, 2
- [\citeauthoryearLapi et al.2006] Lapi A., Shankar F., Mao J., Granato G. L., Silva L., De Zotti G., Danese L., 2006, ApJ, 650, 42
- [\citeauthoryearLapi et al.2011] Lapi A., et al., 2011, ApJ, 742, 24
- [] Lapi A., Cavaliere A., 2011, ApJ, 743, 127
- [\citeauthoryearLewis, Challinor & Lasenby2000] Lewis A., Challinor A., Lasenby A., 2000, PRD, 538, 473
- [\citeauthoryearMaddox et al.2010] Maddox S. J., et al., 2010, A&A, 518, L11
- [\citeauthoryearMann, Saunders, & Taylor1995] Mann B., Saunders W., Taylor A., 1995, astro, arXiv:astro-ph/9511028
- [\citeauthoryearMao et al.2007] Mao J., Lapi A., Granato G. L., de Zotti G., Danese L., 2007, ApJ, 667, 655
- [\citeauthoryearMillea et al.2011] Millea M., Doré O., Dudley J., Holder G., Knox L., Shaw L., Song Y.-S., Zahn O., 2011, arXiv:1102.5195
- [\citeauthoryearNarayanan et al.2009] Narayanan D., Cox T. J., Hayward C. C., Younger J. D., Hernquist L., 2009, MNRAS, 400, 1919
- [\citeauthoryearNarayanan et al.2010] Narayanan D., et al., 2010, MNRAS, 407, 1701
- [\citeauthoryearNavarro, Frenk, & White1996] Navarro J. F., Frenk C. S., White S. D. M., 1996, ApJ, 462, 563
- [\citeauthoryearNegrello et al.2007] Negrello M., Perrotta F., González-Nuevo J., Silva L., de Zotti G., Granato G. L., Baccigalupi C., Danese L., 2007, MNRAS, 377, 1557
- [\citeauthoryearPénin et al.2011] Pénin A., Doré O., Lagache G., Béthermin M., 2011, arXiv:1110.0395
- [\citeauthoryearPlanck Collaboration et al.2011] Planck Collaboration, 2011, A&A, 536, A18
- [\citeauthoryearRenzini2006] Renzini A., 2006, ARA&A, 44, 141
- [\citeauthoryearScott, Dunlop, & Serjeant2006] Scott S. E., Dunlop J. S., Serjeant S., 2006, MNRAS, 370, 1057
- [\citeauthoryearShang et al.2011] Shang C., Haiman Z., Knox L., Oh S. P., 2011, arXiv:1109.1522
- [\citeauthoryearSheth & Tormen1999] Sheth R. K., Tormen G., 1999, MNRAS, 308, 119
- [\citeauthoryearShirokoff et al.2011] Shirokoff E., et al., 2011, ApJ, 736, 61
- [\citeauthoryearSwinbank et al.2010] Swinbank A. M., et al., 2010, Natur, 464, 733
- [\citeauthoryearTacconi et al.2008] Tacconi L. J., et al., 2008, ApJ, 680, 246
- [\citeauthoryearTinker & Wetzel2010] Tinker J. L., Wetzel A. R., 2010, ApJ, 719, 88
- [\citeauthoryearViero et al.2009] Viero M. P., et al., 2009, ApJ, 707, 1766
- [] Wang J., et al., 2011, MNRAS, 413, 1373
- [\citeauthoryearWeinberg & Kamionkowski2003] Weinberg N. N., Kamionkowski M., 2003, MNRAS, 341, 251
- [\citeauthoryearWilman et al.2003] Wilman R. J., Röttgering H. J. A., Overzier R. A., Jarvis M. J., 2003, MNRAS, 339, 695
- [\citeauthoryearZhao et al.2003] Zhao D. H., Mo H. J., Jing Y. P., Börner G., 2003, MNRAS, 339, 12
- [\citeauthoryearZheng et al.2005] Zheng Z., et al., 2005, ApJ, 633, 791