Monte Carlo computer simulations and electron microscopy of colloidal cluster formation via emulsion droplet evaporation
Abstract
We consider a theoretical model for a binary mixture of colloidal particles and spherical emulsion droplets. The hard sphere colloids interact via additional short-ranged attraction and long-ranged repulsion. The droplet-colloid interaction is an attractive well at the droplet surface, which induces the Pickering effect. The droplet-droplet interaction is a hard-core interaction. The droplets shrink in time, which models the evaporation of the dispersed (oil) phase, and we use Monte Carlo simulations for the dynamics. In the experiments, polystyrene particles were assembled using toluene droplets as templates. The arrangement of the particles on the surface of the droplets was analyzed with cryogenic field emission scanning electron microscopy. Before evaporation of the oil, the particle distribution on the droplet surface was found to be disordered in experiments, and the simulations reproduce this effect. After complete evaporation, ordered colloidal clusters are formed that are stable against thermal fluctuations. Both in the simulations and with field emission scanning electron microscopy, we find stable packings that range from doublets, triplets, and tetrahedra to complex polyhedra of colloids. The simulated cluster structures and size distribution agree well with the experimental results. We also simulate hierarchical assembly in a mixture of tetrahedral clusters and droplets, and find supercluster structures with morphologies that are more complex than those of clusters of single particles.
pacs:
61.46.Bc,61.20.Ja,68.37.-dI Introduction
Systems of colloidal particles that interact with pair potentials that feature short-ranged attraction have been extensively studied in the literature. The typical bulk phase diagram shows a characteristic gas-liquid phase transition that can become metastable with respect to freezing for sufficiently short range of attraction Lekkerkerker et al. (1992); Ilett et al. (1994); Schmidt et al. (2000); Dijkstra, Brader, and Evans (1999). While the addition of a short-ranged soft repulsion is known to change the phase diagram Fortini, Dijkstra, and Tuinier (2005); Pini, Parola, and Reatto (2006) only quantitatively, a repulsion with a range larger than that of the attraction can have a dramatic effect on the topology of the phase diagram de Candia et al. (2006). Moreover, both in experiments and in dynamical simulations the equilibrium phase diagram for systems with competing interactions is often overshadowed by non-equilibrium phenomena such as vitrification, gelation and cluster formation Sciortino, Tartaglia, and Zaccarelli (2005); Mossa et al. (2004); Campbell et al. (2005); Coniglio et al. (2006); Archer and Wilding (2007). Typically, pair potentials with a short-ranged attraction show spontaneous clustering of particles at sufficiently low temperatures. The geometric structure of clusters of particles has been studied theoretically, e.g. for the Lennard-Jones potential Hoare and Pal (1971); Taffs, Malins, and Williams (2010), hard spheres Sloane et al. (1995), and hard spheres that additionally interact with a short-ranged attraction Arkus, Manoharan, and Brenner (2009). The structures obtained using the Morse potential were analyzed by Doye, Wales, and Berry (1995) and by Taffs et al. (2010) and compared to those from the Asakura-Oosawa potential Asakura and Oosawa (1954); Vrij (1976). Stable clusters of colloids are interesting because they can be viewed as colloidal molecules van Blaaderen (2003); Duguet et al. (2011) that can potentially be used as building blocks for the fabrication of novel materials. The size and geometric structure of colloidal clusters, however, are not easily controllable in experiments. Several different methods that offer control of the clustering process have been proposed. Jiang and Granick (2007) prepared clusters using Janus colloidal particles, i.e. spherical particles that possess oppositely charged hemispheres. Cluster of particles with larger numbers of patches have also been studied Zhang and Glotzer (2004); Wilber et al. (2007); Wilber, Doye, and Louis (2009). Erb et al. (2009) succeeded in preparing clusters of magnetic particles.
One particularly promising approach, based on the evaporation of the dispersed phase in an emulsion, was developed Velev and Nagayama (1997) by Velev, Furusawa, and Nagayama (1996a, b). Here colloidal particles adsorb at the interface between dispersed and continuous phase in order to minimize the interfacial free energy (Pickering effect) Binks and Horozov (2006). During evaporation the particles are pushed together by capillary forces and subsequently held together by van der Waals interactions. Manoharan, Elsesser, and Pine (2003) prepared micron-sized clusters using this technique with polystyrene microspheres that were 844 nm in diameter. The authors found clusters of particles with packings that minimize the second moment of the mass distribution. The emulsion method is versatile and was subsequently used to obtain clusters of particles 220 nm in diameter Cho et al. (2005a), of patchy particles Cho et al. (2007a); Kim et al. (2008), and of bidisperse colloids Cho et al. (2005b). Shear was used by Zerrouki et al. (2006) to produce monodispersed droplets. A similar technique is based on aerosol droplets Cho et al. (2007b) instead of oil droplets.
Similar in spirit to the emulsion evaporation technique, an alternative miniemulsion technique Wagner, Lu, and Wittemann (2008); Wagner et al. (2010) was recently developed. Here, a miniemulsion is prepared from a standard emulsion by ultrasonication. The sound waves produce an emulsion of small droplets in a process of fission and fusion [65]. The average size of the droplets can be tuned in the range of 360 nm to 1800 nm Landfester (2000). Small colloidal particles can then be used in solution with the small monodispersed droplets of the miniemulsion to obtain clusters Wagner et al. (2010) that have diameters much smaller than 1 . Although these clusters can consist of many constituent colloidal spheres, they remain small enough to reside in the colloidal domain Hoffmann et al. (2009), i.e. Brownian motion thermalizes such systems. Therefore hierarchical self-assembly comes within reach.
In contrast to the large body of experimental work and the closely related theoretical efforts to understand the resulting cluster structures and their symmetries, little theoretical work has been done to describe the process of cluster formation. Roman, Schmidt, and Löwen (2000) proposed a model for a dispersion of hard spheres and emulsion droplets, but these authors did not investigate cluster formation. Lauga and Brenner (2004) modeled and simulated the evaporation-driven assembly of colloidal particles. They considered individual droplets with varying numbers of adsorbed particles and calculated the (non-spherical, in general) shape of the oil-water interface by the requirement of minimal surface free energy. They considered different values of the contact angle and reported good agreement with experimental findings. Very recently, Mani et al. (2010) studied the stability of larger colloidosome-like shells of particles, albeit without modeling the assembly process.
In this paper we present a basic model to describe the process of cluster assembly through emulsion droplet evaporation. We use Monte Carlo computer simulations to study the cluster formation of colloids with competing short-ranged attraction and long-ranged repulsion interactions. Differently from Lauga and Brenner (2004) we also simulate the dynamical capture of the colloidal particles onto droplet surfaces and studied not only the cluster structures, but also analyzes the histograms of the cluster size distribution. We complement these calculations with experiments of polystyrene particles in an oil-in-water emulsion. We use cryogenic field emission scanning electron microscopy (cryo-FESEM) and field emission scanning electron microscopy (FESEM) to investigate the intermediate and final stages of cluster formation, respectively. The cryo-FESEM micrographs show the distribution of small particles on a droplet surface. We find the simulation results to be in good agreement with the experimental results for both intermediate and final cluster structures. We also find good quantitative agreement between experimental and simulation results for the cluster size distribution. Having demonstrated the validity of our model, we study the possibility of hierarchical self-assembly, by carrying out simulations of a mixture of thermal tetrahedral clusters and emulsion droplets. We obtain clusters of clusters (superclusters) with structures that differ from the clusters made of single particles.
The paper is organized as follows. In Sec. II.1 we give the details of the pair interactions. In Sec. II.2 and II.3 we present simulation and experimental details, respectively. In Sec. III.1, we describe the results for the dynamics of cluster formation. In Sec. III.2, we show the results for the cluster structures and for the histograms of the size distributions. In Sec. III.3, we present the results for the superclusters. Final remarks and conclusions are given in Sec. IV.
II Model and Methods
II.1 Definition of the pair interactions
We study a binary mixture of colloidal particles with hard-sphere diameter and droplets of diameter . The total interaction energy is the sum of colloid-colloid, droplet-droplet and colloid-droplet interactions,
| (1) | |||||
where is the center-of-mass position of colloid , is the center-of-mass position of droplet , is the colloid-colloid pair interaction, is the colloid-droplet pair interaction, and is the droplet-droplet pair interaction.
We consider two different types of colloid-colloid interactions. The first is the sum of the short-ranged attractive Asakura-Oosawa potential and the long-ranged repulsive Yukawa potential , i.e.
| (2) |
with , where is the Boltzmann constant and the temperature. Here the Yukawa potential is defined by
| (3) |
and the Asakura-Oosawa potential Asakura and Oosawa (1954); Vrij (1976) is
| (4) |
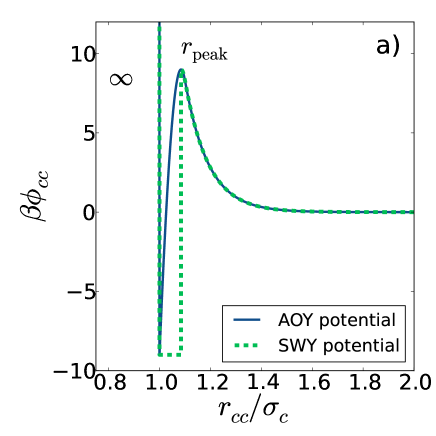
with . The parameter controls the strength of attraction, while controls the strength of the repulsion. The range of the interactions are controlled by the parameter for the AO potential and by for the Yukawa interaction. We refer to the combined interaction (2) as the Asakura-Oosawa-Yukawa (AOY) potential. Although both the AO and Yukawa potentials have very specific physical interpretations, we use them in this paper merely as generic models for a steep short-range attraction and a long-range repulsion, respectively. The AO potential describes the depletion attraction between colloidal particles due to the presence of non-adsorbing polymers with radius of gyration . In the limit of small Eq.(4) is exact and is related to the free volume gained by the polymers when two colloids are close to each other Dijkstra, Brader, and Evans (1999). The Yukawa potential describes the interaction between two charged particles screened by a medium with inverse Debye length . As shown in Fig. 1a), for a typical set of parameters (justified below) that we used in the simulations, the potential defined by Eq. (2) has a maximum at distance . In order to investigate the influence of the shape of the attractive part of the potential we also consider a modified version of (2) using a square well potential for distances smaller than . This is
| (5) |
which we refer to as the Square-Well-Yukawa (SWY) potential. It is shown in Fig. 1 with a dashed line. This potential is very similar to that used by Mani et al. (2010) in their pioneering study of the stability of colloidal shells. The parameter space of the interaction is arbitrarily restricted to potentials with the shape shown in Fig. 1, i.e. with , and hence . The height of the repulsive barrier, , is half the depth of the attractive well, .
The droplet-droplet interaction is taken to be hard-core repulsion
| (6) |
with an effective hard-core diameter that is larger than the bare droplet diameter . Using the effective diameter ensures that the surface-surface distance between any two droplets is always larger than one colloid diameter. In this way two droplets can never bind together due to a shared colloid.
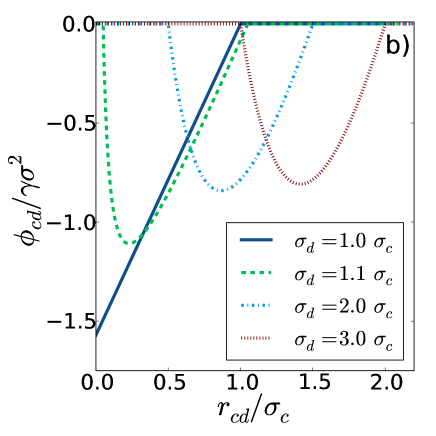
The colloid-droplet interaction is aimed at modeling the Pickering effect. The loss of interfacial energy Pieranski (1980) when a particle is trapped at the surface of the droplet is , with the droplet surface that is covered by the colloid, and the droplet-solvent interfacial tension. The relation is valid when the interfacial tension between the colloid and the droplet is the same as that between the colloid and the solvent. The surface has different expressions depending on the size of the droplet and the colloid-droplet separation. If the diameter of the droplets is larger than the diameter of the colloidal particles, i.e. for , the colloid-droplet energy is
| (7) |
with the height of the spherical cap that results from the colloid-droplet intersection. On the other hand, when the diameter of the droplets is smaller than the diameter of the colloidal particles, i.e. , we assume
| (8) |
Within this model we neglect the influence of the particle on the oil-water interfacial curvature. The contact angle changes upon changing the position of the particle with respect to the oil-water interface, while in reality the contact angle remains constant and the curvature of the oil-water interface changes, such that the droplet becomes non-spherical, which is beyond our model.
II.2 Simulation method
In our model we neglect the coalescence of the droplets and the hydrodynamic interactions due to the solvent. Even with these simplifications, the relevant time scale is not easily reachable in standard Brownian Dynamics (BD) simulations. Hence, we carry out Metropolis Monte Carlo (MC) simulations, that for small displacement steps can reproduce the correct dynamics Sanz and Marenduzzo (2010) and are much more efficient to run than BD simulations. The evolution of the system is therefore described by the number of MC sweeps per particle. For the colloidal particles Sanz and Marenduzzo (2010) the MC maximum trial displacement is set to .
We define a bond between two colloidal particles when their distance is smaller than . A cluster is defined as a set of colloidal particles connected by a network of bonds. The translational diffusion of the clusters is achieved by translational MC cluster moves Wu, Chandler, and Smit (1992) with maximum linear displacement with the number of particles in the cluster. This approximates the hydrodynamic slowing down of a spherical cluster that satisfies the Stokes-Einstein equation for the diffusion constant , with the viscosity of the solvent and the diameter of the sphere that approximate the shape of the cluster. Here, we assume that . Additionally, we mimic the cluster rotational diffusion via rotational MC moves, in which clusters are rotated around a random axis with a maximum angle . In a cluster move Wu, Chandler, and Smit (1992); Frenkel and Smit (2002), all particles belonging to a cluster are translated or rotated by the same amount. In order to satisfy the condition of detailed balance all cluster moves that lead to two clusters merging or a cluster and a single particle merging are rejected.
The droplets move according to the MC scheme with a maximum displacement . The evaporation dynamics is introduced by forcing the droplets diameter to shrink at a fixed rate. The rate is chosen so that the droplets vanish half-way though the simulation ( sweeps). This leaves another sweeps to investigate the stability of the clusters against thermal fluctuations. Here the timescales are chosen for practical reasons. In the experiments stability can be relevant on the time scales of years, while the clusters experiments last typically tens of minutes. Hence, our simulation do not address the true long-time behavior of the system.
We restrict ourselves to symmetric potentials with . In particular, we investigate the case as shown in Fig. 1 (, and ). The height of the repulsive barrier is , a value big enough to hinder spontaneous clustering, while the depth of the attractive well is , so that in practice a particle cannot escape by thermal fluctuations. For these parameters we find that the maximum of the potential is at . For each parameter set we run eight independent MC simulations with colloidal particles with packing fraction , and 0.01. The droplets packing fraction is fixed at . Simulations have been performed for initial droplet sizes , and . Each simulation consisted of MC sweeps. In every sweep all particles are attempted to be moved on average once. The droplets and the particles are initialized randomly in the cubic simulation box, with the constraints that all colloids are outside of the droplets and that the minimum distance between colloidal particles is larger than . Hence, we start in a state without clusters. We characterize the cluster structure by the bond-number , corresponding to the number of pairwise bonds in a cluster. The number of bonds is also an estimate of the total energy of the cluster; a higher number of bonds corresponds to a greater attractive energy.
II.3 Experimental methods
II.3.1 Cluster preparation
The colloidal particles are positively charged and narrowly dispersed polystyrene spheres with 154 nm diameter. A detailed description of the preparation of the constituent particles and their assembly into clusters is given in Ref. Wagner, Lu, and Wittemann (2008). In particular, in these experiments, the particles were added both via the water and via the oil phase. For the present studies the clusters were prepared in a slightly modified fashion. Briefly, 53 mg polystyrene particles suspended in 3 ml of toluene and 73 l dodecane (to suppress Ostwald ripening) were emulsified with 27 ml of an aqueous solution of Pluronic® F-68 (1 wt.%) using an ultrasonic homogenizer (Sonoplus HD 3200, Bandelin). Evaporation of the dispersed toluene phase under reduced pressure (50 mbar, 40 ∘C) initiated the assembly of the particles into clusters.
II.3.2 Electron microscopy of droplet and assembly morphology
The emulsion droplets bearing polystyrene particles at their surface were examined on a cryogenic field emission scanning electron microscope (Ultra Plus, Zeiss). Specimen preparation was accomplished by sandwiching 4 l of the emulsion in between two aluminum platelets (3 mm x 0.5 mm, 0.15/0.15 mm, Engineering Office M. Wohlwend). The carrier assembly was plunged into a high-pressure-freezing machine (EM HPM100, Leica) and was vitrified at 2000 bar within 20 ms. This helped sealing the sandwich so that nucleation of ice crystals and specimen damage were suppressed. In a cryo preparation chamber (EM MED020 FF, Leica) the sample was freeze-fractured, lightly etched for 60 s at C, and sputtered with platinum in an amount equivalent to a 4 nm thick coating. The specimen was transferred by a cryo shuttle (EM VCT 100, Leica) to the cold stage of the microscope. Micrographs were recorded digitally at a temperature of C, with an aperture of 10 m and a voltage of 1.0 kV. The morphologies of the colloidal assemblies were analyzed by field emission scanning electron microscopy (FESEM) on a Zeiss LEO 1530 Gemini microscope equipped with a field emission cathode operating at 3 kV. A minute amount of the cluster suspension (10-5 wt.%) was placed onto a silicon wafer (CrysTec) and dried under ambient conditions. The specimen was coated with a platinum layer of 1.3 nm thickness using a sputter coater (Cressington 208HR) to make the specimen conductive.
III Results
III.1 Dynamics of cluster formation
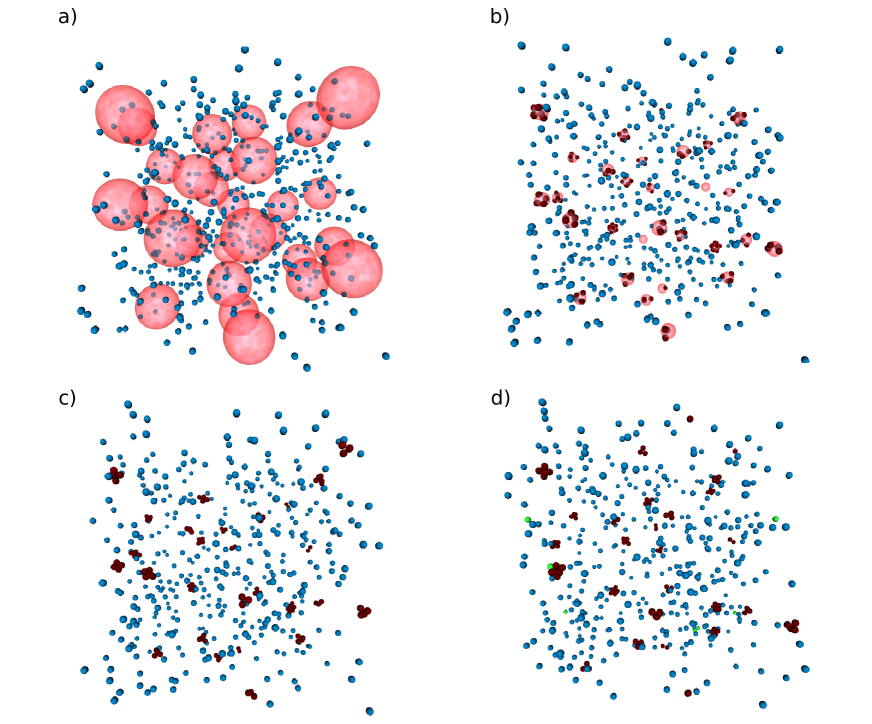
Figure 2 shows simulation snapshots at four different stages of the simulation. The initial configuration of the simulation (Fig. 2a) is a binary mixture of non-overlapping spheres. The large (pink) spheres represent the droplets, while the small (blue) spheres represent single colloidal particles. After MC sweeps (Fig. 2b) particles are trapped at the surface of a droplet (red). Figure 2c) shows the configuration after sweeps, just after the droplets have vanished completely. Figure 2d) shows the configuration at the end of the simulation after sweeps. All clusters that are formed formed due to the droplets are still present in the system demonstrating the stability of the clusters against thermal fluctuations. Few doublets (green) have also formed spontaneously. See also a movie of the simulation here. As a check we simulated the structure of the pure colloidal fluid without droplets. We find that the structure of the single component fluid is largely composed of single particles with only 1% of particles belonging to doublets. Larger clusters are not formed during the span of our simulations. This can be explained easily by the following argument. The minimum distance between colloidal particles is at the beginning of the simulation larger than . In order to form a bond, the colloidal particles have to overcome the repulsive energy barrier () of the colloid-colloid interaction. The probability to thermally overcome this barrier is very small, and in order to form larger clusters the particles have to be forced beyond the repulsive barrier. Hence, in the restricted time interval that is accessible in the simulations, the colloidal fluid is (quasi-)stable. However, for longer times further clustering might occur (see discussion in the Sec. II.2).
In the binary mixture, a clustering mechanism is provided by the shrinking droplets.
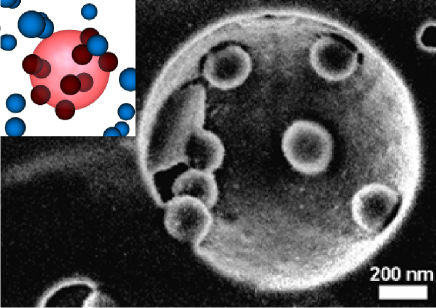
The formation of small clusters implies that only a limited number of particles are bound onto the droplets. The small size of our particle makes them ideal for the self-assembly of small clusters that are well suited as building blocks for subsequent self-assembly, but prevented us to follow the assembly process in experiments in real space like Manoharan, Elsesser, and Pine (2003). Therefore, we studied their distribution in the experimental emulsions with cryo-FESEM. The micrographs (Fig. 3) indicate a random distribution of the positions of the particles at the droplet surface. The void in the center presents the imprint of the frozen dispersed phase, i.e. a single micron-sized toluene droplet. The polystyrene particles left in the cavity after sublimation of toluene are randomly distributed at the former droplet surface. Because toluene is a good solvent for polystyrene, the particles are significantly swollen at the droplet interface as expressed by a larger diameter. This agrees with the fact that the micrograph indicates that the polystyrene particles prefer the dispersed toluene phase. The position distribution of the particles on the droplet surface in simulations (Fig. 2b and inset Fig. 3) is in good agreement with the experiment and indicates that the particles can freely diffuse on the surface of the droplets.
In simulations, we consider the case that the particle surface has no preference of whether it wets oil or water. Hence the contact angle at a (planar) oil-water interface is 90∘ because of the assumption that the colloid-solvent interfacial tension is equal to the colloid-droplet interfacial tension – see the discussion above Eq.(7) . Despite the difference in contact angle between simulation and experiments we do not expect the contact angle to affect the final results Lauga and Brenner (2004).
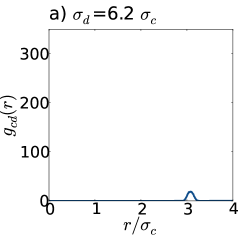
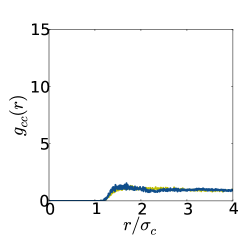
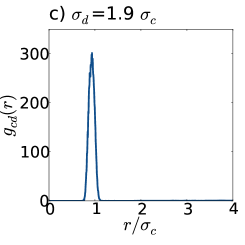
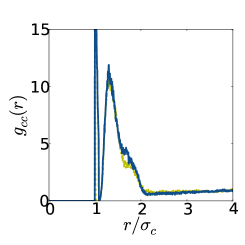
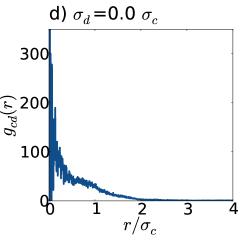
The liquid structure can be further characterized in computer simulations. We calculated the colloid-droplet radial distribution functions, , and the colloid-colloid radial distribution functions, , at different stages of the simulations. Since the droplet diameter changes continuously during the simulation the resulting transient structures captured by the distribution functions are not at equilibrium.
 |
 |
 |
 |
 |
 |
 |
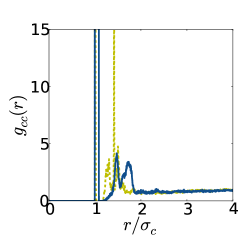 |
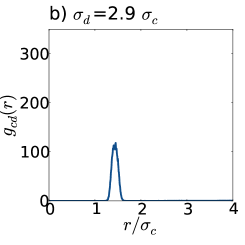
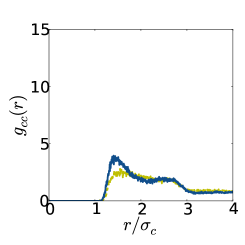
Fig. 4 shows and at different stages. For the colloid-colloid correlation function we plot both the results of the SWY (blue full line) and AOY potentials (yellow dashed line). In particular, Fig. 4a) shows the correlation functions after MC sweeps. The colloid-droplet radial distribution function has a small peak at corresponding to the instantaneous droplet radius . The peak is due to colloidal particles trapped at the droplet surface. At the same time the colloid-colloid radial distribution functions are apparently flat outside of the core region. In fact, the radial distribution function is decaying in a way consistent with the Boltzmann factor as expected for an equilibrium low density gas. Figure 4b) shows the correlation functions after MC sweeps. The cross pair correlation function shows that the droplets have shrunk to a radius , while has developed structure at intermediate distances. These results can be explained by particles trapped at the surface of the droplets and interacting with each other via the long-ranged colloid-colloid repulsion. After MC sweeps (Fig. 4c) the droplet radius has become smaller than . The strong peak at indicates that a large number of bonds between colloidal particles have formed for both the AOY and SWY potentials. Finally, after MC sweeps (Fig. 4d) a dramatic change of is observed, which is due to droplets having a diameter , and diffusing freely. We show the left panel of Fig. 4d) for completeness, but stress that it does not correspond to any physical situation. On the other hand, shows that strong peaks have formed also at distances larger than , indicating the presence of small clusters. The time evolution of for the two potentials is very similar. Most notably the final configurations differ due to different final cluster structures.
III.2 Cluster structure and size distribution
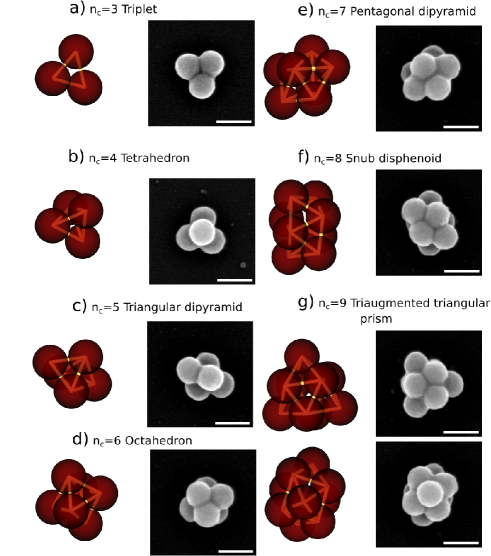
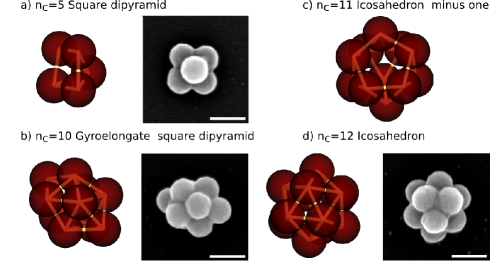
An overview of the different cluster structures found at the end of the simulation runs and in the experiment is presented in Figs. 5 and 6. In particular, Fig. 5 shows the simulation structures obtained at colloid packing fraction for the SWY potential and . We find clusters with sizes between (doublets not shown) and , with the number of particles belonging to a cluster.
In particular, we find that for the clusters have the same structures as Lennard-Jones clusters Hoare and Pal (1971). We find triplets for (Fig. 5a), tetrahedra for (Fig. 5b), triangular dipyramids for (Fig. 5c), octahedrons for (Fig. 5d), and pentagonal dipyramids for (Fig. 5e). For large number of particles we find the snub disphenoid for (Fig. 5f) and triaugmented triangular prism for (Fig. 5g, with two different orientations). In computer simulations clusters with particle numbers are obtained at higher packing fractions. The additional structures obtained at colloid packing fraction are shown in Fig. 6. The square dipyramid is found for (Fig. 5a) Also, for the clusters with ( gyroelongated square dipyramid in Fig. 6b) and (icosahedron in Fig. 6d) we find good agreement with experiments. The cluster with (icosahedron minus one, Fig. 6c) was, on the other hand, not found in experiments. As this structure is identical to the icosahedron except for one missing particle, it can easily be missed in the experimental FESEM micrographs.
These structures are also in good agreement with those observed in previous experiments Manoharan, Elsesser, and Pine (2003); Wagner et al. (2010). As noted by Manoharan, Elsesser, and Pine (2003), clusters containing (snub disphenoid), (triaugmented triangular prism) and (gyroelongated square dipyramid) particles are members of a set of convex polyhedra Johnson (1966).
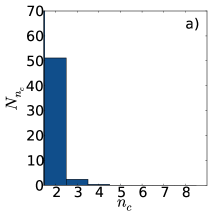
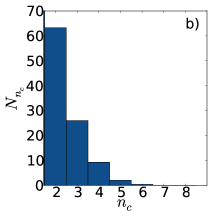
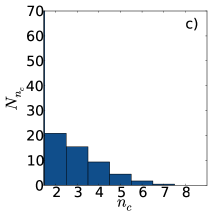
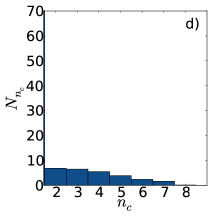
Larger cluster structures can be obtained not only by increasing the colloid packing fraction but also by increasing the starting droplet size, as demonstrated by the histograms of the number of clusters , with the number of colloidal particles forming the cluster. Figure 7 shows the cluster distribution for varying starting droplet sizes . From Fig. 7a) to Fig. 7d) the distribution becomes broader for larger droplet diameters , while at the same time the yield of smaller clusters decreases. The presence of a greater number of large clusters at larger droplet diameters can be explained by the larger surface available to capture colloidal particles in the initial stages of the simulation. Likewise, the probability to capture a small number of colloidal particles decreases with increasing droplet surface, which leads to a decrease in the yield of small clusters.
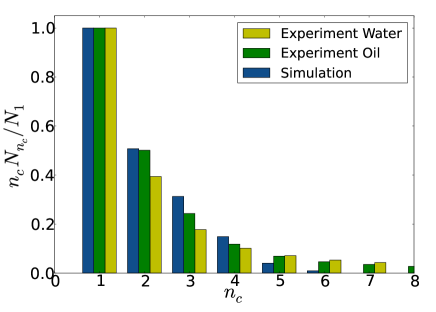
The comparison with experiments can be made more quantitative by comparing the experimentally Wagner et al. (2010) measured weight fraction of the clusters with the total number of particles, , belonging to a cluster with colloids. In order to compare the two quantities we normalize the experimental results with the weight fraction of single particles and the simulation results by the number of single particles . In the first experiments by Wagner et al, the particles were dispersed in the oil phase. In subsequent work Wagner et al. (2010), experimentally compared this situation with that of adding particles via the water phase. They found that the same cluster structures result and that the cluster size distributions are also similar. In the present paper, for consistency, in Fig. 8 we compare the simulation results to experiments where the particles were added via the water phase. We keep, as an additional data set, the size distributions that were obtained by adding particles via the oil phase. Figure 8 shows the two experimental results together with the simulation results for the SWY potential, , and corresponding to a percentage of particles per oil of 3.4%. As the degree of polydispersity of our emulsions is low Wagner et al. (2010), we do not expect it to have a significant effect on the experimental size distribution, and the comparison to the (monodispersed) simulation results is viable. Zerrouki et al. (2006) ], at 5% in weight of silica microparticles per volume of oil, found a fraction with respect to singlets of 0.75, 0.7 and 0.47 for doublets, triplets and quadruplets, respectively. Although these are higher yields than what we found in our simulations and experiments, their experimental parameters differ significantly from ours, so that no conclusion about the relative performance of both methods can be drawn.
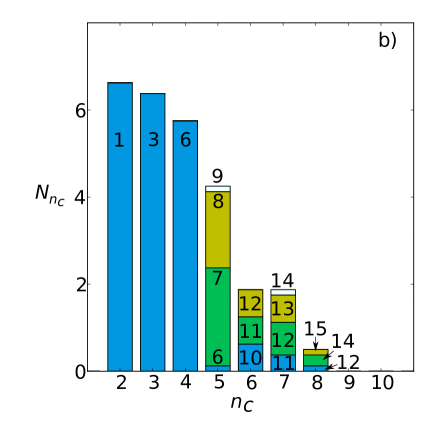
In simulations, we find that clusters with the same number of constituent particles can still have a variety of different structures (isomers). Instead of distinguishing between all possible isomers we classify clusters based on their number of bonds. The bond-number is defined as the total number of bonds in a cluster and, although unable to distinguish between all possible isomers, gives an indication of the compactness of the cluster; for a given value of a smaller number of bonds indicates a more open structure as compared to a cluster with more bonds.
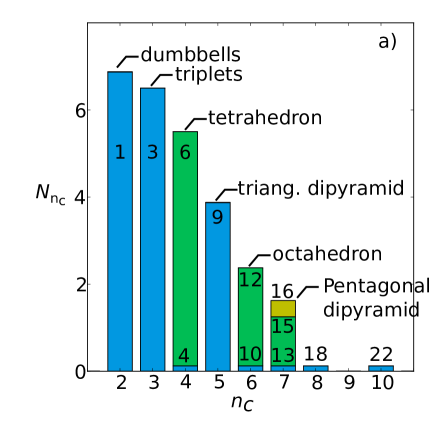
Fig. 9a shows a stacked histogram of the number of clusters with a specific bond-number (SWY potential, , ). The total height of the columns indicates the number of cluster with particles. Each bar is divided in differently colored regions with a relative size proportional to the number of clusters with bonds. Each region is labeled with the actual bond-number. For , only one type of cluster is found with , respectively. Clearly these bond-numbers correspond to doublets and triplets, respectively. For , two different structures are found, a small fraction of clusters with an open structure with only four bonds, and a structure with six bonds, corresponding to the tetrahedron shown in Fig. 5b. For increasing number of constituent particles the number of isomers increases. Fig. 9b) shows the stacked histogram of the number of clusters with a specific bond-number for the AOY potential (, ). Strikingly, the AOY potential produces a larger number of different isomers than the SWY potential. In particular, the AOY potential has isomers with smaller bond-numbers compared to the SWY potential. We interpret the more open structures that we find for the AOY potential as a direct result of its steep attraction and the resulting slow equilibration of the cluster geometry.
III.3 Hierarchical assembly: Superclusters
In order to investigate the possibility of hierarchical assembly of colloidal particles using the droplet-evaporation technique we carried out computer simulations of a mixtures of tetrahedral clusters and emulsion droplets. Hence, we prepared an initial configuration of the simulation consisting of clusters with tetrahedral symmetry (Fig. 5b). No single particles or other than tetrahedral cluster structures were present.
The tetrahedral clusters are thermal in the sense that the particles forming the clusters are kept together solely by the short-ranged attraction and can in principle dissolve, i.e. bonds can break on a long time scale by thermal activation. In experiments, bond breaking is even more unlikely because clusters are held together by van der Waals interactions, which are much stronger than the attraction used in our model. Nevertheless, structures that require bond-breaking in order to form are easily recognized.
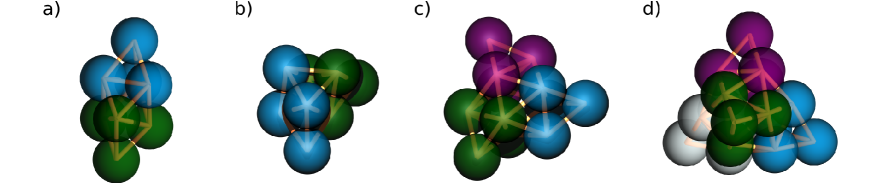
Figure 10 shows the structures obtained in the simulations (SWY potential, , ). In particular, Fig. 10a-b) show two structures consisting of two tetrahedral building blocks. The octahedral dipyramid (Fig. 10a) is formed by two tetrahedra rotated by against each other and with two faces touching. Fig. 10b) shows two truncated hexagonal layers. This cluster formation is possible only because one of the initial tetrahedral clusters has dissolved. This structure is therefore not accessible experimentally when non-thermal clusters are used. Fig. 10c) shows superclusters of three tetrahedra, while Fig. 10d) shows a supertetrahedron, i.e. a cluster formed by four tetrahedra arranged a tetrahedral geometry.
IV Summary and Conclusions
We investigated cluster formation via emulsion droplet evaporation with computer simulations and experiments. We used Metropolis Monte Carlo simulations to model the process of cluster formation in a binary mixture of colloidal particles and emulsion droplets. The colloidal particles interact via both a short-ranged attraction and a long-ranged repulsion, while the second component that represents the emulsion droplets interacts only with an attractive well with the colloids. This potential well has a minimum at the droplet surface in order to induce the Pickering effect. The droplet-droplet interaction is a hard-core interaction with a hard-sphere diameter chosen so that the droplets cannot merge. The droplets shrink at a fixed rate, in order to model experimental conditions of droplet evaporation.
We also performed experiments on polystyrene spheres 154 in diameter in a toluene-water emulsion. The emulsion was vitrified and analyzed with cryo-FESEM, before the evaporation process. The micrographs indicated a random distribution of the positions of the particles that are trapped at the droplet surface. These results can be surprising because charged particles act as electric dipoles when trapped onto droplets due to the effect that the part of their surface exposed to the nonpolar solvent (toluene) cannot sustain its charge. The resulting long-ranged dipolar repulsions may result in regular spatially separated arrangements of the particles at the interface Nikolaides et al. (2002); Horozov et al. (2003). For micron-sized particles this is supported by optical micrographs that indicate polyhedral arrangements when a small number of particles are bound onto an emulsion droplet Manoharan (2006). A different scenario can be expected for our submicron-sized particles because their higher diffusivity can interfere with repulsive interactions, and suppress regular orientation. Interestingly, an earlier study of droplets stabilized by a large number of submicron-sized colloids could even demonstrate that the particles are not necessarily kept separated from each other and can form close-packed islands or even a monolayer Binks and Kirkland (2002).
Computer simulation snapshots and radial distribution functions were used to analyze the dynamics of cluster formation in computer simulation. In agreement with experimental results we find that in our model the particles can freely diffuse on the surface of the droplet before the evaporating droplets force particle agglomeration into clusters. The degree of ordering of the particles on the droplet surface depends on the range of the repulsive interaction, (Debye screening length) that in our model is of the order of two particle diameters. Choosing a longer range for the repulsion could lead to ordered distribution of particles on the surface of the droplets. Furthermore the strength of dipolar interactions, neglected in our present model, could be relevant.
After the complete evaporation of the droplets we find stable clusters that range from sphere doublets to complex polyhedra. The structures and size distributions found in simulations matched those found in experiments. Histograms show that larger clusters can be obtained by increasing the initial size of the droplets or by increasing the density of colloidal particles at the expense of a smaller yield for smaller clusters in accordance with the results of Wagner et al. (2010).
The bond number was used to distinguish different structures with the same number of constituent particles. We found that although the AOY potential gives the same clusters and size distributions as the SWY potential, the AOY interaction results in a larger number of possible structures than the SWY interaction. In particular, the AOY potential gives structures with a smaller number of bonds, i.e. with more open structure. This is intuitively reasonable, since the steep attractive part of the AOY potential results in a difficult equilibration of the geometric structure of the clusters. Although these potentials do not model quantitatively our experimental system, this study can give an indication of what type of interactions one should use in order to change the cluster morphology to more open (softer) clusters.
Our simple model reproduces the experimental results accurately despite a lack of realistic energy or time scales. It is therefore sensible to assume that the model captures the essential physics of the assembly process and that more complex assembly processes can be studied with a certain confidence. Hence, the model can be useful to guide experimental work. As an example we applied the theoretical model to a fluid mixture of tetrahedra clusters and droplets. The computer simulations show that the assembly process via emulsion droplet evaporation can lead to stable superclusters with two, three and four tetrahedral building blocks. These novel structures are not found in the assembly of single nanoparticles and could represent a step in the direction of novel and complex mesoscale materials.
We neglected in our theoretical model the formation of dipole moments for particles trapped at the droplet surface. Including dipolar interactions and increasing the range of the repulsion both constitute interesting steps beyond the current work. Furthermore, using our present model for studying gelation, as was recently reported in colloidal dispersions with a small immiscible liquid Koos and Willenbacher (2011), could be interesting.
Acknowledgements.
We thank Douglas J. Ashton and Helmut R. Brand for useful discussions. We thank Beate Förster and Martina Heider, Bayreuth Institute of Macromolecular Research, for taking cryo-FESEM images. I.S. acknowledges the Elite Network of Bavaria for support in the frame of the Elite Study Program "Macromolecular Science". We acknowledge the DFG for financial support via SFB840/A3.References
- Lekkerkerker et al. (1992) H. N. W. Lekkerkerker, W. C. K. Poon, P. N. Pusey, A. Stroobants, and P. B. Warren, Europhys. Lett. 20, 559 (1992).
- Ilett et al. (1994) S. M. Ilett, A. Orrock, W. C. K. Poon, and P. N. Pusey, Phys. Rev. E 51, 1344 (1994).
- Schmidt et al. (2000) M. Schmidt, H. Löwen, J. M. Brader, and R. Evans, Phys. Rev. Lett. 85, 1934 (2000).
- Dijkstra, Brader, and Evans (1999) M. Dijkstra, J. M. Brader, and R. Evans, J. Phys.: Condens. Matter 11, 10079 (1999).
- Fortini, Dijkstra, and Tuinier (2005) A. Fortini, M. Dijkstra, and R. Tuinier, J. Phys.: Condens. Matter 17, 7783 (2005).
- Pini, Parola, and Reatto (2006) D. Pini, A. Parola, and L. Reatto, J. Phys: Condens. Matter 18, S2305 (2006).
- de Candia et al. (2006) A. de Candia, E. D. Gado, A. Fierro, N. Sator, M. Tarzia, and A. Coniglio, Phys. Rev. E 74, 010403 (2006).
- Sciortino, Tartaglia, and Zaccarelli (2005) F. Sciortino, P. Tartaglia, and E. Zaccarelli, J. Phys. Chem. B 109, 21942 (2005).
- Mossa et al. (2004) S. Mossa, F. Sciortino, P. Tartaglia, and E. Zaccarelli, Langmuir 20, 10756 (2004).
- Campbell et al. (2005) A. I. Campbell, V. J. Anderson, J. S. van Duijneveldt, and P. Bartlett, Phys. Rev. Lett. 94, 208301 (2005).
- Coniglio et al. (2006) A. Coniglio, L. de Arcangelis, A. de Candia, E. D. Gado, A. Fierro, and N. Sator, J. Phys: Condens. Matter 18, S2383 (2006).
- Archer and Wilding (2007) A. J. Archer and N. B. Wilding, Phys. Rev. E 76, 031501 (2007).
- Hoare and Pal (1971) M. Hoare and P. Pal, Adv. Phys. 20, 161 (1971).
- Taffs, Malins, and Williams (2010) J. Taffs, A. Malins, and S. R. Williams, J. Chem. Phys. 133, 244901 (2010).
- Sloane et al. (1995) N. Sloane, R. Hardin, T. Duff, and J. Conway, Discrete Comput. Geom. 14, 237 (1995).
- Arkus, Manoharan, and Brenner (2009) N. Arkus, V. N. Manoharan, and M. P. Brenner, Physical Review Letters 103, 118303 (2009).
- Doye, Wales, and Berry (1995) J. P. K. Doye, D. J. Wales, and R. S. Berry, J. Chem. Phys. 103, 4234 (1995).
- Taffs et al. (2010) J. Taffs, A. Malins, S. R. Williams, and C. P. Royall, J. Phys.: Condes. Matter 22, 104119 (2010).
- Asakura and Oosawa (1954) S. Asakura and F. Oosawa, J. Chem. Phys. 22, 1255 (1954).
- Vrij (1976) A. Vrij, Pure Appl. Chem. 48, 471 (1976).
- van Blaaderen (2003) A. van Blaaderen, Science 301, 470 (2003).
- Duguet et al. (2011) E. Duguet, A. Desert, A. Perro, and S. Ravaine, Chem. Soc. Rev. 40, 941 (2011).
- Jiang and Granick (2007) S. Jiang and S. Granick, J. Chem. Phys. 127, 161102 (2007).
- Zhang and Glotzer (2004) Z. Zhang and S. Glotzer, Nano Letters 4, 1407 (2004).
- Wilber et al. (2007) A. W. Wilber, J. P. K. Doye, A. A. Louis, E. G. Noya, M. A. Miller, and P. Wong, J. Chem. Phys. 127, 085106 (2007).
- Wilber, Doye, and Louis (2009) A. W. Wilber, J. P. K. Doye, and A. A. Louis, J. Chem. Phys 131, 175101 (2009).
- Erb et al. (2009) R. M. Erb, H. S. Son, B. Samanta, V. M. Rotello, and B. B. Yellen, Nature 457, 999 (2009).
- Velev and Nagayama (1997) O. Velev and K. Nagayama, Langmuir 13, 1856 (1997).
- Velev, Furusawa, and Nagayama (1996a) O. Velev, K. Furusawa, and K. Nagayama, Langmuir 12, 2385 (1996a).
- Velev, Furusawa, and Nagayama (1996b) O. Velev, K. Furusawa, and K. Nagayama, Langmuir 12, 2374 (1996b).
- Binks and Horozov (2006) B. Binks and T. Horozov, Colloidal Particles at Liquid Interfaces (Cambridge University Press, Cambridge, 2006).
- Manoharan, Elsesser, and Pine (2003) V. Manoharan, M. Elsesser, and D. Pine, Science 301, 483 (2003).
- Cho et al. (2005a) Y. Cho, G. Yi, S. Kim, D. Pine, and S. Yang, Chem Mater 17, 5006 (2005a).
- Cho et al. (2007a) Y.-S. Cho, G.-R. Yi, S.-H. Kim, S.-J. Jeon, M. T. Elsesser, H. K. Yu, S.-M. Yang, and D. J. Pine, Chem. Mater. 19, 3183 (2007a).
- Kim et al. (2008) S.-H. Kim, G.-R. Yi, K. H. Kim, and S.-M. Yang, Langmuir 24, 2365 (2008).
- Cho et al. (2005b) Y. Cho, G. Yi, J. Lim, S. Kim, V. Manoharan, D. Pine, and S. Yang, J. Am. Chem. Soc. 127, 15968 (2005b).
- Zerrouki et al. (2006) D. Zerrouki, B. Rotenberg, S. Abramson, J. Baudry, C. Goubault, F. Leal-Calderon, D. Pine, and M. Bibette, Langmuir 22, 57 (2006).
- Cho et al. (2007b) Y.-S. Cho, G.-R. Yi, Y. S. Chung, S. B. Park, and S.-M. Yang, Langmuir 23, 12079 (2007b).
- Wagner, Lu, and Wittemann (2008) C. S. Wagner, Y. Lu, and A. Wittemann, Langmuir 24, 12126 (2008).
- Wagner et al. (2010) C. S. Wagner, B. Fischer, M. May, and A. Wittemann, Colloid Polym. Sci. 288, 487 (2010).
- Landfester (2000) K. Landfester, Macromol. Symposia 150, 171 (2000).
- Hoffmann et al. (2009) M. Hoffmann, C. S. Wagner, L. Harnau, and A. Wittemann, ACS Nano 3, 3326 (2009).
- Roman, Schmidt, and Löwen (2000) F. L. Roman, M. Schmidt, and H. Löwen, Phys. Rev. E 61, 5445 (2000).
- Lauga and Brenner (2004) E. Lauga and M. P. Brenner, Phys. Rev. Lett. 93, 238301 (2004).
- Mani et al. (2010) E. Mani, E. Sanz, P. G. Bolhuis, and W. K. Kegel, J. Phys. Chem. C 114, 7780 (2010).
- Pieranski (1980) P. Pieranski, Phys. Rev. Lett. 45, 569 (1980).
- Sanz and Marenduzzo (2010) E. Sanz and D. Marenduzzo, J. Chem. Phys. 132 (2010).
- Wu, Chandler, and Smit (1992) D. Wu, D. Chandler, and B. Smit, J. Phys. Chem. 96, 4077 (1992).
- Frenkel and Smit (2002) D. Frenkel and B. Smit, Understanding molecular simulation: from algorithms to applications (Academic Press (London), 2002).
- Johnson (1966) N. Johnson, Canadian J. Math. 18, 169 (1966).
- Nikolaides et al. (2002) M. G. Nikolaides, A. Bausch, M. F. Hsu, A. D. Dinsmore, M. P. Brenner, C. Gay, and D. A. Weitz, Nature 420, 299 (2002).
- Horozov et al. (2003) T. S. Horozov, R. Aveyard, J. H. Clint, and B. P. Binks, Langmuir 19, 2822 (2003).
- Manoharan (2006) V. N. Manoharan, Thin Solid State Comm. 139, 557 (2006).
- Binks and Kirkland (2002) B. P. Binks and M. Kirkland, Phys. Chem. Chem. Phys. 4, 3727 (2002).
- Koos and Willenbacher (2011) E. Koos and N. Willenbacher, Science 331, 897 (2011).