Detection of the -ray binary LS I +61∘303 in a low flux state at Very High Energy -rays with the MAGIC Telescopes in 2009
Abstract
We present very high energy (VHE, E 100 GeV) -ray observations of the -ray binary system LS I +61∘303 obtained with the MAGIC stereo system between 2009 October and 2010 January. We detect a 6.3 -ray signal above 400 GeV in the combined data set. The integral flux above an energy of 300 GeV is , which corresponds to about 1.3% of the Crab Nebula flux in the same energy range. The orbit-averaged flux of LS I +61∘303 in the orbital phase interval 0.6–0.7, where a maximum of the TeV flux is expected, is lower by almost an order of magnitude compared to our previous measurements between 2005 September and 2008 January. This provides evidence for a new low flux state in LS I +61∘303. We find that the change to the low flux state cannot be solely explained by an increase of photon-photon absorption around the compact star.
Subject headings:
binaries: general — gamma rays: general — stars: individual (LS I +61 303 (catalog )) — X-rays: binaries — X-rays: individual (LS I +61 303 (catalog ))1. Introduction
The LS I +61∘303 system consists of a Be star and a compact object of still uncertain nature, either a neutron star or a black hole. Its orbital period, which is most precisely measured in radio, is days (Gregory, 2002). Soft X-ray outbursts modulated with the same period as in the radio waveband were reported by Paredes et al. (1997) and changes in the orbital evolution have been recently studied (Torres et al., 2010). Many other orbital parameters of the system are less precisely known and different solutions have been proposed (see Casares et al. 2005; Grundstrom et al. 2007; Aragona et al. 2009) but observations indicate a highly eccentric orbit () with the periastron passage at orbital phase (Aragona et al., 2009). These orbital parameters are important for modelling the VHE emission of the system as shown in,e.g., Sierpowska-Bartosik and Torres (2009) or Dubus et al. (2010).
In 2006 the MAGIC collaboration discovered variable VHE -ray emission from LS I +61∘303 (Albert et al., 2006). A following extensive observational campaign in Fall 2006 found a period for the VHE emission of days (Albert et al., 2009). The VHE -ray emission shows an outburst in the orbital phase interval 0.6–0.7 with no significant -ray emission detected during the rest of the orbit. In particular, no VHE -ray signal was detected by MAGIC around the periastron passage of the system. The data from Fall 2006 also suggested a correlation between the X-ray and VHE -ray flux (Albert et al., 2008). An extensive multi-wavelength campaign conducted in 2007, including MAGIC, XMM-Newton and Swift, provided strong evidence for the X-ray/VHE -ray flux correlation in strictly simultaneous data (Anderhub et al., 2009). In contrast, no correlation was found between the radio wavelength flux and the VHE -ray flux from the Fall of 2006 campaign (Albert et al., 2008).
The VHE emission of LS I +61∘303 was confirmed by VERITAS observations between 2006 Sep and 2007 Feb (Acciari et al., 2008). However, in observations conducted by the VERITAS collaboration in Fall 2008 and early 2009, no VHE signal was detected. More recent VERITAS observations in Fall 2009 (the same time period as in the present paper) also yielded only upper limits for VHE emission from LS I +61∘303 (Acciari et al., 2011). Very recently the VERITAS collaboration reported a detection of the system with a significance of more than (Acciari et al. 2011) between orbital phases 0.05 and 0.23. This places the detection at superior conjunction and 5.8 to 1.3 days before the periastron passage. No VHE -ray emission was previously detected in this phase range.
The binary system was observed in high energy (HE, ) -rays by EGRET (Kniffen et al., 1997) but the large position uncertainty of the source and inconclusive variability studies of the emission, prevented its unambiguous identification. The positional association with LS I +61∘303 was only achieved following HE -ray observations by AGILE (Pittori et al., 2009). More recently, Fermi/LAT found that the HE -rays are periodically modulated in very good agreement with the (radio) orbital period (Abdo et al., 2009) establishing beyond doubt that the signal origins from LS I +61∘303. The HE outburst was not, however, observed at the same phases as the VHE outburst but occurred between phase 0.3 and 0.45 just after the periastron passage. This difference in phase may indicate that different processes are responsible for the HE and VHE -ray emission. On the other hand, the same process might produce both emissions if the GeV -rays are produced by inverse Compton (IC) pairs cascading developing in the radiation field of the star. This cascade would reduce the TeV emission and enhance the GeV emission when the compact object is close to the star. For more details on such a scenario see Bednarek (2006b). Another possibility is that the shift in the peak emission could be caused by a different location of the -ray production site in the system (Zabalza et al., 2011). We note that no simultaneous VHE observations are available at the same epoch (Aug 2008 to Jan 2009) of the first reported Fermi observations (Abdo et al., 2009). An unambiguous interpretation of the non simultaneous SED from MeV to TeV energies of LS I +61∘303 is not possible because the system might have changed its VHE emission in the meantime.
Two principal scenarios have been proposed to explain the non-thermal emission from LS I +61∘303: an accretion powered microquasar (e.g. Romero et al. 2005; Bednarek 2006a; Gupta and Böttcher 2006; Bosch-Ramon et al. 2006) and a rotation-powered compact pulsar wind (e.g. Dubus 2006; Sierpowska-Bartosik and Torres 2009; Zdziarski et al. 2010). An alternative model assumes that the compact object is an accreting magnetar and that the -rays are produced along the accretion flow onto the magnetar (Bednarek, 2009). High resolution radio measurements (Dhawan et al., 2006) show an extended structure varying in shape and position as a function of the orbital phase. While this was taken as evidence for a pulsar wind interacting with that of the Be star other interpretations were suggested as well (Romero et al., 2007). Neither of the two proposed scenarios could be validated by accretion disk features, e.g. a thermal component in the X-ray spectrum, or the presence of pulsed emission at any wavelength. Thus the engine behind the VHE emission remains an open question.
Here we present new observations of LS I +61∘303 conducted with the MAGIC stereo system. This has twice the sensitivity of the previous MAGIC campaigns, and results in a significant detection of the binary system during a newly identified low flux state. We briefly discuss the observational technique and the data analysis procedure, present the VHE -ray light curve of the source, and put the results in context of the previous VHE -ray observations of this system.
2. Observations
The observations were performed between 2009 Oct 15 and 2010 Jan 22 using the MAGIC telescopes on the Canary island of La Palma (N, W, 2225 m a.s.l.), from where LS I +61∘303 is observable at zenith distances above 32∘. The MAGIC stereo system consists of two imaging air Cherenkov telescopes, each with a 17 m diameter mirror. The observations were carried out in stereo mode, meaning only shower images which trigger simultaneously both telescopes are recorded. The stereoscopic observations provide a signal above 300 GeV from a source which exhibits 0.8% of the Crab Nebula flux in 50 hours observation time, a factor of two more sensitive than our single telescope campaign on LS I +61∘303 in 2007. Further details on the design and performance of the MAGIC stereo system can be found in Aleksić et al. (2011).
The LS I +61∘303 data set spans four orbits of the system, with two observed for only one and three nights, respectively. The data taken in 2009 Oct and 2009 Nov were restricted to moonless nights. The data sample the orbital phases 0.55 to 0.98 for 2009 Oct , and 0.58 to 1.02 for 2009 Nov , the last night of which is in the next orbital cycle. The data recorded in 2010 Jan cover the phases 0.22 to 0.32 and were obtained during moonlight conditions (see Table 1). All data were taken at zenith angles between 32∘ and 48∘. After pre-selection of good quality data a total of 48.4 hours of data remained for the analysis. The observation strategy aimed to cover consecutive nights with at least three hours of observation in each individual night. Due to adverse observation conditions such as bad weather, the data set does not have uniform coverage during the orbital phases and some nights have shorter observation times than the planned three hours.
3. Data Analysis
The data analysis was performed with the standard MAGIC reconstruction software. The recorded shower images were calibrated, cleaned and used to calculated image parameters individually for each telescope. The energy of each event was then estimated using look up tables generated by Monte Carlo (MC) simulated -ray events. The events that simultaneously triggered both telescopes (the so-called stereo events) were then selected111This step is only needed for the 2009 October data where no hardware stereo trigger was yet available. and further parameters, e.g. the height of the shower maximum and the impact parameter from each telescope, were calculated. The gamma hadron classifications and reconstructions of the incoming direction of the primary shower particles were then performed using the Random Forest (RF) method (Albert et al., 2008). The RF calculates a variable called hadronness which is a measure of the probability that an event is of hadronic origin. Finally, the signal selection used cuts in the hadronness (calculated by the RF) and in the squared angular distance between the shower pointing direction and the source position (). The energy dependent cut values were determined by optimizing them on a sample of events recorded from the Crab Nebula under the same zenith angle range and similar epochs than the LS I +61∘303 data. For the energy spectrum and flux, the effective detector area was estimated by applying the same cuts used on the data sample to a sample of MC simulated -rays. Finally, the energy spectrum was unfolded, accounting for the energy resolution and possible energy reconstruction bias (Albert et al., 2007).
In this analysis we use for the estimation of the detection significance a set of cuts optimized to yield the highest significance on a sample of Crab Nebula data under similar observation conditions as the LS I +61∘303 data set. These cuts are then applied to a set of simulated MC -rays to estimate the energy threshold of the detection plot (). For the light curve and spectrum determination softer cuts are used to reduce systematic effects and provide a lower energy threshold by sacrificing the highest significance.
4. Results
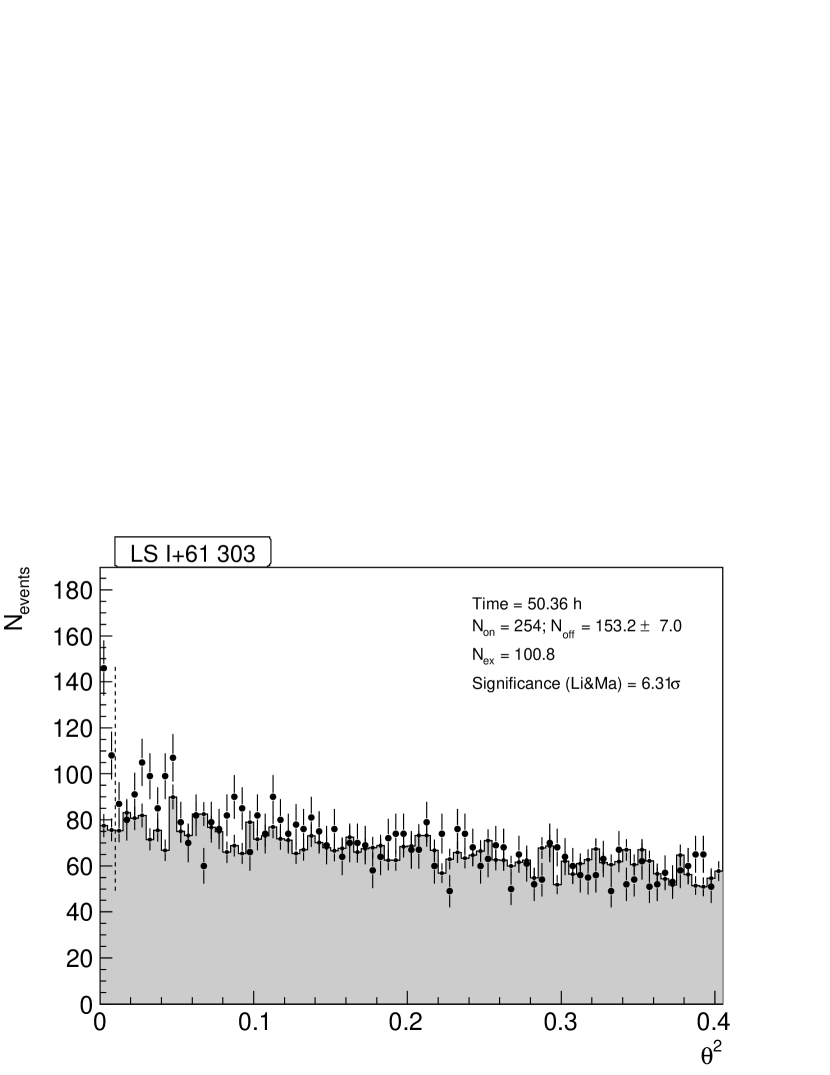
The integral data set of 48.8 hours presented here results in a detection of VHE -ray emission above 400 GeV from LS I +61∘303 (see Fig. 1). The integrated flux above 300 GeV is
corresponding to about 1.3% of the Crab Nebula flux in the same energy range.
4.1. Light curve
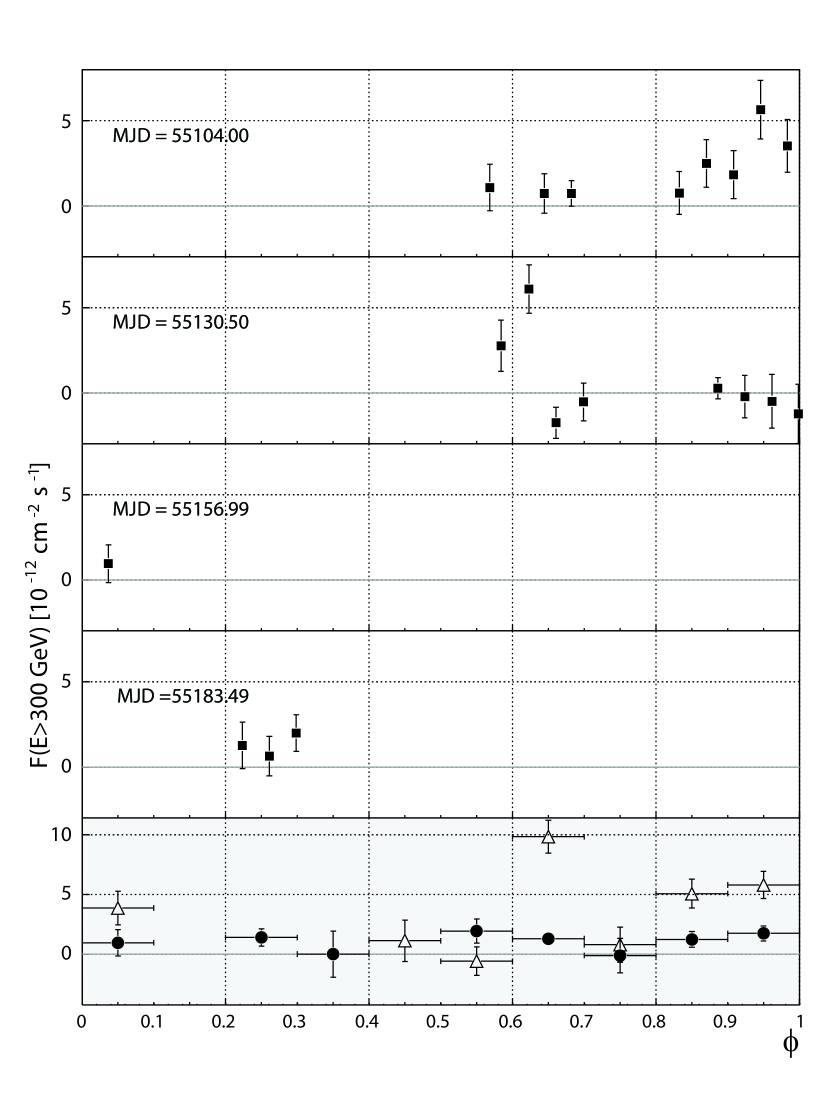
We derived a nightly light curve above an energy of 300 GeV that is shown in Fig. 2. The measured fluxes and upper limits are quoted in Table 1. A constant flux fit to the light curve yields a () and hence is unlikely. Thus, as in previous observations, the emission is variable and reaches a maximum flux around orbital phase 0.62 of , corresponding to 5.4% of the Crab Nebula flux. This is a much lower peak emission than detected in our previous campaigns at the same orbital phases and sampled with very similar cadence. For a more quantitative comparison of the 2009 emission level with the previous MAGIC observations, we included in Figure 2 the lightcurve of the 2007 data averaged in 0.1 phase bins.
| Middle Time | Obs. Time | Phase | Significance | Flux | Upper limit |
|---|---|---|---|---|---|
| (MJD) | (min) | (pre-trial) | 10-12 | 10-12 | |
| (cm-2 s-1) | (cm-2 s-1) | ||||
| 55119.07 | 138 | 0.57 | 0.8 | 1.11.4 | 4.0 |
| 55121.08 | 176 | 0.64 | 0.6 | 0.71.2 | 3.2 |
| 55122.08 | 194 | 0.68 | 1.0 | 0.70.8 | 2.4 |
| 55126.06 | 104 | 0.83 | 0.6 | 0.81.3 | 3.6 |
| 55127.06 | 137 | 0.87 | 1.9 | 2.51.4 | 5.5 |
| 55128.07 | 137 | 0.91 | 1.4 | 1.81.4 | 4.9 |
| 55129.06 | 132 | 0.95 | 3.8 | 5.71.7 | |
| 55130.06 | 135 | 0.98 | 2.5 | 3.51.5 | |
| 55145.97 | 140 | 0.58 | 2.0 | 2.81.5 | |
| 55147.01 | 221 | 0.62 | 4.9 | 6.11.4 | |
| 55148.00 | 216 | 0.66 | -1.8 | -1.80.9 | 1.0 |
| 55149.02 | 171 | 0.70 | -0.5 | -0.51.1 | 1.9 |
| 55153.99 | 123 | 0.89 | 0.5 | 0.30.6 | 1.8 |
| 55154.98 | 149 | 0.92 | -0.2 | -0.21.2 | 2.5 |
| 55155.98 | 115 | 0.96 | -0.3 | -0.51.6 | 2.9 |
| 55156.95 | 73 | 1.00 | -0.7 | -1.21.7 | 2.9 |
| 55157.97 | 82 | 0.04 | 0.9 | 1.01.1 | 3.6 |
| 55215.90 | 134 | 0.22 | 1.0 | 1.31.4 | 4.2 |
| 55216.90 | 161 | 0.26 | 0.6 | 0.61.2 | 3.2 |
| 55217.90 | 165 | 0.30 | 2.0 | 2.01.1 |
We found that the averaged emission level is dramatically lower than measured in our campaigns from 2005 to 2007 (Albert et al., 2006; Albert et al., 2009; Anderhub et al., 2009). Not only had the flux changed but a VHE -ray excess was also observed at phases other than those of the periodic outburst between 0.6–0.7. The highest flux is, however, again detected in an outburst during the interval 0.6–0.7, and the measurements in the orbital cycle of 2009 Nov show the same burst profile as in previous observations but with a reduced flux level. Whether the outburst recurrence is still a periodic property of the VHE emission for LS I +61∘303 and whether it shows the same shape as in previous campaigns, cannot be determined with the small number of orbital cycles observed in this campaign. It is noteworthy that the outburst was not detected during the orbit observed in 2009 Oct.
The mean flux for all phase bins is given in Table 2. The rather low mean values, even in the phase bin 0.6–0.7, of the individual night peak emission indicates that most of the emission of the system is contributed by only few nights instead of a constant flux. A fit to a constant flux in the phase bin 0.6–0.7 yields a being strongly disfavored.
| Phase bin | Flux | Flux upper limit |
| (10-12cm-2 s-1) | (10-12cm-2 s-1) | |
| 0.0–0.1 | 1.0 1.1 | 1.3 |
| 0.1–0.2 | ||
| 0.2–0.3 | 1.4 0.7 | |
| 0.3–0.4 | 0.0 1.9 | 0.0 |
| 0.4–0.5 | ||
| 0.5–0.6 | 1.9 1.0 | 1.3 |
| 0.6–0.7 | 1.3 0.5 | |
| 0.7–0.8 | 0.1 1.4 | 2.0 |
| 0.8–0.9 | 1.2 0.7 | 1.1 |
| 0.9–1.0 | 1.7 0.6 |
4.2. Spectrum
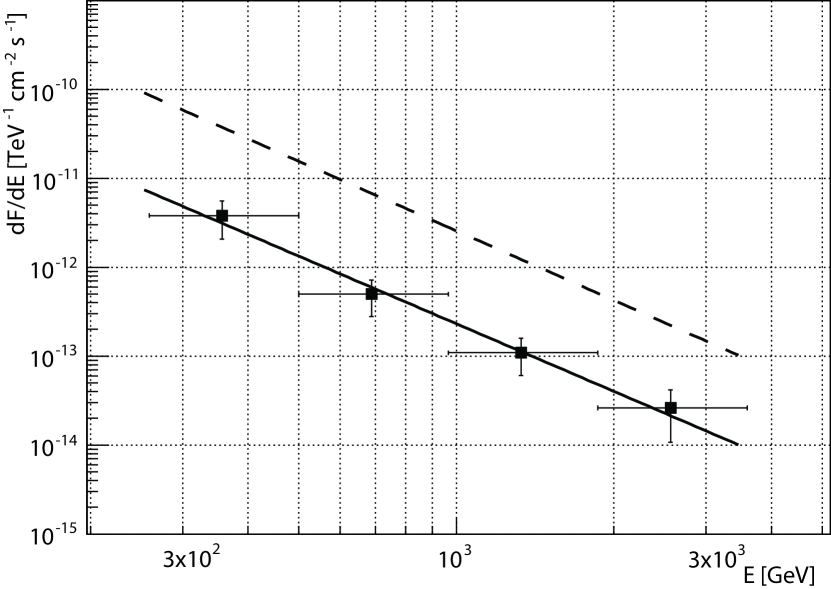
The emission level of LS I +61∘303 was too low during most phases to obtain statistical significant phase dependent spectra. The total signal, however, was sufficient to form a phase integrated spectrum with good enough statistic per bin to perform a Chi-square test, shown in Fig. 3.
The spectrum is well described by a simple power law
with a . The spectral slope is compatible within errors with those previously reported by MAGIC (Albert et al., 2006; Albert et al., 2009; Anderhub et al., 2009). Hence, no evidence for long term spectral variability despite very different fluxes during these different campaigns is observed. Moreover, a exponential cutoff was also fitted allowing the power law parameters to vary in the one sigma range (adding linearly statistical and systematic uncertainties) with respect to the fitted spectra in Anderhub et al. (2009). That leads to a best fit cutoff at 483 GeV with a reduced , which is strongly increased with respect to the power law fit and hence strongly disfavors a cutoff in the spectra to explain the reduced flux level.
5. Discussion
The binary system LS I +61∘303 was detected emitting VHE -rays in 2009–2010 at a level a factor 10 lower than previously observed in the phase interval 0.6–0.7. The previously observed orbital modulated outburst in this interval was not detected during the first observed orbital cycle, whereas it was observed in the second. From this data set alone it was not possible to determine whether the outburst is still a truly periodic feature of the light curve. There are also other orbital phases, varying from one orbit to another, during which significant emission was observed from 2005 to 2008. These individual nights were rarely observed and contributed only a minor fraction to the integral signal from LS I +61∘303 in these campaigns. Although we could not significantly detect emission at individual orbital phases in the here presented observations because of the weakness of the source, it appears that several phase intervals dominate in the integral signal. This is strong evidence for a new behavior in the VHE -ray emission of LS I +61∘303. In previous observations conducted with MAGIC, the 0.6–0.7 interval dominated the total flux.
Furthermore it is evident that the flux during that phase interval is considerable reduced compared to the previous campaigns and on a similar level as in other phase intervals (e.g. 0.9–1.0). This suggests that a change in the VHE -ray emission of LS I +61∘303 has occurred. On the other hand, there was no statistically significant change in the spectrum of the orbit-integrated flux in 2009 compared to the earlier results, suggesting that the same processes continue to produce VHE gamma-rays, but that either fewer are produced or they are more absorbed.
If enhanced opacity causes the observed decreases in the VHE flux, the photons will be redistributed to lower energies and thus might be visible as a flux enhancement. Those VHE -rays would thus need to propagate through a circum-source environment with a higher photon energy density and we would expect to detect a cut-off or an absorption feature in our spectrum. A cut-off in our energy range that reduces the integral flux by a factor of ten compared to our previous measurements (e.g. Anderhub et al. (2009))is incompatible with our spectrum. The spectral fit disfavors an increased photon-photon absorption around the emission region as the explanation for the flux reduction in the VHE domain.
Another possibility is that there might be fewer accelerated particles and/or fewer seed photons or less target matter, resulting in lower VHE -rays production, depending on the details of the assumed model (microquasar, pulsar wind, leptonic or hadronic production). However, regardless of the scenario, a change in the stellar wind density profile might explain the change in the VHE -ray emission level: the wind density, velocity, and porosity determine the accretion rate in the microquasar scenario and the location of the termination shock in the pulsar wind scenario. Depending on the magnitude of these changes it might be difficult to explain the large variation in the VHE domain, at least a recent study of the effect of wind clumping in the framework of a microquasar scenario found only variations of about 10% (Owocki et al., 2009). In addition, the effect of possible stellar wind density variations on the VHE emission in LS I +61∘303 are not yet well understood.
The VERITAS observations in the same period as we have presented here did not detect VHE -ray emission from the system (Acciari et al., 2011). Our measurements are not, however, in contradiction to those of VERITAS. Our longer integration combined with a denser sampling of two orbital cycles yielded a fainter detection threshold than from previous campaigns expected VHE -ray signal from LS I +61∘303. Thus it is evident that a frequent sampling with long individual integrations is required not to miss weak emission from binary systems.
This is the first VHE -ray detection of LS I +61∘303 in the era of the Fermi satellite. The faint emission at VHE -rays does not yet permit night by night correlation studies but do show that the emission in LS I +61∘303 has changed on longer timescale, since 2007. More sensitive and even deeper VHE -ray observations should yield shorter timescale correlation studies.
Acknowledgments
We would like to thank the Instituto de Astrofísica de Canarias for the excellent working conditions at the Observatorio del Roque de los Muchachos in La Palma. The support of the German BMBF and MPG, the Italian INFN, the Swiss National Fund SNF, and the Spanish MICINN is gratefully acknowledged. This work was also supported by the Marie Curie program, by the CPAN CSD2007-00042 and MultiDark CSD2009-00064 projects of the Spanish Consolider-Ingenio 2010 programme, by grant DO02-353 of the Bulgarian NSF, by grant 127740 of the Academy of Finland, by the YIP of the Helmholtz Gemeinschaft, by the DFG Cluster of Excellence “Origin and Structure of the Universe”, and by the Polish MNiSzW Grant N N203 390834.
Facilities: MAGIC
References
- Abdo et al. (2009) Abdo, A. A. et al.: 2009, ApJ, 701, L123
- Acciari et al. (2008) Acciari, V. A. et al.: 2008, ApJ, 679, 1427
- Acciari et al. (2011) Acciari, V. A. et al.: 2011, ArXiv e-prints
- Albert et al. (2006) Albert, J. et al.: 2006, Science, 312, 1771
- Albert et al. (2007) Albert, J. et al.: 2007, Nucl. Instrum. Meth., A583, 494
- Albert et al. (2008) Albert, J. et al.: 2008, Nucl. Instrum. Meth., A588, 424
- Albert et al. (2008) Albert, J. et al.: 2008, ApJ, 684, 1351
- Albert et al. (2009) Albert, J. et al.: 2009, ApJ, 693, 303
- Aleksić et al. (2011) Aleksić, J., et al. 2011, ArXiv e-prints, 1108.1477
- Anderhub et al. (2009) Anderhub, H. et al.: 2009, ApJ, 706, L27
- Aragona et al. (2009) Aragona, C. et al.: 2009, ApJ, 698, 514
- Bednarek (2006a) Bednarek, W.: 2006a, MNRAS, 371, 1737
- Bednarek (2006b) Bednarek, W.: 2006b, MNRAS, 368, 579
- Bednarek (2009) Bednarek, W.: 2009, MNRAS, 397, 1420
- Bosch-Ramon et al. (2006) Bosch-Ramon, V., Paredes, J. M., Romero, G. E., and Ribó, M.: 2006, A&A, 459, L25
- Casares et al. (2005) Casares, J., Ribas, I., Paredes, J. M., Marti, J., and Allende Prieto, C.: 2005, MNRAS, 360, 1091
- Dhawan et al. (2006) Dhawan, V., Mioduszewski, A., and Rupen, M.: 2006, in Proceedings of the VI Microquasar Workshop: Microquasars and Beyond. September 18-22, 2006, Como, Italy., p.52.1
- Dubus (2006) Dubus, G.: 2006, A&A, 456, 801
- Dubus et al. (2010) Dubus, G., Cerutti, B., and Henri, G.: 2010, A&A, 516, A18+
- Gregory (2002) Gregory, P. C.: 2002, ApJ, 575, 427
- Grundstrom et al. (2007) Grundstrom, E. D. et al.: 2007, ApJ, 656, 437
- Gupta and Böttcher (2006) Gupta, S. and Böttcher, M.: 2006, ApJ, 650, L123
- (23) Li, T. P. and Ma, Y. Q.: 1983, ApJ, 272, 317
- Kniffen et al. (1997) Kniffen, D. A. et al.: 1997, ApJ, 486, 126
- Owocki et al. (2009) Owocki, S. P., Romero, G. E., Townsend, R. H. D., and Araudo, A. T.: 2009, ApJ, 696, 690
- Paredes et al. (1997) Paredes, J. M., Marti, J., Peracaula, M., and Ribo, M.: 1997, A&A, 320, L25
- Pittori et al. (2009) Pittori, C. et al.: 2009, A&A, 506, 1563
- Rolke et al. (2005) Rolke, W., Lopez, A., and Conrad, J.: 2005, Nucl. Instrum. Meth., A551, 493
- Romero et al. (2005) Romero, G. E., Christiansen, H. R., and Orellana, M.: 2005, ApJ, 632, 1093
- Romero et al. (2007) Romero, G. E., Okazaki, A. T., Orellana, M. and Owocki, S. P.: 2007, A&A, 474, 15
- Sierpowska-Bartosik and Torres (2009) Sierpowska-Bartosik, A. and Torres, D. F.: 2009, ApJ, 693, 1462
- Torres et al. (2010) Torres, D. F. et al.: 2010, ApJ, 719, L104
- Zabalza et al. (2011) Zabalza, V., Paredes, J. M., and Bosch-Ramon, V.: 2011, A&A, 527, A9+
- Zdziarski et al. (2010) Zdziarski, A. A., Neronov, A., and Chernyakova, M.: 2010, MNRAS, 403, 1873