Collective and single cell behavior in epithelial contact inhibition
Abstract
Control of cell proliferation is a fundamental aspect of tissue physiology central to morphogenesis, wound healing and cancer. Although many of the molecular genetic factors are now known, the system level regulation of growth is still poorly understood. A simple form of inhibition of cell proliferation is encountered in vitro in normally differentiating epithelial cell cultures and is known as ”contact inhibition”. The study presented here provides a quantitative characterization of contact inhibition dynamics on tissue-wide and single cell levels. Using long-term tracking of cultured MDCK cells we demonstrate that inhibition of cell division in a confluent monolayer follows inhibition of cell motility and sets in when mechanical constraint on local expansion causes divisions to reduce cell area. We quantify cell motility and cell cycle statistics in the low density confluent regime and their change across the transition to epithelial morphology which occurs with increasing cell density. We then study the dynamics of cell area distribution arising through reductive division, determine the average mitotic rate as a function of cell size and demonstrate that complete arrest of mitosis occurs when cell area falls below a critical value. We also present a simple computational model of growth mechanics which captures all aspects of the observed behavior. Our measurements and analysis show that contact inhibition is a consequence of mechanical interaction and constraint rather than interfacial contact alone, and define quantitative phenotypes that can guide future studies of molecular mechanisms underlying contact inhibition.
1 Introduction
The precise orchestration of cell division and growth is central to morphogenesis and animal development [1, 2]. Complex cellular signaling and regulatory networks are dedicated to growth control and misregulation of cell proliferation leads to tumors and cancer [3]. Epithelial tissue is an important system to study regulation of growth. Normal development of epithelial tissue involves a mesenchymal to epithelial transition (MET) [4] associated with the loss of cell mobility, mitotic arrest and acquisition of epithelial morphology. This transition is reversed in the process of wound healing [5]. On the other hand, cells that have undergone oncogenic epithelial to mesenchymal transition (EMT) typically lose their ability to undergo MET. Hence understanding the normal MET process is of fundamental importance for understanding oncogenic transformations which disregulate it.
In cultured, non-cancerous epithelial cells, the transition from freely proliferating, non-confluent cells to fully differentiated, dense epithelial monolayers is commonly referred to as “contact inhibition” [6, 7, 8, 9]. Contact inhibition in confluent cell cultures is currently defined as i) a dramatic decrease of cell mobility and mitotic rate with increasing cell density; ii) establishment of a stationary post-confluent state which is insensitive to nutrient renewal. It is widely believed that contact inhibition, as the name suggests, is caused by cell contact. But despite extensive study, current understanding of the mechanism of contact inhibition is far from complete (see [10, 11, 12, 13, 14]).
Many molecular mechanisms have been proposed to contribute to contact inhibition. It is widely accepted that contact inhibition requires establishment of E-cadherin mediated cell-cell contacts and subsequent maturation of the adherens junctions (AJs) that link E-cadherin and F-actin in a synapse-like complex involving numerous other proteins [15, 16, 17, 18]. However, the nature of the signaling pathway leading to suppression of mitosis remains unclear. One possible pathway involves -catenin, a mediator of Wnt signaling, that, in addition to its function as a transcriptional co-factor, is associated with the AJs at the cell surface [19, 20]. A contact inhibition role has been reported for NF2/Merlin, a tumor suppressor gene [21, 22] that encodes a membrane-cytoskeletal scaffolding protein, which most likely acts via the Hippo kinase pathway, controlling nuclear localization of the transcriptional activator YAP [23, 24, 13] - itself a known regulator of cell proliferation. Contact inhibition is known to involve the MAPK pathway, which, in turn, promotes cell cycle entry by regulating the expression of cyclinD1 [25, 26, 27]. Also implicated are Nectins [28, 29, 12] - a family of cell adhesion molecules that are involved, together with integrins and other proteins, in the regulation of cell motility and proliferation. Yet, this accumulated knowledge falls far short of a comprehensive picture of contact inhibition. The difficulty in achieving a better understanding of the molecular mechanism lies in the complexity of the contact inhibition phenotype, which, as we describe below, involves the concurrence of many processes.
To facilitate progress in the dissection of the regulatory pathways underlying contact inhibition, we undertook a quantitative reexamination of the spatio-temporal dynamics of an adherent epithelial layer formed by Madin-Darby Canine Kidney (MDCK) cells. These cells are known for their ability to exhibit contact inhibition and achieve characteristic epithelial morphology in culture [30, 31] thus providing an excellent model system for in vitro study of epithelial tissue dynamics [32, 33, 34]. Using long-term fluorescence and phase contrast video microscopy in conjunction with image segmentation and cell tracking, we have characterized the temporal progression of contact inhibition in growing MDCK colonies. Quantitative analysis of the evolution of cell density, cell motility and cell division rate reveals that contact inhibition proceeds in three distinct stages: 1) a stage of cell density growth with gradual inhibition of motility, but without inhibition of mitosis that is followed by 2) a rapid transition to epithelial cell morphology, followed by 3) continued cell division and reduction of cell size with a progressively decreasing rate of mitosis. Mitotic arrest is achieved once cell area falls below a certain threshold. Our findings show that contact between cells is not sufficient for inhibition of mitosis in MDCK cells. Instead, inhibition of cell proliferation is a consequence of mechanical constraint that causes successive cell divisions to reduce cell area.
2 Results
2.1 Large scale analysis
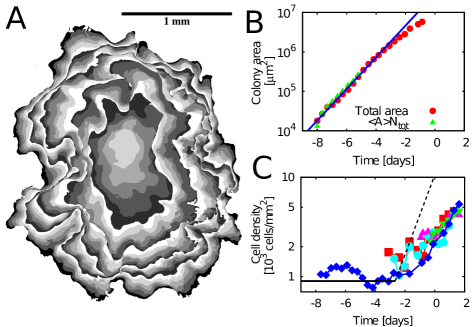
To separate the effect of cell contact from that of mechanical constraint arising upon confluence of proliferating cells, we first examine the dynamics of isolated, growing colonies of MDCK cells. The colonies, started from a small initial number of cells, were monitored with subcellular resolution by time-lapse video microscopy for up to three weeks until nearly complete proliferation arrest (see Materials and Methods for details). Fig. 1A shows the large scale dynamics of a growing colony. The boundary of the colony exhibits nontrivial dynamics due to the combined effect of motility and cell division. It moves outward with a non-uniform velocity forming finger-like protrusions [32, 35, 33]. Yet the total area of the colony grows following a simple exponential law (Fig. 1B) for up to 5-6 days, reaching over cells. Cell density in the bulk remains constant during this period (Fig. 1C). Daughter cells occupy, on average, twice the area of their mother cell and the rate of colony area growth matches exactly the rate of cell mitosis. Thus, colony expansion is driven by cell proliferation.In this “free growth” regime, although cells stay in contact with each other for several days, no inhibition of growth is observed.
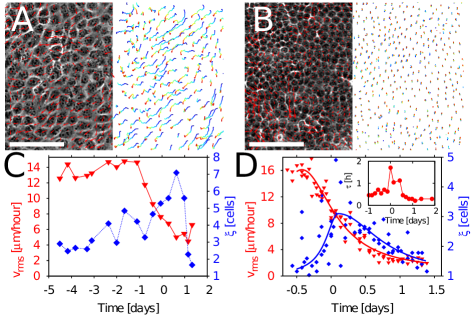
Expansion of the colony is made possible by the fluid-like motion of cells in the two-dimensional confluent layer (see Fig.2A). To quantitatively characterize this motion we carried out a PIV-type analysis of the time series of phase-contrast images [36]. This analysis determines the local velocity field by comparing successive images. In the free growth regime, cells exhibit a swirling, but outwardly biased flow with a root-mean-square (r.m.s.) outward velocity of about m/h, or approximately 1 cell width per hour. The motion of nearby cells is correlated on a length scale of about 5 cells (see Fig.2C).
Of course, exponential increase in colony area cannot continue indefinitely as it would require the outward motion of peripheral cells to have an exponentially increasing velocity. To support an exponential area increase at a rate , the velocity of cells on the boundary must be . Comparing this to the observed maximal velocity of cell motion, m/h, we arrive at an estimate for the critical size of the colony, . Above this critical area, expansion of the colony cannot keep up with cell proliferation in the bulk without increasing cell density. This estimate is close to the observed area at the time of crossover ( days) from exponential to sub-exponential growth of the colony area (Fig.1B). The crossover is indeed coincident with the onset of a gradual increase in cell density in the bulk of the colony, as shown in Fig. 1C. Single cell analysis (below) confirms that mitotic rate in this ”pre-transition” regime does not decrease so that the sub-exponential expansion of the colony area is accounted for by increasing density alone.
Thus, it appears that increased cell density (and the associated decrease of average cell size) is a consequence of mechanical constraint imposed by the inability of the tissue at the periphery to expand fast enough to accommodate cell proliferation in the bulk. As cell density begins to increase, cell motility starts to decrease as shown in Fig. 2C (see also ref. [33]). The correlation length associated with the velocity field exhibits a peak which closely corresponds to the transition to epithelial cell morphology, which we shall define and discuss in detail below. The correlation length of motion subsequently decreases with time down to the size of a single cell (where the displacement is comparable to the optical resolution of the images), indicating that large scale swirls observed in the free growth regime are disappearing and cell motion is reducing to small scale fluctuations. The observed decrease in the root-mean-square velocity and the correlation length of cell motion can be understood in terms of a rapid increase in cell-substrate adhesion in the process of morphological transition.
Cell behavior in the center of a colony at the end of the free growth regime is similar to what is observed in confluent cell cultures that were seeded homogeneously, see Fig.2C,D.In homogeneously seeded cultures the space constraint is more severe and cell density increases more rapidly upon confluence, reaching the morphological transition soon after initiation of the culture. We note that panels C and D in Fig. 2 differ also in the substrate: glass and PDMS respectively (see Materials and Methods). Although the magnitude of the correlation length differs in the two cases, the qualitative behavior and the morphological transition are very similar.
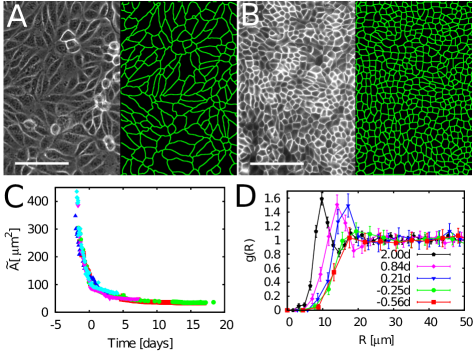
To investigate the long term evolution of cell size and density upon exit from the free growth regime we measured the average cell area (using digital image segmentation) over a period of 20 days. As shown in Fig.3C, average cell area decreases 10-fold over a 15 day period. In the same period, average cell height increases only by a factor of 2 (from 5-6 m to 12-15 m, see Supplementary Information Fig.S1D) thus indicating that cell volume decreases. Fig. 3C shows a rather sharp crossover from rapid to slow growth of cell density (and corresponding decrease of cell size). This crossover coincides with the transition in cell morphology illustrated by the comparison of panels A and B in Fig.3 and separates the ”pre-transition” and ”post-transition” stages of the contact inhibition process. The pre-transition transient is characterized by the gradual reduction of cell motility (Fig. 2) discussed above. The post-transition state is characterized by the absence of cell rearrangement, except through cell division. Mitotic rate decreases continuously in the post-transition stage (see Single cell analysis section) leading to arrest of cell proliferation independent of nutrient renewal. This “arrested” regime can last for weeks. (We monitored the tissue for 23 days without detecting any significant changes in the area distribution.) However, the state of proliferation arrest can be readily reversed by scratching the cell layer to create a free boundary [32], or by stretching the substrate along with the cell layer.
The morphological transition itself is readily quantified by the radial distribution function which measures conditional probability of finding a cell at a given distance from a reference cell (Fig. 3D). In the pre-transition stage, the distribution function exhibits an exclusion zone at distances comparable to the size of the nucleus, and is flat for larger distances, indicating a disordered system of non-overlapping cells. In the post-transition regime a peak and a trough emerge in the distribution function, corresponding to nearest and next-nearest neighbors. This indicates an increase in size homogeneity and the appearance of local ordering of cells within the tissue. Further quantitative characterization of the these regimes is provided by single cell tracking and analysis.
2.2 Single cell analysis
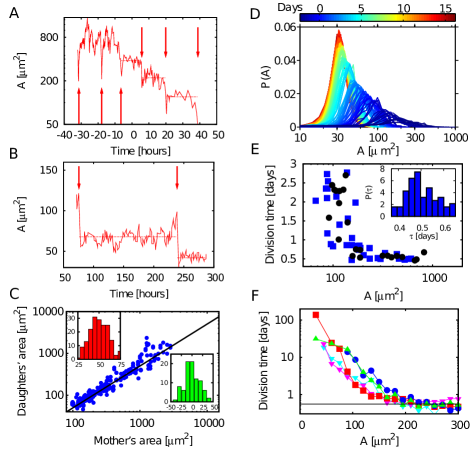
To further quantify cell behavior in the different regimes of tissue growth, we followed individual cells through the division process. In the free growth regime, each daughter cell grows back to the size of its mother cell, as shown in Fig. 4A. In contrast, in both pre- and post- transition regimes mitosis reduces cell area by approximately a factor of two without subsequent growth of daughter cells (Fig 4A, B). The prevalence of reductive division is demonstrated in Fig. 4C, which compares measured areas of mother and daughter cells. Combined area of daughter cells does not exceed the area of the ”mother” cell, independent of the area of the latter (Fig. 4C, inset). Thus, cells in both the pre- and post-transition regimes are ”incompressible” in the sense that new cells introduced through cell division do not achieve any expansion of their area at the expense of their neighbors.
The morphological transition coincides with an approximately 5-fold decrease in the average mitotic rate and a dramatic broadening of the distribution of cell cycle periods (Fig. 4E). Once the cell division time becomes significantly longer than a day, measuring mitotic rate by tracking individual cells becomes very difficult, necessitating a different strategy for measuring the dependence of mitotic rate on cell size. The latter, as we show next, can be deduced from a quantitative study of the temporal evolution of the cell area distribution.
To measure the distribution of cell area as a function of time in the post-transition regime, we performed a computerized segmentation of fluorescent images (using the MDCK-EcadGFP cell line) (Fig. 3B and Fig. 4D). Over a period of about 15 days following the morphological transition the average cell area decreases 6-fold. Cell size converges on a narrow, stationary size distribution centered about an average area of 35m2 (see SI, Fig. S1 for more details on cell morphology).
Because cell area in the post-transition phase is approximately constant between successive divisions (Fig. 4A-B), the dynamics of the cell area distribution is due solely to mitosis. (Rates of apoptosis, about 0.02 per day per cell, are negligible by comparison with mitosis.) Thus the difference in area distributions at two consecutive time points reflects loss of larger cells which upon division give rise each to a pair of cells at approximately half the size as represented by:
| (1) |
where denotes the expected number of cells with area, , at time and represents the average rate of division as a function of cell area. Fitting the observed temporal changes in cell area distribution to Eq. (1) allows us to determine the mitotic rate . The dependence of mitotic rate on cell size is shown in Fig. 4F. The result is consistent with the conclusion made on the basis of the single cell measurements, Fig. 4E: a rapid decrease in the mitotic rate once cell area falls below critical, which fits approximately the Hill function form: with and , where is the division rate in the free growth regime. The observed reductive nature of cell division and the dependence of mitotic rate on cell size together explain the dynamics of tissue density in the post-transition regime and the convergence towards proliferation arrest, thus capturing the dynamics of the ”contact inhibition” process.
2.3 A model of self-limiting growth of adherent cell monolayer
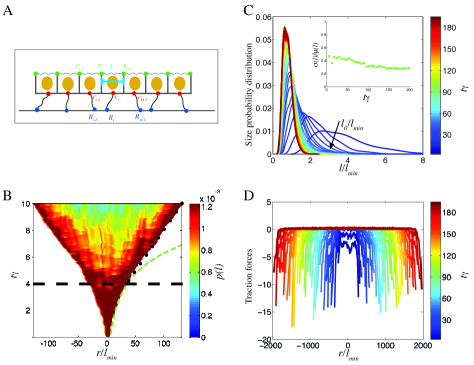
To illustrate our interpretation of the observed interplay between cellular growth, motility and colony expansion, we formulate and analyze a simple growth model for adherent epithelial tissues. We choose as a point of departure a one dimensional version of the ”vertex model” [47, 50] as depicted in Fig. 5A.The details of the model are described in the supplemental material. Briefly, we assume that cells, specified by their vertices and , form a connected tissue. The short time elastic response of cells has a Hooke’s law dependence (see SI Eq 2.1) on the difference between the current length of the cell, and the intrinsic preferred length . In addition cells interact with the substrate. To represent the effect of substrate adhesion and of cell motility we introduce for each cell an ”attachment point” , connected to the cell by a spring, and endowed with relaxational dynamics with friction and random Langevin driving force (see SI Eq 2.2). This (gaussian white) random force represents cell crawling, its variance defining motility. The force is assumed to average out to zero in the bulk, but not on the boundary where to represent the outward bias of the boundary cell motion we allow , where sets the maximal velocity.
The model also includes cell growth and proliferation. Cell growth is represented by allowing intrinsic cell size to increase with time. However, motivated by our experimental finding that cells in dense tissues don’t actively push on their neighbors, we allow to grow only if the cell is stretched by the surrounding tissue. Because stretching corresponds to we take to be a simple step function of with the threshold at zero. Cell division splits a cell into two, with intrinsic size of each daughter equal to of the mother. Guided by our experimental observations (Fig. 4) we make the rate of cell division explicitly dependent on cell size via which implements a ”size check point” () for cell proliferation.
The spatio-temporal growth dynamics of an initially small colony is shown in Fig. 5B. Independent of the specific parameters used in our simulations, we find two growth regimes: an initial exponential growth of the colony with uniform proliferation is followed by a linear growth regime with cell proliferation mainly on the margin of the colony. The maximal size of a freely proliferating colony and the critical time for cross over from exponential to sub-exponential growth may be obtained by the following argument. A patch consisting of proliferating cells increases its diameter with the instantaneous speed . This speed cannot exceed the maximal velocity of the interface , lest proliferating cells become compressed, as the colony becomes unable to spread fast enough to keep up with cell proliferation. The two velocities became equal at at which time the colony size is . (This 1D argument is readily generalized to 2D.)
The two growth regimes are manifest on the colony scale but are also reflected on a single cell level (Fig. 5B inset). Large cells on colony margins re-grow in size after division and then divide again. In higher density regions, cells undergo size reductive divisions until the division finally ceases. The temporal evolution of the cell sizes in the middle of the colony is shown in Fig. 5C. The difference in cell behavior arises, in our model, from the difference in their mechanical state. Motile cells in small colonies or on the periphery of a large colony are under tension and grow in size after division. In contrast, cells in the bulk of a large colony are ”boxed in” by their neighbors, and after each division reduce in size until they divide no more. Our assumptions that a) cells grow in size only under tension and b) cells do not exert compressive forces on each other, are closely related and result in a distribution of tensile stress across the tissue layer (see Figure 5D) that is consistent with the observations of Trepat et al [45].
3 Discussion
Quantitative observations of cell size, motion and division rate reported here help dissect the complex nature of the ”contact inhibition” phenotype. They reveal, for example, that free exponential growth can take place within cell colonies even after cells have been in contact for several days. Such a long delay between confluence and mitotic inhibition is particular to isolated, expanding colonies. Onset of mitotic inhibition occurs sooner in cell cultures seeded at uniform density, where confluence coincides with near complete occupation of the available area. We conclude that cell-cell contact is a necessary [37] but not sufficient condition for growth inhibition.
The data strongly suggests that inhibition of cell division follows the reduction in cell area imposed by mechanical constraints on tissue expansion [38, 37]. Interestingly, although average cell area starts to decrease in the motile pre-transition regime, the dependence of mitotic rate on cell area does not appear until the cells enter the static post-transition phase, at which point the rate of cell proliferation drops sharply. The cessation of cell motility and drop in mitotic rate coincide with a dramatic change in tissue morphology, as revealed by the radial distribution function of cells. The radial distribution function is thus an interesting, quantitative characterization of the state of the tissue and its abrupt change can serve to pin-point the morphological transition, which may be considered a key element of the mesenchymal-to-epithelial transition (MET).
Our study focused on the dependence of mitotic rate on cell area because the latter is directly measurable. Yet it is important to emphasize that the real trigger of intracellular signals responsible for the suppression of motility, inhibition of mitosis, and MET may be not cell size per se, but mechanical stress and deformation which are known to induce reorganization of focal adhesion, adherens junctions, and cytoskeleton [10, 39, 40, 41, 42].
It is widely believed that mechanical tension promotes cell division [43, 44]. Recent direct measurements by Trepat and coworkers [45] demonstrate that motile MDCK cells exert inward pointing traction on the substrate, implying that spreading cell colonies are under tension. These measurements correspond to MDCK colonies in what we refer to as the free growth regime. Combining their observations with ours suggests that the motile pre-transition regime and the morphological transition itself correspond to the gradual relief of tension and the onset of compression brought on by cell proliferation. It has been suggested (in the context of the problem of organ size determination) that mechanical compression may be providing an inhibitory signal for mitosis [46, 47, 48, 49]. The same hypothesis could then explain the observed inhibition of mitosis in the post-transition regime. If so, the trigger of MET would be the change from tensile to compressive stress acting locally within the cell layer. Our 1D model illustrates how this scenario can generate the observed behavior.
Our measurements also suggest that inhibition of cell division is a distinct single cell state rather than a global state induced by cell-cell signaling across the layer, as illustrated in Fig. 4E. In fact, confluent MDCK cell cultures with an average cell density corresponding to the morphological transition are often sufficiently heterogeneous in local cell density that highly motile cells and completely arrested cells coexist in the same colony. Thus contact inhibition is a local phenomenon, which calls into question the reliability of ”bulk assays” of the phenotype. Hence future experimental efforts focusing on molecular mechanisms underlying mitotic inhibition should be conducted with methods allowing single cell resolution. Such experiments, combined with techniques allowing in situ measurements of mechanical stress acting on cells would, we believe, finally lead to decisive understanding of the contact inhibition phenomenon.
4 Materials and Methods
Cell culture
MDCK-II cells and MDCK-Ecad-GFP were a gift from J. Nelson. Cells were cultured in
MEM (GIBCO, 11095-098) supplemented with Penicillin-Streptomycin and 5% FBS (Cellgro, 35-010-CV) at 37∘C and 5% CO2.
Time-lapse microscopy
All imaging was performed on an inverted microscope (Olympus IX-70) with a 20X/0.7NA/Ph2 objective.
Phase and fluorescence images were taken with, respectively, a halogen lamp and an LED (Luxeon LXHL-LB5C) and
recorded to disk using a CCD camera (QImaging, Retiga EXi). Mechanical shutters (Uniblitz VS25) in both illumination paths limited sample exposure to minimize phototoxicity. Stepper motors controlled the stage position and objective focus. The shutters, stepper motors and camera were controlled by a custom-written Labview program. Images were taken every 10 min (phase) and every 3h (fluorescence) for a given field of view.
Image analysis
Images were analyzed by using custom written Matlab programs. Positions of nuclei in the low cell density phase were determined from the phase contrast images, segmented semi-automatically.
In the static, high density regime, cells were identified by the fully automatic segmentation
of Ecad-GFP fluorescence images. Mean displacement measurements were made by cell tracking using a PIV-type analysis [36]. Colony profiles were obtained by extracting the boundary of the colony as a function of time
from the images using standard edge detection algorithms.
Numerical simulations The mathematical model underlying Fig. 5 and the method of simulation are described in the SI.
5 Acknowledgments
Authors acknowledge valuable interactions with T. Weimbs, M. Elowitz, D. Sprinzak, L. Peliti and M. Vergassola. AP, LH and PN were supported by NSF PHY05-51164. BIS acknowledges support of NSF PHY-08-44989.
References
- [1] Leevers SJ, McNeill H Controlling the size of organs and organisms. Curr Opin Cell Biol, 17 (2005), pp. 604–609.
- [2] Lecuit T, Le Goff L Orchestrating size and shape during morphogenesis. Nature, 450 (2007), pp. 189–192.
- [3] Alberts B, et al. (2008), Molecular biology of the cell (Garland Science).
- [4] Chaffer CL, Thompson EW, Williams ED Mesenchymal to epithelial transition in development and disease. Cells Tissues Organs, 185 (2007), pp. 7 – 19.
- [5] Guarino M, Micheli P, Pallotti F, Giordano F Pathological relevance of epithelial and mesenchymal phenotype plasticity Pathol Res Pract, 195 (1999), pp. 379–89.
- [6] Abercrombie M Contact inhibition: the phenomenon and its biological implications. Natl Cancer Inst Monogr, 26 (1967), pp. 249–277.
- [7] Castor LN Contact regulation of cell division in an epithelial-like cell line J Cell Physiol, 72 (1968), pp. 161–72.
- [8] Abercrombie M Contact inhibition in tissue culture. In Vitro, 6 (1970), pp. 128–142.
- [9] Martz E, Steinberg M The role of cell-cell contact in ”contact” inhibition of cell division: a review and new evidence. J. Cell Physiol., 79 (1972), pp. 189–210.
- [10] Huttenlocher A, et al. Integrin and cadherin synergy regulates contact inhibition of migration and motile activity J Cell Biol, 141 (1998), pp. 515–26.
- [11] Halbleib JM, Nelson WJ Cadherins in development: cell adhesion, sorting, and tissue morphogenesis. Genes Dev, 20 (2006), pp. 3199–3214.
- [12] Takai Y, Miyoshi J, Ikeda W, Ogita H Nectins and nectin-like molecules: roles in contact inhibition of cell movement and proliferation Nat Rev Mol Cell Biol, 9 (2008), pp. 603–15.
- [13] Zeng Q, Hong W The emerging role of the hippo pathway in cell contact inhibition, organ size control, and cancer development in mammals. Cancer Cell, 13 (2008), pp. 188–192.
- [14] Heckman CA Contact inhibition revisited J Cell Physiol, 220 (2009), pp. 574–5.
- [15] Jamora C, Fuchs E Intercellular adhesion, signalling and the cytoskeleton. Nat Cell Biol, 4 (2002), pp. E101–E108.
- [16] Yamada S, Pokutta S, Drees F, Weis WI, Nelson WJ Deconstructing the cadherin-catenin-actin complex Cell, 123 (2005), pp. 889–901.
- [17] Tamada M, Perez TD, Nelson WJ, Sheetz MP Two distinct modes of myosin assembly and dynamics during epithelial wound closure J Cell Biol, 176 (2007), pp. 27–33.
- [18] Tinkle CL, Pasolli HA, Stokes N, Fuchs E New insights into cadherin function in epidermal sheet formation and maintenance of tissue integrity Proc Natl Acad Sci U S A, 105 (2008), pp. 15405–10.
- [19] Orsulic S, Huber O, Aberle H, Arnold S, Kemler R E-cadherin binding prevents beta-catenin nuclear localization and beta-catenin/LEF-1-mediated transactivation. J Cell Sci, 112 ( Pt 8) (1999), pp. 1237–1245.
- [20] Gottardi CJ, Wong E, Gumbiner BM E-cadherin suppresses cellular transformation by inhibiting beta-catenin signaling in an adhesion-independent manner. J Cell Biol, 153 (2001), pp. 1049–1060.
- [21] Hamaratoglu F, et al. The tumour-suppressor genes NF2/Merlin and Expanded act through Hippo signalling to regulate cell proliferation and apoptosis Nat Cell Biol, 8 (2006), pp. 27–36.
- [22] Curto M, Cole BK, Lallemand D, Liu CH, McClatchey AI Contact-dependent inhibition of EGFR signaling by Nf2/Merlin. J. Cell Biol., 177 (2007), pp. 893 – 903.
- [23] Zhao B, et al. Inactivation of YAP oncoprotein by the Hippo pathway is involved in cell contact inhibition and tissue growth control. Genes Dev, 21 (2007), pp. 2747–2761.
- [24] Pan D Hippo signaling in organ size control. Genes Dev, 21 (2007), pp. 886 – 897.
- [25] Shixiong L, Edward R, Balkovetz D Evidence for ERK1/2 phosphorylation controlling contact inhibition of proliferation in Madin-Darby canine kidney epithelial cells. Am J Physiol Cell Physiol, 287 (2004), pp. C432–C439.
- [26] Matsubayashi Y, Ebisuya M, Honjoh S, Nishida E ERK activation propagates in epithelial cell sheets and regulates their migration during wound healing Curr Biol, 14 (2004), pp. 731–5.
- [27] Fournier AK, et al. Rac-dependent cyclin D1 gene expression regulated by cadherin- and integrin-mediated adhesion J Cell Sci, 121 (2008), pp. 226–33.
- [28] Minami Y, et al. Involvement of up-regulated Necl-5/Tage4/PVR/CD155 in the loss of contact inhibition in transformed NIH3T3 cells Biochem Biophys Res Commun, 352 (2007), pp. 856–60.
- [29] Sakisaka T, Ikeda W, Ogita H, Fujita N, Takai Y The roles of nectins in cell adhesions: cooperation with other cell adhesion molecules and growth factor receptors. Curr Opin Cell Biol, 19 (2007), pp. 593 – 602.
- [30] Gaush C.R., Hard W.L. ST Characterization of an established line of canine kidney cells (MDCK) Proceedings of the Society for Experimental Biology and Medicine, 122 (1966), pp. 931–5.
- [31] Rothen-Rutishauser B, Kramer SD, Braun A, Gunthert M, Wunderli-Allenspach H MDCK cell cultures as an epithelial in vitro model: cytoskeleton and tight junctions as indicators for the definition of age-related stages by confocal microscopy. Pharm Res, 15 (1998), pp. 964–971.
- [32] Poujade, M., et al. Collective migration of an epithelial monolayer in response to a model wound. Proc Natl Acad Sci U S A, 104 (2007), pp. 15988–15993.
- [33] Petitjean L, et al. Velocity fields in a collectively migrating epithelium Biophys J, 98 (2010), pp. 1790–1800.
- [34] Angelini TE, Hannezo E, Trepat X, Marquez M, Fredberg JJ, Weitz DA. Glass-like dynamics of collective cell migration. Proc Natl Acad Sci U S A. 108 (2011), pp. 4714–9.
- [35] Mark S, et al. Physical model of the dynamic instability in an expanding cell culture Biophys J, 98 (2010), pp. 361–70.
- [36] Raffel M., Willert Christian E. KJ (1998), Particle Image Velocimetry: A Practical Guide. (Springer).
- [37] Nelson CM, Chen CS Cell-cell signaling by direct contact increases cell proliferation via a PI3K-dependent signal FEBS Lett, 514 (2002), pp. 238–42.
- [38] Chen CS, Mrksich M, Huang S, Whitesides, G. M. & Ingber DE Geometric control of cell life and death Science, 276 (1997), pp. 1425–1428.
- [39] Yeung T, et al. Effects of substrate stiffness on cell morphology, cytoskeletal structure, and adhesion Cell Motil Cytoskeleton, 60 (2005), pp. 24–34.
- [40] Pugacheva EN, Roegiers F, Golemis EA Interdependence of cell attachment and cell cycle signaling Curr Opin Cell Biol, 18 (2006), pp. 507–15.
- [41] Margadant C, van Opstal A, Boonstra J Focal adhesion signaling and actin stress fibers are dispensable for progression through the ongoing cell cycle J Cell Sci, 120 (2007), pp. 66–76.
- [42] Janmey PA, McCulloch CA Cell mechanics: integrating cell responses to mechanical stimuli. Annu Rev Biomed Eng, 9 (2007), pp. 1–34.
- [43] Huang S, Ingber D The structural and mechanical complexity of cell-growth control. Nat Cell Biol., 1(5) (1999), pp. E131–138.
- [44] Schwartz MA, Assoian RK Integrins and cell proliferation: regulation of cyclin-dependent kinases via cytoplasmic signaling pathways J Cell Sci, 114 (2001), pp. 2553–60.
- [45] Trepat X, et al. Physical forces during collective cell migration Nature Physics, 5 (2009), p. 426.
- [46] Shraiman B Mechanical feedback as a possible regulator of tissue growth Proc. of the Natl. Acad. of Sci., 102 (2005), pp. 3318–3323.
- [47] Hufnagel L, Teleman AA, Rouault H, Cohen SM, Shraiman BI On the mechanism of wing size determination in fly development. Proc. Natl. Acad. Sci. USA, 104 (2007), pp. 3835 – 3840.
- [48] Aegerter-Wilmsen T, Aegerter CM, Hafen E, Basler K Model for the regulation of size in the wing imaginal disc of Drosophila Mech Dev, 124 (2007), pp. 318–26.
- [49] Rauzi M, Verant P, Lecuit T, Lenne PF Nature and anisotropy of cortical forces orienting Drosophila tissue morphogenesis. Nat Cell Biol, 10 (2008), pp. 1401–1410.
- [50] Farhadifar R, Roper JC, Aigouy B, Eaton S, Julicher F. The influence of cell mechanics, cell-cell interactions, and proliferation on epithelial packing. Curr Biol. 17 (2007), pp. 2095-104.
- [51] Lee YK, Rhodes WT Nonlinear image processing by a rotating kernel transformation Optics Letters, 15 (1990), pp. 1383–1385.
- [52] Jain AK, Farrokhnia F Unsupervised texture segmentation using Gabor filters Pattern Recognition, 24 (1991), pp. 1167–1186.
- [53] Ben-Israel A, Greville T (2003), Generalized inverses: theory and applications (Springer-Verlag).