Highly Non-linear Excitonic Zeeman Spin-Splitting in Composition-Engineered Artificial Atoms
Abstract
Non-linear Zeeman splitting of neutral excitons is observed in composition engineered InxGa1-xAs self-assembled quantum dots and its microscopic origin is explained. Eight-band simulations, performed using realistic dot parameters extracted from cross-sectional scanning tunneling microscopy, reveal that a quadratic contribution to the Zeeman energy originates from a spin dependent mixing of heavy and light hole orbital states in the dot. The dilute In-composition () and large lateral size ( nm) of the quantum dots investigated is shown to strongly enhance the non-linear excitonic Zeeman gap, providing a blueprint to enhance such magnetic non-linearities via growth engineering.
pacs:
Over the past decade, semiconductor quantum dots (QDs) have attracted significant interest, mainly due to the prospect for their use as integrated, electro-optically addressable quantum systems capable of storing and processing quantum information.Hanson et al. (2007) Quantum information processing requires the possibility for selective manipulation of a specific spin qubit within a quantum register. Such selective addressing using conventionally applied techniques, such as electron spin resonance,Koppens et al. (2006); Kroner et al. (2008) is rather challenging and can more conveniently be achieved with recently proposed electrical methods for spin control via Land g-tensor modulation.Pingenot et al. (2008); Andlauer and Vogl (2009); Pingenot et al. (2011) These approaches exploit tuning of the magnetic response by pushing the carrier envelope function into different regions of composition-engineered quantum dot nanostructures. Although electrical g-factor modulation has been successfully demonstrated in composition-graded AlGaAs quantum wells Salis et al. (2001) and vertically coupled InGaAs QD-molecules Doty et al. (2006) for several years, significant tuning of g-factors in individual self-assembled QDs was achieved only recently.Klotz et al. (2010); Jovanov et al. (2011) It was shown that a static electric field can be applied to quench the orbital angular momentum of the confined carriers, thus, modifying the g-factor.Pryor and Flatte (2006); Jovanov et al. (2011); van Bree et al. (2011) Since most of the experiments addressing the spin of confined carriers are performed in magnetic fields it is important to develop a microscopic understanding of how magnetic fields influence the quantum properties of the orbital states.
In this paper, we report strong magnetic field induced tuning of the exciton g-factor in composition-engineered InxGa1-xAs-GaAs self-assembled QDs. By comparing our experimental results with realistic eight-band simulations performed using QD size, shape and compositional information obtained from cross-sectional scanning tunneling microscopy (X-STM) we identify the origins of the magnetic field-dependence of the g-factor. Our results show that magnetic fields influence the excitonic g-factor via a mechanism that differs fundamentally from the case of static electric fields.Jovanov et al. (2011) In particular, the combination of the dilute In-composition () and comparatively large lateral size of the QDs leads to spin selective mixing of the lowest energy heavy hole (HH) and light hole (LH) orbital states, the strength of which is controlled by the external magnetic field. This gives rise to a quadratic Zeeman spin-splitting – a phenomenon previously observed only in semiconductor quantum wells and superlattices.Snelling et al. (1992); Warburton et al. (1993)
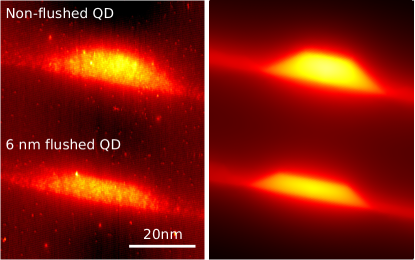
The samples investigated were electrically tunable GaAs n-i-Schottky photodiode structures into which two different types of QDs were embedded in the i-region. Both samples were produced using molecular beam epitaxy under nominally identical growth conditions. The first sample was grown utilizing the conventional Stranski-Krastanov growth, whilst in the second was utilized the partially covered island (PCI) ”In-flushing” method.Fafard et al. (1999) In the following, the sample containing the conventionally grown dots is referred to as non-flushed and, analogously, the sample containing the dots grown with the PCI technique as flushed. Both samples had a single layer of InxGa1-xAs self-assembled QDs grown in the nm thick -region, with a relatively high growth temperature of C. The QD layer consisted of ML of InxGa1-xAs with a nominal In-content of , deposited at a rate of ML/s and an As overpressure of mbar. The comparatively high growth temperature is expected to lead to an average In-content that is lower than the nominal , due to the combined effects of In-desorption,Heyn and Hansen (2003) interdiffusion with the GaAs matrix material and In segregation.Heyn and Hansen (2003) Comparison of our results with the simulations provides strong support for this expectation, showing that the strong tunability of is inextricably linked to a low average and the In-Ga alloy profile. For the flushed sample a growth interruption was included after the QDs had been partially capped with a nm thick GaAs layer. During this growth interruption the temperature was increased to C and kept constant for s. After this, the temperature was again lowered to the nominal growth temperature and an additional capping layer of GaAs was deposited. X-STM measurementsKeizer et al. (2010) revealed that the QDs from the high density regions of the wafers exhibit inhomogeneous In-composition profiles with a relatively large cross sectional size of nm and a height of nm. Typical topography X-STM image of two representative QDs is shown in the left panel of Fig. 1. Two types of QD composition profiles were successfully fitted to the measured outward relaxation of the cleaved facet: (i) linearly increasing In-concentration from the base to the apex of the dot and (ii) an inverted trumpet like In-distribution.Bruls et al. (2002); Offermans et al. (2005); Migliorato et al. (2002) The results from the later are shown in the right panel of Fig. 1. Here it should be noted that X-STM outward relaxation analysis can yield approximately similar concentration profiles that match to the surface relaxation and that the method itself does not provide an answer to which exact composition profile applies to the QDs studied.Mlinar et al. (2009) However, our experimental observations were found to be in good accord with theory only using the inverted trumpet In-distribution profile. The outward relaxation simulations revealed that for the conventionally grown non-flushed QD shown in the left panel of Fig. 1, the In-concentration in the apex is , reducing to at the base. In contrast, for the flushed sample the In-concentration at the apex is slightly lower () due to desorption of In during the flush step.
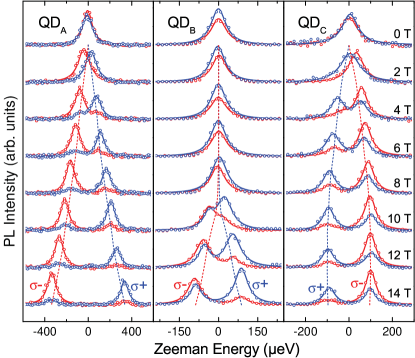
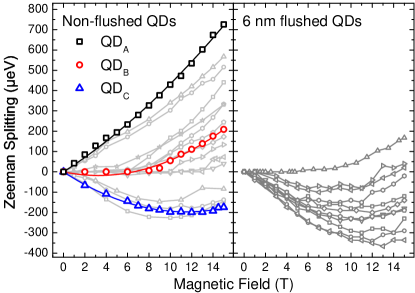
Optical characterization of the quantum dots was performed at low temperatures ( K) using a confocal microscope. The microscope was placed in a superconducting magnet enabling application of magnetic fields up to T in Faraday configuration. Typical photoluminescence (PL) spectra are presented in Fig. 2 from the neutral exciton of three representative QDs from the non-flushed sample. Many quantum dots () were studied and the results summarized in Fig. 2 illustrate the full range of behaviors observed. The polarization-resolved PL spectra from the different QDs labeled as , and reveal a substantially different behavior of the Zeeman splitting with increasing magnetic field. This can be clearly seen in the left panel of Fig. 3 where the Zeeman energy, defined as , is plotted for the three dots, as well as for many other dots. Positive, negative as well as zero excitonic Zeeman splittings were observed for different dots from the same sample.
We show below that the observed variations reflect the range of size and material composition fluctuations measured in our X-STM microscopy studies. A striking feature in the Zeeman splittings presented in the left panel of Fig. 3 is the non-linear dependence of on the magnetic field – a magnetic field-dependent exciton g-factor . The best fit to the Zeeman splittings of , and was obtained using quadratic function, as depicted by the solid lines presented in the left panel of Fig. 3. The solid lines for the other QDs interpolate the experimental data. We attribute the pronounced non-linear dependence of on B to a magnetic field-dependent hole g-factor , as will be explained in detail below.
While the excitonic Zeeman splittings of the QDs from the non-flushed sample revealed positive, negative and even zero B-field dependent excitonic g-factors, the dots investigated from the flushed sample mainly revealed negative, but also B-field dependent g-factors. This is clearly demonstrated by the negative and non-linear Zeeman splittings presented in the right panel of Fig. 3. The weaker variation in the Zeeman splittings observed for the dots from the flushed sample compared to the non-flushed sample arises from the reduced fluctuation in the dot height and the lower average In-concentration caused by the PCI growth process.
A weak non-linear dependence of the electron Zeeman splitting on the magnetic field was first observed for GaAs-AlGaAs quantum wells and superlattices at high magnetic fields.Dobers et al. (1988) Similar quadratic magnetic field dependencies of the hole Zeeman splitting have been found for GaAs-InGaAs superlattices and quantum wells and attributed to a magnetic field-induced mixing of HH and LH states.Warburton et al. (1993); Traynor et al. (1995); Kotlyar et al. (2001) In quantum wells subject to magnetic field applied parallel to the quantization axis, the hole wave function can be factorized in a product of quantum well states in the vertical direction and Landau levels in the lateral direction.Pidgeon and Brown (1966); Kotlyar et al. (2001) A magnetic field applied along the direction induces a coupling of the ground state with the and the bands with a strength that is proportional to and , respectively.Trebin et al. (1979) The operator acts in the growth direction and and are the Luttinger parameters.Luttinger (1956) Interestingly, the ground state couples only to the band via an interaction that varies as . Since for InxGa1-xAs alloys,Vurgaftman et al. (2001) the latter coupling is normally negligible and the ground state consequently has an almost pure character, independent of the magnetic field. It has been shown that the coupling of the ground state to the light hole bands leads to a heavy-hole g-factor that varies with the square of the in-plane wave vector, i.e. .Kotlyar et al. (2001) For quantum well Landau levels, varies linearly with leading to the experimentally observed quadratic Zeeman splitting. On the other hand, in small, strongly confined quantum dots varies with where is the dot diameter. As a result, the hole g-factor in strongly confined dots should, therefore, be unaffected by the magnetic field. Our results indicate that the large QDs with dilute In-composition produce effects that fall in a regime between the expectations for quantum wells () and quantum dots ( independent of B).
To understand the microscopic origin of the observed non-linear Zeeman splitting we performed a detailed three dimensional electronic structure calculation using the eight-band envelope function approximation. In order to include the B-field in our calculations we used the recently proposed gauge invariant symmetry adapted finite element method that accurately accounts for valence band couplings.Eissfeller and Vogl (2011) Strain fields were included using continuum elasticity theory and their impact on the electronic structure was fully taken into account via deformation potentials and the linear piezoelectric effect.Stier et al. (1999) The exchange interaction is expected to be of minor importance for the neutral exciton because of the large effective band gap of meV and the weak mixing of conduction- and valence-bands. The direct Coulomb interaction was found to have a negligible influence on the exciton g-factor and is, therefore, also neglected in our simulations.Jovanov et al. (2011)
To obtain quantitative results for the g-factor, a Luttinger-like eight band -model was employed, where remote-band contributions to the effective mass Hamiltonian and g-factors are included up to the order .Trebin et al. (1979) We modeled our QDs as having a truncated lens shape with a diameter varying from nm, a height of nm above the wetting layer (WL) and an inverse trumpet-like In-compositional profile.111, with , nm and nm The In-concentration of the InxGa1-xAs alloy was taken to be at the base and side of the dot increasing to at the dot apex.Migliorato et al. (2002) These parameters are consistent with the results of X-STM measurements (Fig. 1) performed on samples grown under the same conditions, from which we also determined the thickness and In-content of the wetting layer to be nm and , respectively.Keizer et al. (2010)
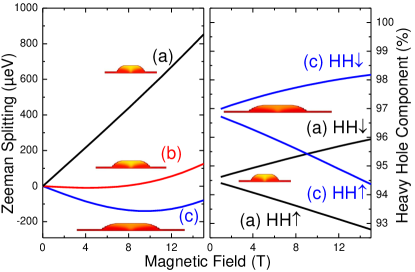
The left panel of Fig. 4 shows the calculated exciton Zeeman spin splitting as a function of the magnetic field for three model dots having different size and In-composition consistent with the range obtained from our X-STM measurements. These representative QDs have been chosen in order to reproduce the generic behavior of , , and , representing the range of behaviors observed in our experiments. The In-concentration decreases from the data marked (a) to (c) in Fig. 4 from = to =, whilst the lateral size increases from nm (a) to nm (c) to reproduce the experimentally observed exciton transition energies ( meV). The curve labeled (a) in the left panel of Fig. 4 shows an almost purely linear Zeeman splitting (B-field independent g-factor) whilst (c) exhibits a clear quadratic dependence. The model QD (b) shows an intermediate behavior between the linear and quadratic regimes. The quadratic dependence of the exciton Zeeman splitting stems entirely from the HH-like lowest energy orbital state in the valence band. For all QDs presented in Fig. 4 (a) to (c), the valence band Zeeman splitting varies quadratically with magnetic field, namely,
| (1) |
where the B-field is applied along the growth direction, is the Bohr magneton and, and are the linear and quadratic components of the hole g-factor, respectively.
These results indicate that the strong quadratic character of the hole Zeeman splitting ( T-1 for , T-1 for and T-1 for from Fig. 3) arises from the combination of the comparatively large diameter, small height and dilute In-content in the present dots. Firstly, the dot diameter is larger than the magnetic length over the entire range of B-fields of interest. Secondly, the low, almost homogeneous In-concentration induces only a weak confinement potential in the core of the QDs. As a result, the quantum states that are formed in magnetic field resemble D Landau levels and, consequently, the HH ground states behave in a manner similar to quantum wells. In addition, the small dot height of (including the wetting layer) introduces a strong field-induced coupling of - as in narrow quantum wells.Traynor et al. (1995) The quantum-well-like dependence of the Zeeman spin splitting on magnetic field is especially pronounced for the large, In-dilute QD (c) as shown in Fig. 4. Due to the QD shape, In-Ga alloy profile and inhomogeneous strain fields, the lowest energy HH orbital has a weak LH admixture at zero magnetic field. This is illustrated quantitatively in the right panel of Fig. 4. However, as the B-field increases, the LH-admixture of the -like ground state increases due to the field-induced LH-HH mixing alluded to above. In strong contrast, the -like ground state effectively decouples from the LH-bands and, thus, its LH character weakens with the magnetic field.
In summary, strongly magnetic field-dependent exciton g-factors were observed in InGaAs self-assembled QDs. The microscopic origin of non-linear Zeeman splitting was accounted for by eight-band simulations using realistic parameters (size and In-composition) that were directly extracted from X-STM measurements. The combined effect of dilute In-composition and relatively large dot lateral size was shown to result in strong field-induced mixing of the HH-LH orbital states in high magnetic fields. This mixing manifests itself as a quadratic variation of the hole Zeeman splitting on the external magnetic field. Similar effects are negligible for the electron and have previously been observed only in thin two dimensional systems.
This work is funded by the DFG via SFB-631, NIM, the TUM Institute for Advanced Study and the EU via SOLID.
References
- Hanson et al. (2007) R. Hanson, L. P. Kouwenhoven, J. R. Petta, S. Tarucha, and L. M. K. Vandersypen, Rev. Mod. Phys., 79, 1217 (2007).
- Koppens et al. (2006) F. H. L. Koppens, C. Buizert, K. J. Tielrooij, I. T. Vink, K. C. Nowack, T. Meunier, L. P. Kouwenhoven, and L. M. K. Vandersypen, Nature, 442, 766 (2006).
- Kroner et al. (2008) M. Kroner, K. M. Weiss, B. Biedermann, S. Seidl, S. Manus, A. W. Holleitner, A. Badolato, P. M. Petroff, B. D. Gerardot, R. J. Warburton, and K. Karrai, Phys. Rev. Lett., 100, 156803 (2008).
- Pingenot et al. (2008) J. Pingenot, C. E. Pryor, and M. E. Flatté, Appl. Phys. Lett., 92, 222502 (2008).
- Andlauer and Vogl (2009) T. Andlauer and P. Vogl, Phys. Rev. B, 79, 045307 (2009).
- Pingenot et al. (2011) J. Pingenot, C. E. Pryor, and M. E. Flatté, Phys. Rev. B, 84, 195403 (2011).
- Salis et al. (2001) G. Salis, Y. Kato, K. Ensslin, D. C. Driscoll, A. C. Gossard, and D. D. Awschalom, Nature, 414, 619 (2001).
- Doty et al. (2006) M. F. Doty, M. Scheibner, I. Ponomarev, E. A. Stinaff, A. S. Bracker, V. L. Korenev, T. L. Reinecke, and D. Gammon, Phys. Rev. Lett., 97, 197202 (2006).
- Klotz et al. (2010) F. Klotz, V. Jovanov, J. Kierig, E. C. Clark, D. Rudolph, D. Heiss, M. Bichler, G. Abstreiter, M. S. Brandt, and J. J. Finley, Appl. Phys. Lett., 96, 053113 (2010).
- Jovanov et al. (2011) V. Jovanov, T. Eissfeller, S. Kapfinger, E. C. Clark, F. Klotz, M. Bichler, J. G. Keizer, P. M. Koenraad, G. Abstreiter, and J. J. Finley, Phys. Rev. B, 83, R161303 (2011).
- Pryor and Flatte (2006) C. Pryor and M. Flatte, Phys. Rev. Lett., 96, 026804 (2006).
- van Bree et al. (2011) J. van Bree, A. Y. Silov, P. M. Koenraad, M. E. Flatté, and C. E. Pryor, ArXiv e-prints (2011), arXiv:1111.5439 [cond-mat.mes-hall] .
- Snelling et al. (1992) M. J. Snelling, E. Blackwood, C. J. McDonagh, R. T. Harley, and C. T. B. Foxon, Phys. Rev. B, 45, 3922 (1992).
- Warburton et al. (1993) R. J. Warburton, R. J. Nicholas, S. Sasaki, N. Miura, and K. Woodbridge, Phys. Rev. B, 48, 12323 (1993).
- Fafard et al. (1999) S. Fafard, Z. R. Wasilewski, C. N. Allen, D. Picard, M. Spanner, J. P. McCaffrey, and P. G. Piva, Phys. Rev. B, 59, 15368 (1999).
- Heyn and Hansen (2003) C. Heyn and W. Hansen, J. Cryst. Growth, 251, 140 (2003a).
- Heyn and Hansen (2003) C. Heyn and W. Hansen, J. Cryst. Growth, 251, 218 (2003b).
- Keizer et al. (2010) J. G. Keizer, E. Clark, M. Bichler, G. Abstreiter, J. Finley, and P. M. Koenraad, IOP Nanotechnology, 21, 215705 (2010).
- Bruls et al. (2002) D. M. Bruls, J. W. a. M. Vugs, P. M. Koenraad, H. W. M. Salemink, J. H. Wolter, M. Hopkinson, M. S. Skolnick, F. Long, and S. P. a. Gill, Appl. Phys. Lett., 81, 1708 (2002).
- Offermans et al. (2005) P. Offermans, P. M. Koenraad, J. H. Wolter, K. Pierz, M. Roy, and P. A. Maksym, Phys. Rev. B, 72, 165332 (2005).
- Migliorato et al. (2002) M. A. Migliorato, A. G. Cullis, M. Fearn, and J. H. Jefferson, Phys. Rev. B, 65, 115316 (2002).
- Mlinar et al. (2009) V. Mlinar, M. Bozkurt, J. M. Ulloa, M. Ediger, G. Bester, A. Badolato, P. M. Koenraad, R. J. Warburton, and A. Zunger, Phys. Rev. B, 80, 165425 (2009).
- Dobers et al. (1988) M. Dobers, K. v. Klitzing, and G. Weimann, Phys. Rev. B, 38, 5453 (1988).
- Traynor et al. (1995) N. J. Traynor, R. T. Harley, and R. J. Warburton, Phys. Rev. B, 51, 7361 (1995).
- Kotlyar et al. (2001) R. Kotlyar, T. L. Reinecke, M. Bayer, and A. Forchel, Phys. Rev. B, 63, 085310 (2001).
- Pidgeon and Brown (1966) C. R. Pidgeon and R. N. Brown, Phys. Rev., 146, 575 (1966).
- Trebin et al. (1979) H. Trebin, U. Rössler, and R. Ranvaud, Phys. Rev. B, 20, 686 (1979).
- Luttinger (1956) J. M. Luttinger, Phys. Rev., 102, 1030 (1956).
- Vurgaftman et al. (2001) I. Vurgaftman, J. R. Meyer, and L. R. Ram-Mohan, J. Appl. Phys., 89, 5815 (2001).
- Eissfeller and Vogl (2011) T. Eissfeller and P. Vogl, Phys. Rev. B, 84, 195122 (2011).
- Stier et al. (1999) O. Stier, M. Grundmann, and D. Bimberg, Phys. Rev. B, 59, 5688 (1999).
- Note (1) , with , nm and nm.