Multi-line Analysis of Stellar Spectra in the VO Environment
Abstract
Despite the lack of important functions supported only by legacy applications, the current VO-compatible tools have enough capabilities to allow powerful analysis of stellar spectra using both public archives and local proprietary data. We give examples of the possible multi-wavelength analysis of changes of profiles in different spectral lines using the current SSAP-compatible VO tools. The potential of future VO applications supporting more elaborate methods for stellar analysis is discussed as well.
keywords:
spectroscopy, spectral lines, Doppler Imaging, SSAP , Virtual Observatory1 Introduction
Astronomical spectroscopy uses a wide range of techniques with different level of complexity to achieve its final goal — to estimate the most precise and reliable information about celestial objects.
The scientific analysis of such spectra requires further processing by the variety of different methods. In certain studies a huge number of spectra has to be collected from different servers (in different spectral regions) and transformed into common units.
Accomplishing the multi-spectral analysis in VO environment may benefit from automatic aggregation of distributed archive resources, seamless on-the-fly data conversion, common interoperability of all tools (using PLASTIC or SAMP protocol) and powerful graphical visualisation of measured and derived quantities
2 Information obtained from spectroscopic analysis
The spectral lines give us a plenty of information about the physical nature and evolution of the given astronomical object. Examples of information estimated from different parameters of spectral lines are given below:
-
•
Position of line (wavelength)
-
–
Individual chemical elements present in the stellar atmosphere
-
–
Excitation / ionisation state of given element
-
–
Structure of molecules (e.g. rotational and vibrational states of molecules in IR regions)
-
–
Radial velocity (RV). If variable RV is measured, it may be the sign of binarity, sometimes even the estimation of orbital parameters is feasible
-
–
-
•
Line Shape
-
–
Stellar parameters (, , rotation)
-
–
Stellar activity (turbulence, granulation)
-
–
The profiles of core/wings can present different physics dependent on optical depth (e.g. limb darkening law)
-
–
Expansion of gas shells, winds (P Cyg profiles in Novae, double-peaked emission profiles in Be stars)
-
–
-
•
Line profile variability in time
-
–
Change of physical state (e.g trigger of of emission phase in Be stars, outbursts of novae)
-
–
Stellar spots (magnetic field structures, local overabundance - typical for Ap stars)
-
–
Pulsations ( Cep, RR Lyr, Miras)
-
–
Non radial pulsations (NRP) (e.g. Sct, Cep types)
-
–
Detection of extra-solar planets in spectra (bisector method makes small contributions in global line profile enlarged and variable during planet’s transit)
-
–
3 Spectra post-processing
The current VO applications using SSA protocol are very simple providing only the URL of the given dataset, so the client gets a whole (often quite large) file. The further processing is then done fully by the client which has to download all the relevant datasets and keep them in the memory or local storage. The real strength of the VO technology lies, however, in transferring part of the client’s work to the server, which usually runs on a powerful machine with fast connection to the data archives. The typical examples of commonly required post-processing of fully reduced spectra (at least in stellar astronomy) are given below:
-
•
Cutout services (selection of only certain spectral lines or regions within the given wavelength range)
-
•
Projection of multidimensional datasets (in 3D spectroscopy)
-
•
Rectification (normalisation) of continuum
-
•
Rebinning to given, usually equidistant grid of wavelengths (constant or )
-
•
(De)convolution of instrumental profile
-
•
Application of physical broadening functions (rotation, limb darkening)
-
•
Shift in radial velocity, application of heliocentric correction computed on server
-
•
Merging of individual echelle orders in a single spectrum
Although most of these post-processing methods can be implemented in a straightforward way, the rectification of continua may be a difficult problem, especially on echelle spectra.
4 Advanced spectral analysis
As the goal of the VO is to make easy and comfortable the physical analysis of a huge number of fully reduced (and post-processed) spectra in the environment of VO client (or web portal), the common recipes of spectral analysis have to be implemented as VO-compatible. The basic techniques were reviewed in Škoda (2008), we will briefly mention only the more complicated tasks of spectra analysis:
4.1 Dynamical spectrum
It is sometimes called the gray representation or trailed spectrum. The basic idea is to find the small time-dependent deviations of individual line profiles from an averaged one.
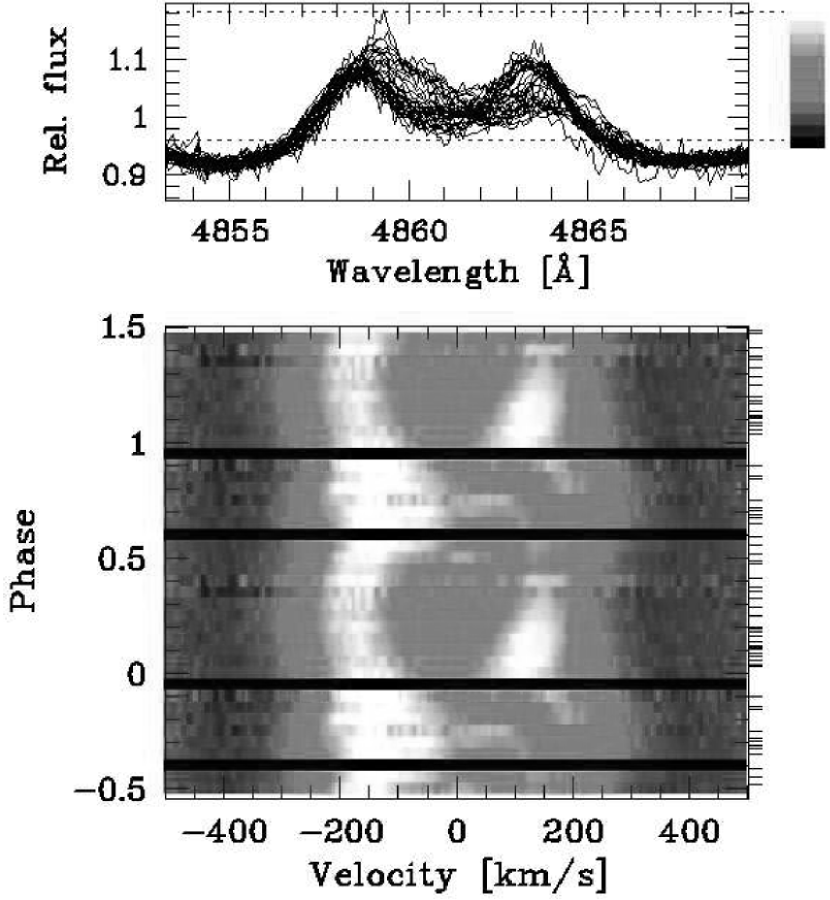
First the average of many high dispersion high SNR spectra (with removal of outliers) is prepared (called template spectrum). Then each individual spectrum in time series is either divided by the template (quotient spectrum) or the template is subtracted from it (the differential spectrum). The group of similar resulting intensities is given the same colour or level of gray. See Fig. 1. More examples may be found e.g. in de Jong et al. (1999), Maintz (2003) or Uytterhoeven (2004).
4.2 Measurement of radial velocity and higher moments of line profile
The one of the important information received from spectrum is the radial velocity (RV) of the object. From its changes the binarity can be revealed, or the possession of extrasolar planet. The combination of higher moments of line profile is a one of the possible ways of determination of non radial pulsation modes – numbers (Aerts et al., 1992).
4.3 Measurement of equivalent width
The Equivalent width (EW) of the spectral line gives the information about the number of absorbing or emitting atoms of given element. Emission lines by definition have negative EW. The changes in EW during time may bring about the information about the dynamic evolution of the target and may be subjected to period analysis.
4.4 Bisector analysis
It is a method describing quantitatively the tiny asymmetry or subtle changes in line profiles. The characteristic shape of bisector gives the information about turbulence fields (e.g. convection) in stellar photosphere, characterised by the value of micro-turbulent velocity (Gray, 1982, 2005) or about other processes causing the tiny profile asymmetry. It has been used successfully for searching of extrasolar planets (Povich et al., 2001) or in asteroseismology. It requires high resolution normalised spectra with extremely high SNR.
4.5 Period Analysis
Its aim is to find the hidden periods of variability of given object. Sometimes this period can be identified with some physical mechanism (e.g. orbital period of binaries, rotational modulation or pulsations). Wide range of objects show the multi-periodicity on various time scales (e.g. binary with pulsating components). Ones the suspected period is found, the data may be folded accordingly, plotted in circular phase corresponding to this period.
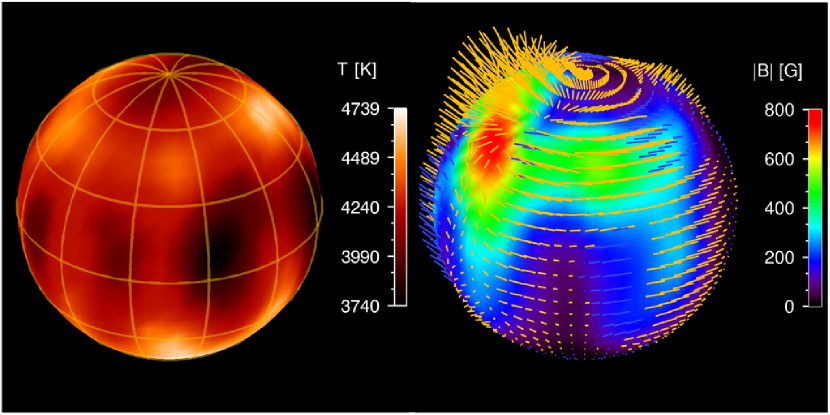
4.6 Doppler imaging
It was introduced by Vogt & Penrod (1983a) as a method allowing the surface mapping of stellar spots. First test were done on stars of RS CVn type and on Oph (Vogt & Penrod, 1983b). Works well on rapid rotators and needs a high resolution spectra with very high SNR (300–500). Tho whole rotational period should be covered well, better several times. When all the requirements are met, the map of surface features (spots, nodes of non radial pulsations) is obtained with very high accuracy. See the left panel of Fig. 2.
4.7 Zeeman Doppler Imaging
Quite complicated processing of spectra is required for study of stellar magnetic fields. The estimation of magnetic field from polarimetry using the Zeeman phenomenon involves the processing of long series of homogeneous spectra to be accomplished in parallel with extreme precision and requires again the information from synthetic models (simulation of Stokes parameters on simulated magnetic stars) The nice example is the model of II Peg by Strassmeier (2008). See the right panel of Fig. 2.
4.8 Spectra disentangling
This method allows to separate the spectra of individual stars in binary or multiple systems and simultaneously to find orbital parameters of the system, even in case of heavy blending of lines. It supposes the changes in line profile are caused only by combination of Doppler shifted components (no intrinsic variability of star). The best solution of orbital parameters and disentangled line profiles of individual stellar components are found by least square global minimisation. The method also enables the removal of the telluric lines with great precision. The good orbital coverage and the estimate of orbital parameters is required. Two approaches exist:
Wavelength space disentangling
developed by Bagnuolo & Gies (1991) and improved by
Simon & Sturm (1994). It needs a large memory to store sparse matrices,
requires large computing power. It is more straightforward to understand the
results and sources of errors.
Fourier space disentangling
introduced by Hadrava (1995, 1997) in program KOREL.
Another program available today (still based on KOREL ideas) is FDBINARY
(Ilijic et al., 2004). They work in Fourier space, and transform the
wavelengths into . They solve a small amount of linear
equations, so they are memory savvy and can be run on even small computer.
The method, however, requires perfect continuum fit.
4.9 Classification of stellar spectra
It used to be a very time-consuming and quite subjective method in the era of photographic plates (e.g. MKK classification). Today it has been done finding the minimal differences between a grid of template (or even synthetic) spectra and the examined one. The techniques of artificial intelligence (e.g. neural networks) may be very efficient, but the global optimisation using the minimisation seems to be more reliable with possibility of iterative control. An example of automatic classification engine for white dwarfs is described by Winter (2006).
5 Killer VO spectral applications
Here we give some scientific cases that may become the killer application forcing the wide astronomical community to use the VO tools with capabilities suggested above despite its current reluctance and hesitation:
-
•
Use VO to find all stars with emission in given line, find the time when it was in emission and plot the time evolution of its EW.
-
•
Use VO to get 1000 or more spectra of the given object, cut out regions around given lines, plot the lines, make a gray dynamic spectrum folded in time
-
•
The same, but fold by period clicked on interactive periodogram
-
•
Get the unknown lines identification of piece of spectra from theoretical observatory (SLAP - Simple line access protocol) having the line selection limited by pre-estimated temperature (using Saha equation)
-
•
Create light and radial velocity curve of a binary star for given period (estimated by other VO tool running in parallel and exchanging data over PLASTIC or SAMP)
-
•
Fit the grid of models () to the observed spectrum for many stars.
-
•
Extract detailed profiles of given spectral lines from archives of echelle spectra where every echelle order is kept separately (unmerged spectra in so called pixel-order space)
6 Conclusions
The large part of spectroscopic analysis today has been accomplished by several independent non VO-compatible legacy packages as the currently available VO clients supporting the SSA protocol can provide with only simple, mostly interactive capabilities on individual spectra.
The processing of large amount of spectra in a consistent way requires the simple post-processing (e.g. cutout or rebinning) services to be implemented on the server side
A lot of interesting physical information about astronomical objected can be obtained from only several short spectral ranges covering selected spectral lines. Dynamic behaviour of interesting objects can be estimated from the changes of line profiles as well as from period analysis of their moments (including equivalent width).
By introduction of modern VO-aware tools into the astronomical spectral analysis a remarkable increase of effectiveness of astronomical research can be achieved.
Acknowledgements
This work has been supported by grant GACR 205/06/0584 and EURO-VO DCA WP6 and AIDA funds. The Astronomical Institute Ondřejov is supported by project AV0Z10030501
References
- Aerts et al. (1992) Aerts, C., de Pauw, M., & Waelkens, C. 1992, A&A, 266, 294 17(4), 589
- Bagnuolo & Gies (1991) Bagnuolo, W. G., Jr., & Gies, D. R. 1991, ApJ, 376, 266
- de Jong et al. (1999) de Jong, J. A., Henrichs, H. F., Schrijvers, C., Gies, D. R., Telting, J. H., Kaper, L., & Zwarthoed, G. A. A. 1999, A&A, 345, 172
- Gray (1982) Gray, D. F. 1982, ApJ, 255, 200
- Gray (2005) Gray, D. F. 2005, PASP, 117, 711
- Hadrava (1995) Hadrava, P. 1995, A&AS, 114, 393
- Hadrava (1997) Hadrava, P. 1997, A&AS, 122, 581
- Ilijic et al. (2004) Ilijic, S., Hensberge, H., Pavlovski, K., & Freyhammer, L. M. 2004, in “Spectroscopically and Spatially Resolving the Components of the Close Binary Stars”, ASP Confer. Ser. 318, 111
- Maintz (2003) Maintz,M. 2003, Be binary stars with hot, compact companions, PhD. thesis, University of Heidelberg
- Povich et al. (2001) Povich, M. S., Giampapa, M. S., Valenti, J. A., Tilleman, T., Barden, S., Deming, D., Livingston, W. C., & Pilachowski, C. 2001, AJ, 121, 1136
- Simon & Sturm (1994) Simon, K. P., & Sturm, E. 1994, A&A, 281, 286
-
Strassmeier (2008)
Strassmeier, K., G., 2008, published at web
http://www.aip.de/groups/activity
/index.php/new-results/zemman-doppler
-imaging-results.html - Uytterhoeven (2004) Uytterhoeven, K. 2004, An observational study of line-profile variable B stars in multiple systems, PhD. thesis, KU Leuven
- Škoda (2008) Škoda, P. 2008, in Proceedings of the EURO-VO Workshop “Astronomical Spectroscopy and Virtual Observatory”, M. Guainazzi & P. Osuna, eds, ESA Publications, pp. 97–104
- Vogt & Penrod (1983a) Vogt, S. S., & Penrod, G. D. 1983a, PASP, 95, 565
- Vogt & Penrod (1983b) Vogt, S. S., & Penrod, G. D. 1983b, ApJ, 275, 661
- Winter (2006) Winter, Ch., 2006, PhD. thesis, Armagh Observatory, Northern Ireland