Observations of a high-mass protostar in NGC 7538 S
Abstract
We present high angular resolution continuum observations of the high-mass protostar NGC 7538S with BIMA and CARMA at 3 and 1.4 mm, VLA observations at 1.3, 2, 3.5 and 6 cm, and archive IRAC observations from the Spitzer Space Observatory, which detect the star at 4.5, 5.8, and 8 m. The star looks rather unremarkable in the mid-IR. The excellent positional agreement of the IRAC source with the VLA free-free emission, the OH, CH3OH, H2O masers, and the dust continuum confirms that this is the most luminous object in the NGC 7538 S core. The continuum emission at millimeter wavelengths is dominated by dust emission from the dense cold cloud core surrounding the protostar. Including all array configurations, the emission is dominated by an elliptical source with a size of 8′′ 3′′. If we filter out the extended emission we find three compact mm-sources inside the elliptical core. The strongest one, , coincides with the VLA/IRAC source and resolves into a double source at 1.4 mm, where we have sub-arcsecond resolution. The measured spectral index, , between 3 and 1.4 mm is 2.3, and steeper at longer wavelengths, suggesting a low dust emissivity or that the dust is optically thick. We argue that the dust in these accretion disks is optically thick and estimate a mass of an accretion disk or infalling envelope surrounding SA to be 60M⊙
Subject headings:
ISM: clouds – (stars:) circumstellar matter – stars: formation – stars: pre-main sequence – submillimeter1. Introduction
The giant molecular cloud southeast of the H II region NGC 7538, at a distance of 2.65 0.12 kpc (Moscadelli et al., 2009), is a well known site of high-mass star formation (Werner et al., 1979; Qiu et al., 2011). The early work by Werner et al. (1979) showed that star formation occurs in three activity centers, each of which maybe in a different evolutionary stage. The IRS 1 - 3 region dominates the luminosity (L 2 105 L⊙) and is the closest to the H II region. Each of the three infrared sources coincides with ultracompact H II regions. NGC 7538 harbors several young massive stars, of which at least three (IRS 1, IRS 9 and NGC 7538 S) drive powerful molecular outflows and appear to be surrounded by accretion disks.
The massive, 25 M⊙, young star IRS 1 appears to be the most massive member of a young embedded cluster (Qiu et al., 2011). It powers a collimated thermal jet (Sandell et al., 2009) and drives an extended molecular outflow (Corder, 2008; Qiu et al., 2011). IRS 1 is still heavily accreting (Corder, 2008; Qiu et al., 2011), i.e., it must be surrounded by an accretion disk. However, no one has yet managed to directly detect and image the disk.
NGC 7538 S, 85′′ south of IRS 1 is much colder, has lower luminosity (L 1.3 104 L⊙) and coincides with maser emission from OH, CH3OH, and H2O, but not any near-IR source, while the third region, IRS 9 (L 2 104 L⊙), was found to be associated with a bright near- and mid-infrared source. Submillimeter continuum imaging at high angular resolution starts to resolve the molecular cloud into a lumpy filamentary structure connecting the individual cores (Sandell & Sievers, 2004; Reid & Wilson, 2005). IRS 9 illuminates a prominent reflection nebulosity, has only weak free-free emission and drives an extreme high-velocity outflow seen almost pole on (Sandell, Goss & Wright, 2005). Sandell, Goss & Wright (2005) found several outflows in the vicinity of IRS 9, suggesting that there is also a young cluster surrounding IRS 9.
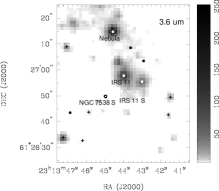
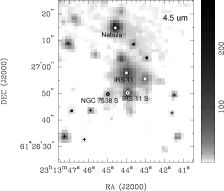
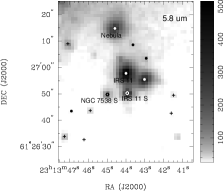
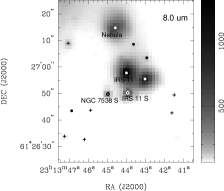
Figure 1 shows a large IRAC color image of NGC 7538 with the three major star forming regions labeled as IRS 1, IRS 9 and S, respectively. NGC7538 S is a faint, barely visible source at the outskirt of a small cluster of IR sources. NGC 7538 S is not seen at 3.6 m and is not even particularly red due to the strong absorption from the surrounding cloud (Section 4.1).
In this paper we focus on NGC 7538 S, which is the youngest high-mass forming core in NGC 7538 and located 80′′ south of IRS1(Sandell & Sievers, 2004). In this core there is a massive young star, which coincides with an OH 1665 MHz maser. Sandell, Wright & Forster (2003) observed the core with BIMA in 4 mm continuum and in HCO+ and H13CN J = with 37-resolution and found that it contained a high mass protostar surrounded by a large rotating circumstellar accretion disk driving a very compact molecular outflow. Follow-up observations by Sandell & Wright (2010) confirm that the star is surrounded by a rotating accretion disk, smaller than originally thought, and that it may have fragmented into several protostars.
We present new BIMA and CARMA observations from 72 GHz to 220 GHz of the NGC 7538 S region with spatial resolutions up to 1′′. These observations are combined with observations at 4.9, 8.5, 15 and 22.5 GHz from the VLA, and archive IRAC images (Mid-IR) from the Spitzer Space Telescope.

2. Observations
2.1. BIMA Observations
Observations were obtained with the 9-antenna BIMA array between 2002 and 2004 in the B, C, and D array configurations at 72 - 75, 86 - 89, 110, and 217 - 220 GHz. A summary of all the observations is given in Table 1, which also lists the angular resolution and the rms-noise level achieved at each frequency. Most of these observations were designed to study the chemistry and kinematics of the accretion disk, its outflow and the surrounding cold, dense cloud core. However, in each case we also included one or several 100 MHz wide bands selected to be free of line emission, thereby enabling us to measure the true continuum emission from the disk and the surrounding cloud. Table 1 therefore also lists the main molecules and isotopes targeted for each frequency setting.
At 72 - 75 GHz ( 4.1 mm) we combined the line–free data into a multifrequency synthesis (MFS) image. This image has less sensitivity than the rest of our continuum images, partly because not all receivers could be tuned to this frequency. Because of the low frequency the synthesized beam is also larger than at other frequencies (c.f. Table 1). At 89 GHz ( 3.4 mm), we combined additional data obtained in the B, C and D array configurations with the data reported by (Sandell, Wright & Forster, 2003) to produce deep high fidelity continuum images and spectral line images. These observations use the same correlator setup and were reduced as described by Sandell, Wright & Forster (2003).
The 110 GHz ( 2.7 mm) observations were the only ones completely dedicated to continuum observations. Here we made an MFS image from observations in the B & C array configurations using 16 100-MHz bands spanning over 3 GHz in the upper and lower sidebands of the 1st LO. At 220 GHz ( 1.4 mm) the only line-free bands were three 50 MHz windows in the lower sideband, but we had more tracks than at 110 GHz, and we were therefore still able to reach an acceptable noise level.
The data were reduced and imaged in a standard way using MIRIAD software (Sault, Teuben & Wright, 1995). The quasar 0102584 was used as phase calibrator and Mars and 3C 84 for flux and passband calibration. The uncertainty in the absolute amplitude scale is 20%, but we were able to improve the calibration by applying coherence corrections, see Appendix I. As a check on the flux density scale we also imaged IRS 1 and IRS 2, which are at the edge of the 2 arcmin primary beam in the 3 mm band. In this paper we discuss only the continuum data, which allow us to derive an estimate of the mass and the physical properties of the rotating disk surrounding the high–mass protostar NGC 7538 S. The spectral line observations and the physical properties of the HII regions associated with IRS 1, IRS 2 and IRS 3 will be discussed in Paper II.
2.2. CARMA Observations
Observations were obtained with the 15-antenna CARMA telescope in 2009 July - August in the C, D, and E antenna configurations at 220 GHz, and in the B-configuration in 2009 December and 2010 January at 89, 110, and 220 GHz. The CARMA observations used two 500 MHz bands in upper and lower sidebands of LO1 for a total continuum bandwidth of 2 GHz. The data were reduced and imaged in a standard way using MIRIAD software.
In these observations we centered the antenna pointing on IRS1 and NGC 7538 S to minimize the primary beam errors. Previous CARMA mosaic observations of NGC 7538 were designed to map the large scale molecular outflows; pointings were not centered on IRS1 or NGC 7538 S, and uncertainties in the primary beam patterns have prevented accurate deconvolution of the sidelobes of IRS1 from NGC 7538 S. Optical offset pointing was used to ensure accurate pointing of the CARMA antennas (Corder, 2010). Rapid switching between IRS1 and NGC 7538 S was used to calibrate NGC 7538 S. The quasar 0102584 was used as a gain and phase calibrator, and Uranus and MWC 349 for flux and passband calibration. The uncertainty in the absolute amplitude scale is 20%. The strong compact emission from IRS 1 was used to self calibrate the IRS 1 pointing.
Images were made at 89, 110 and 220 GHz bands by combining the two 500 MHz in upper and lower sidebands in a multifrequency synthesis mosiac. The mosaic images combine data with the three different primary beams for the 6.1 and 10.4 m CARMA antennas. The weighted mean observing frequencies from the MFS synthesis are 87.8, 111.1 and 222.2 GHz.
2.3. VLA Observations
Our observations with the Very Large Array (VLA) of the National Radio Astronomy Observatory (NRAO)111The NRAO is a facility of the National Science Foundation operated under cooperative agreement by Associated Universities, Inc. at 3.6 cm and reduction of unpublished 6 cm archive data were already described in Sandell, Goss & Wright (2005). Here we therefore only summarize the observations and the essential parameters needed to understand and interpret the results. The 3.6 cm observations were done in the BnA configuration on 2003 October 14. The on-source integration time was 1.3 hrs and the synthesized beam, full width half maximum (FWHM), was 122 047, (p.a. = 2∘). The rms-noise is 35 Jy beam-1. The peak flux density on NGC 7538 S is 2.3 mJy beam-1. The 6 cm observations were done in the B array on 1989 April 28. The on-source integration time was 2.7 hrs and the synthesized FWHM was 135 109 (p.a. 24∘) with an rms noise 100 Jy beam-1.
The 1.3 cm observations were carried out in the C configuration on 2004 March 19, pointing at NGC 7538 S. The integration time was 2.2 hrs. These observations were carried out in 4-IF continuum mode, with one 50 MHz bandwidth pair centered on 22.485 GHz and one 0.195 MHz bandwidth pair was centered on the strongest H2O maser component in NGC 7538 S, see e.g. Reid & Menten (1997) for a more thorough discussion of this procedure. In order to determine what maser feature was the strongest at the time of our observations, we had a short test run in 2004 February, which showed that the strongest velocity component was centered on Vlsr = 53.7 km s-1. On March 19, the flux density of this velocity component was 126 Jy beam-1. The initial calibration of the data was done using 2322509 as phase calibrator and 3C 48 as the flux density calibrator. We then used the strong maser feature as a phase calibration reference, which considerably increased the signal-to-noise in our final image. The synthesized beam FWHM for these observations was 094 078, (p.a. = 10∘). The rms-noise is 0.22 mJy beam-1. The peak flux density in the image is 3.3 mJy beam-1.
We also used a deep 2 cm observation from the VLA historical archive (project AM0487) conducted in the A array configuration on June 30, 1995. The observing frequency was 14.94 GHz, the bandwidth 50 MHz and the on source integration time 4.4 hrs. 3C 84 was used for flux calibration and 2229695 for phase calibration. The synthesized FWHM is 0139 0109 and the rms noise 80 Jy beam-1. Since the observations were centered on IRS 1, the emission from NGC 7538 S is attenuated by about a factor of two by the primary beam with a peak flux density of 0.4 mJy beam-1.
2.4. IRAC archive data from Spitzer
We have retrieved and analyzed images of NGC 7538 taken with the Infrared Array Camera (IRAC). IRAC is the mid-infrared camera on the Spitzer Space Telescope with four arrays at 3.6, 4.5, 5.8, and 8.0 m. Each array has 256 256 pixels with the same plate scale, 122 per pixel (Fazio & Megeath, 2004). The observations discussed here were obtained on December 23, 2003 as part of the GTO program P201 (G. Fazio) and observed in the High Dynamic Range (HDR) mode with a three point dither for each pointing. In the HDR mode images are taken with a short (0.6 s) and a long (12 s) integration to capture both bright and faint sources in each pointing. IRS 11 (Werner et al., 1979) is the brightest source in the NGC 7538 S field and it is saturated in the long integration exposures at 8 m, resulting in bandwidth effect trails222see the Infrared Array Camera Data Handbook, http://ssc.spitzer.caltech.edu/irac//dh/iracdatahandbook3.0.pdf for details.. At 8 m we therefore only use the short exposure images.
We processed both the short (0.6 s) and the long (12 s) integration basic calibrated data (BCD) IRAC frames in each channel using the artifact mitigation software developed by Sean Carey and created mosaics using MOPEX. The saturation of the 8 m images is particularly severe and could not be corrected for by the available tools. At 8 m we therefore used only the short integration images to identify sources and derive photometry. Because the whole NGC 7538 complex is associated with extensive nebulosity and strong PDR emission (Figure 1), all photometry was derived using PSF fitting with APEX, which is part of the MOPEX reduction package. For sources which APEX failed to detect at one or several wavelengths, we used the APEX user list option to supply the coordinates for the source to successfully derive a PSF fit.
We also retrieved and analyzed Spitzer MIPS images of NGC 7538. NGC 7538 S is not saturated at 24 micron, but IRS11 is and NGC 7538 S is blended with the saturated PSF from IRS11, so it is not possible to derive a flux. At 70 micron the whole region from IRS1 southward to IRS11 and NGC 7538 S is saturated and contains no information.
3. Results
3.1. CARMA
Figure 2 shows the deep 222 GHz B, C, D, and E array image of the NGC 7538 S cloud. The emission is dominated by the elliptical core, which at the western side has an extension to the northwest and a curved filamentary like structure to the southwest. The northwestern extension has one embedded sub-mm source, the H2O maser IRS 11S, which we detected at 111 and 222 GHz, but not at 88 GHz. In Figure 2 this source is seen as only one cyan contour level. The same source was also marginally detected by Corder (2008), who labeled it Sf. Corder (2008) also found two embedded protostars in the fainter core in the southwestern filament, which is labeled as BIMA source South in Table 2. The core is clearly seen in the deep 222 GHz image, but we did not have enough sensitivity in the B-array images to recover any embedded sources. At the highest resolution, 02, i.e. the 222.2 GHz B-array image (Figure 2 gray scale and Figure 8), the high-mass protostar, SA, has been resolved into two components: SA1, and SA2. The flux densities of the components were estimated from Gaussian fits. The positions, integrated fluxes, deconvolved sizes, and position angles are given in Table 2.

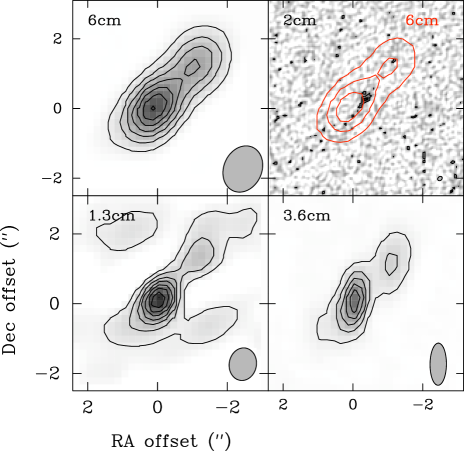
3.2. VLA
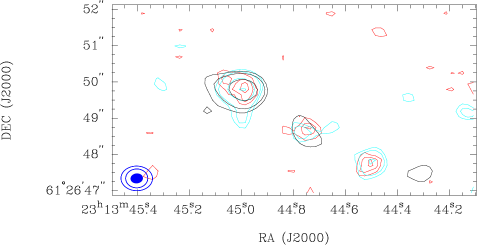
The VLA observations show a double source at 4.9, 8.5, and 22.5 GHz (Figure 3). The stronger component (a) is centered on NGC 7538 S, while the second component (b) is 15 to the north west at a position angle of 34∘. Both components appear elliptical, and Gaussian fits, when the components are sufficiently resolved (Table 2), show that their major axis is aligned in the same direction, suggesting that the two components are part of a collimated jet emanating from NGC 7538 S into the blue-shifted molecular outflow lobe powered by NGC 7538 S (Sandell, Wright & Forster, 2003). The high angular resolution image at 14.9 GHz confirms that the main component has the appearance of a highly collimated jet, although it does not have enough sensitivity to clearly detect the northwestern component, which in this picture would be the tip of the jet. Our deepest image, at 8.5 GHz, reveals a faint extension to the southwest, which we interpret as the counter jet traveling into the red-shifted outflow. A least squares fit to the sum of both components yields a spectral index of 0.14, which confirms that we are looking at wind-ionized free-free emission from a collimated jet, see e.g. Reynolds (1986).
3.3. BIMA
Images of NGC 7538 S at 74, 89, 109, and 217 GHz are shown in Figure 4. The 109 and 217 GHz images appear very similar and agree quite well with the deep CARMA image at 222 GHz, although the CARMA image recovers more of the extended emission in the cloud core (Fig. 2). Both the 109 and the 217 GHz image show extended dust emission with a size of 20′′. The emission is dominated by an elliptical core centered 1′′ - 2′′ southwest of NGC 7538 S with a position angle of 50∘. They also show two secondary peaks, one 5′′ west and 1′′ north, the other 5′′ west and 6′′ south of NGC 7538 S. The former coincides within errors with an H2O maser, which is also detected in all IRAC bands from 3.6 - 8 m, see Section 4.1. The H2O maser was also detected as source D in the CARMA B-array observations (Table 2). The southwestern core has no maser or IR counterpart. Corder (2008) identified two 3 mm sources in this core, but we have not been able to confirm them. The image at 74 GHz looks different. Here the emission is much fainter than at the higher frequencies and the spatial resolution is poorer. The difference in morphology is most likely due to poor image fidelity and sensitivity.

4. Discussion
4.1. The embedded stellar population - IRAC mid-IR imaging
Table 3 lists the positions of the 14 sources which were detected at 8 m within a 25′′ radius around NGC 7538 S. NGC 7538 S is detected at 4.5, 5.8, and 8 m, but not at 3.6 m. There is a small cluster of four sources centered on IRS 11, and another faint source east of NGC 7538 S. One of these sources, 5′′ west of NGC 7538 S coincides with an H2O maser and is also seen as a compact dust emission source in the BIMA continuum images at 109 and 217 GHz.
In Figure 6 we plot all the 14 sources from Table 3 in an IRAC color-color plot. Six of the 14 stars in Table 3 have low color indexes ([5.8]-[8.0] 0.4 and [3.6]-[4.5] 1.5) and are most likely reddened field stars. Two of them, J23134708+6127090 and J23134160+6126427, however, have [5.8]-[8.0] colors close to 0.4 and could therefore be more evolved pre-main sequence stars. The group of five, possibly six sources if we include J23134708+6127090, which lie to the northeast of NGC 7538 S all have [5.8]-[8.0] colors 0.7, and are clearly young pre-main sequence stars. The brightest star in the group is IRS 11, which does not have much foreground extinction, [3.6]-[4.5] 0, but IRS 11 has a strong 8 m excess, and is clearly a young star. IRS 11 S, the H2O maser, appears to be much more deeply embedded than IRS 11, and it has a similar [5.8]-[8.0] color as IRS 11. Just north west of this group is J23134459+6127148, which is surrounded by a prominent nebulosity at 5.8 and 8 m and is almost certainly a young object, but it may be associated with IRS 1 rather than with the NGC 7538 S cloud core. With NGC7538 S we therefore see a young cluster with at least six sources. Our deep 1 mm CARMA images show at least two additional sub-mm sources, which must be in an even earlier evolutionary stage, or more deeply embedded, since they have no mid-IR counterpart.

4.2. Millimeter wavelength dust emission

The VLA observations (Section 3.2) show that the free-free emission in the 3 mm band is predicted to be 8.5 mJy and therefore the emission at mm-wavelengths is completely dominated by dust emission. The free-free corrected flux densities obtained with BIMA and CARMA for the elliptical core are plotted in Figure 7 as a function of frequency. A least squares fit to the BIMA 89, 109 and 217 GHz data points give a spectral index, 2.45, which is surprisingly low. At 89 GHz, however, the elliptical core appears more centrally condensed and smaller (Table 2, Figure 4), i.e. the observations are not sensitive enough to recover the cold outer parts of the core. Since the 89 GHz observations do not sample the same volume of dust, it should therefore be excluded from the fit. Using only the flux densities from the best images, at 109 and 217 GHz, gives = 2.3 0.2. This corresponds to an apparent dust emissivity, 0.4, if we assume that the dust is isothermal with a dust temperature of 40 K. This is much lower than the dust emissivity derived by Sandell & Sievers (2004) from multi frequency single dish observations and appears suspiciously low.
We therefore also examined the CARMA data presented in Corder (2008) as well as the new CARMA data discussed in this paper. Corder finds a bigger size for the elliptical core, 12′′ 7′′, and we therefore cannot directly compare his results to our BIMA results. Instead we compare the quoted total fluxes for the NGC 7538 S cloud core, which is 0.218 0.007 Jy at 91.4GHz and 0.407 0.016 Jy at 108.1GHz. For the deep BCDE-array CARMA image at 222.2 GHz we find a total flux for the core of 1.9 0.2 Jy. A least squares fit to all three data points give = 2.5 0.4, which is very similar to what we found from the BIMA data. If we only use the 108 and 222 GHz we get = 2.2 0.4. Both the CARMA and the BIMA data (Fig. 7) show a steepening of the spectral index at long wavelengths. If we only use the data points at 91 and 108 GHz, we get = 3.8 0.5, which is consistent with thermal emission from dust. What these data therefore suggest is that the elliptical core may be so extreme, that the dust is already becoming optically thick at 1 mm. It is possible that what we observe is partly an instrumental effect, i.e., we filter out more emission at the highest frequencies. However, the same trend is seen in both our BIMA and our high fidelity CARMA data, which at 222.2 GHz have extremely good uv-coverage. This suggests that the trend is real and not just an artifact from different response in spatial sensitivity for an aperture synthesis array at different frequencies.
One would in fact expect the surrounding cloud core to have a steeper spectral index than the disk, because most studies find that the emissivity index 1.5 - 2 (Wright., 1992; Masi et al., 1995; Goldsmith, Bergin & Langer, 1997), i.e. corresponding to 4. The most likely explanation to the observed low spectral index of the surrounding cloud core is that the BIMA array filters out much more of extended emission at 217 GHz than at 109 GHz. The single dish observations by Sandell & Sievers (2004) shows that the cloud core surrounding NGC 7538 S has a radius of 30′′, while our interferometer observations find a core radius of less than half of this value, suggesting that most of the cloud core is resolved out in the BIMA observations. Both the 217 and 109 GHz observations recover spatial scales of 20′′; therefore the results for the disk surrounding NGC 7538 S should not be affected.
Although variations in the observed spectral index or dust emissivity are usually interpreted as changes in dust composition, such changes can also be caused by temperature and density gradients if the dust is optically thick. Beckwith & Sargent (1991) found that most T Tauri stars have spectral indeces between 2 - 3, which they showed to result from T Tauri stars having optically thick inner disks at millimeter wavelengths. Dutrey et al. (1996) did a more careful study using the IRAM interferometer at 2.7 mm and confirmed that all the stars in her sample had optically thick inner disks. It is now also well established that disks around more evolved T Tauri and Herbig Ae stars have low dust emissivity, but for these stars the drop in emissivity is due to grain growth, not optically thick dust (Natta et al., 2004).
For high-mass protostellar objects, single dish surveys show a much larger scatter in the observed dust emissivity. Williams, Fuller & Shridharan (2004) did a SCUBA 850 and 450 m survey of 68 protostellar objects and found a mean spectral index, = 2.6 0.4, corresponding to a dust emissivity, = 0.9 0.4, suggesting that the dust emissivity in high-mass protostellar objects has largely the same characteristics as dust disks surrounding T Tauri and Herbig Ae/Be stars. On the other hand, Hill et al. (2006), who did a similar survey using SCUBA observations at 850 and 450 m and SIMBA observations at 1.3 mm of 212 cold massive cloud cores, argue that their results are in agreement with a typical -value of 2, although their results show considerable scatter in the derived indeces to both higher and lower -values.
However, all published millimeter array observations of high-mass protostellar objects find consistently low values. For the accretion disk in IRAS , which is barely resolved in mm-continuum, Cesaroni et al. (2005) find a spectral index of 2.7 from a least squares fit to all published Plateau de Bure Interferometer (PdBI) data at frequencies 86.6, 90.6, 96.5, 217.6 and 239.6 GHz, the Owens Valley Radio Observatory (OVRO) millimeter wave array data at 113.2 and 228.1 GHz, and a 7 mm (42.8 GHz) data point from the VLA. Beuther, Schilke & Wyrowski (2004) were able to resolve the high mass protostellar core mm1 in IRAS with PdBI at 98.0 and 244.9 GHz, and found a spectral index of 3.4 at the outer edge of the core decreasing to values as low as 2.1 at the very center of the core. SMA observations of the massive protostellar core IRAS with the SMA at 217 and 354 GHz (Beuther et al., 2004) give similar results from analysis of fluxes in the u-v plane; 1.2 for large spatial scales, 5′′ - 10′′, and decreasing to 0.5 for small spatial scales, 27 - 36. Therefore, in the few cases where high-mass protostellar objects have been resolved, they all indicate that the dust emissivity drops towards the center of the core, which is believed to be dominated by emission from an accretion disk.
The high-mass protostellar objects discussed here are very young. It is therefore unlikely that grain growth would have had time to occur. A more plausible explanation for our low spectral index between 111 and 222 GHz is that the disks are optically thick at mm-wavelengths. Our results on NGC 7538 SA strongly favor high optical depth, rather than a population of large grains in the disk. It is clear from the BIMA images (Figure 4) that SA starts to dominate the emission of the elliptical core at the longest wavelengths, suggesting that one can now see the center of the accretion disk, which is expected to be hotter and denser than the surrounding infalling envelope. The center of the disk therefore dominates the emission.
If the disk is optically thick at 111 and 222 GHz, as our observations suggest, one would really need to model the dust emission in order to derive a disk mass. However, we can get an estimate of the disk mass by assuming that the dust emission is optically thin and roughly isothermal at the longest wavelength for which we have a good high resolution image, i.e. at 89.3 GHz. The total mass of gas and dust, M, can then be expressed as , where is the Planck function, is the dust temperature, D is the distance, and Sν is the integrated flux density at the frequency . Because of the uncertainty in dust emissivity, we do not want to use the Hildebrand (1983) dust opacity and extrapolate it from 250 m. Instead we have chosen to use the dust mass opacity, as tabulated by Ossenkopf & Henning (1994) at 1.3 mm. Their results suggest a dust mass opacity = 0.01 for gas densities of 108 cm-3 and grains with thick ice mantles, assuming the ratio of gas to dust mass is 100. These are the type of dust grains and densities that one would expect to have in the NGC 7538 S accretion disk. At frequency , the dust mass opacity is therefore . At 91.4 GHz we now obtain a dust mass opacity of 0.0025 if we assume = 1.5, which is probably appropriate for this case. If we further assume a dust temperature of 35 K, see below, a distance 2.65 kpc, and correct the observed flux density at 91.4 GHz for free-free emission ( 8.4 mJy) we obtain a disk mass 60 M⊙. This is about two times smaller than what was reported in Sandell, Wright & Forster (2003), but in reasonable agreement with the dynamical mass derived from H13CN , 20 M⊙ (Sandell, Goss & Wright, 2005). Since the size of the rotationally supported part of the disk is smaller than what we measure in continuum, we would expect the mass derived from continuum to be higher.
The assumption of a dust temperature of 35 K appears justified, see e.g. Sandell & Sievers (2004) and Sandell & Wright (2010). Zheng et al. (2001) find ammonia to be optically thick in the direction of NGC 7538 S with a temperature of 25 K. The temperature of the disk is likely to be less than 50 K, because then we would exceed the observed far infrared luminosity (Thronson & Harper, 1979). The dust temperature must be higher than 25 K, the temperature of the surrounding cloud core, since Sandell & Wright (2010) see some self-absorption in virtually every molecule seen in the disk. We can get another upper limit by looking at the analysis of the CH3CN transitions by Sandell & Wright (2010), where they derive a rotation temperature = 52 10 K. Since the low K-transitions are optically thick (Sandell & Wright, 2010), this leads to an overestimate of the rotational temperature. Contribution from the hot outflow will also raise the temperature. Therefore a dust temperature of 50 K appears to be a reasonable upper limit. If we were to increase the dust temperature to 50 K, this would change our mass estimate by less than a factor of two.
We can also do an order of magnitude estimate of the disk mass if we assume that the inner disk is optically thick at 1.4 mm using a geometrically thin disk model, which has been successfully used to analyze millimeter continuum emission from T Tauri stars (Beckwith et al., 1990; Dutrey et al., 1996). For an optically thin disk the optical depth, , where is dust mass opacity, is the surface density as a function of radius, r, and is the inclination angle of the disk ( = 90∘ for an edge on disk). The surface density is assumed to be a power law of radius, i.e. . If we define the disk radius, RD, as the radius where the optical depth, = 1, we can express the disk mass MD as
| (1) |
which, if we adopt a dust mass opacity of 0.009 at 217.3 GHz gives:
| (2) |
For an optically thick radius of 05 (1400 AU), roughly the size measured with CARMA, a relatively flat mass distribution, i.e, p = 1, and a disk inclination of 70∘ , we derive a mass of 50 M⊙ for the optically thick disk component, which is similar to what we estimate assuming the dust is optically thin at 91.4 GHz. The radius of the optically thick disk is probably somewhat smaller, so this is in fact an upper limit. In order to be able to determine the radius of the optically thick inner disk, it would be necessary to have observations with a resolution of 01 - 02 at at least three frequencies, one of which would need to be below 100 GHz. Such observations are now completely feasible.
We can estimate the dust opacity towards SA from our high resolution CARMA data. We need to subtract the emission from the thermal jet, which from the fit to our VLA data is predicted to be: 8.3, 8.6, and 9.5 mJy at 87.9, 111.1, and 222.2 GHz respectively. Fitting the three data points at the above frequencies on SA after subtracting the contribution from the free-free emission (here we add the flux for SA1 and SA2 at 222.2 GHz ,and the flux is assumed to be 47 mJy), we obtained a spectral index , assuming that all data points have a 10% error. This is a strong indication that the dust emission towards SA, our high mass protostar, must be optically thick. Because the dust emission from the NGC 7538SA disk is rather strong, it should now be possible to detect the dust emission with the eVLA both at 22 and 43 GHz, which would allow us to get a better estimate of the dust emissivity index.
4.3. Protostars NGC 7538 SA, SB, and SC
In addition to NGC 7538 SA, the high-resolution CARMA image (Figures 2 and 8) reveals two compact components (SB and SC) southwest of SA along the ridge of the accretion disk. No radio continuum emission from either of these two components has been detected with the VLA, suggesting that they are in an early protostellar phase. They may have been produced from fragmentation due to an instability of the material in the accretion disk of NGC 7538 S. They are the youngest members in the young stellar object (YSO) group of NGC 7538S including IRS sources detected with Spitzer. When the elliptical core started collapsing, SA was probably the first protostar to be surrounded by a rotating disk which already at that point was very dense and optically thick. We know that there is a velocity gradient over the whole elliptical core. Whether SB and SC fragmented from the massive, unstable disk around SA or whether the core fragmented into three protostars is unclear. It would be important to know but it is beyond the scope of our current paper. We see a very dense rotating core in which we find three extremely young protostars. SA has the luminosity and mass to form a star which may evolve into an early B or late O star. We do not know the luminosity of the other two, but judged on the mm flux (and they have no free-free), they are similar or slightly lower mass, so they probably will form mid– to late B-stars. The Bonner-Ebert mass estimated from the observed size and flux density at 225 GHz for dust temperatures 25 to 50 K are 0.01 to 0.1 M⊙ . The mass of the compact sources exceeds the Bonnor-Ebert mass, suggesting that they are local accretion centers (Bonnor, 1956; Ebert, 1957). Competitive accretion will make SA grow faster, so it will almost certainly be the most massive star. The accretion flow, within the errors, is centered on what we now know to be (Sandell & Wright, 2010). As we have shown in this paper this is also the most luminous and massive protostar in the elliptical core. It is therefore reasonable to assume that accretion will continue until forms an HII region, which then will halt the accretion onto the star. However, when this happens, and after the HII region expands, it will also halt the accretion onto the nearby protostars, so will remain the most massive star.
5. Conclusion
We used BIMA and CARMA observations of NGC 7538S at millimeter wavelengths, VLA observations at centimeter wavelengths, and Spizter in the mid IR bands, to study the high-mass star formation in this YSO group. The observations at millimeter wavelengths show that the continuum emission from NGC 7538 S is dominated by dust emission from an 8′′3′′source, elongated northeast to southwest, suggesting an accretion disk. The observed spectral index of implies that the dust in the disk either has a low dust emissivity or is optically thick.
The elliptical core breaks up into three mm sources. The brightest one, NGC 7538 SA, is extended and is possibly a binary. This mm source coincides with an OH 1665 MHz maser, a Class II methanol maser, a cluster of H2O maser spots, a faint free-free VLA jet, and a heavily obscured mid-IR source (Spitzer IRAC and IRS data). It drives a very compact bipolar outflow and appears to be surrounded by a rotating disk with a radius of 2′′ (Sandell & Wright, 2010). The other two 3 mm sources along the central ridge of the clump both appear point-like, although one of them may drive another compact outflow (Corder, 2008).
NGC 7538SA appears to be the most powerful source in this group and produces an ionized bipolar outflow, detected by the VLA, in a direction perpendicular to the major axis of the disk. At millimeter wavelengths, with sub-arcsec resulution, CARMA has resolved this source (SA) into two sub-components distributed along the major axis of the accretion disk. Located southwest of SA along the major axis of the accretion disk, two compact millimeter sources SB and SC are also detected at 222 GHz with CARMA, suggesting that they may be the results from the fragmentation of the accretion material in NGC 7538S. Along with the highly reddened objects detected with Spitzer at mid IR bands, the protostars detected at millimeter wavelengths suggest that NGC 7538S consists of a group of very young stellar objects in the NGC 7538 complex.
Appendix A Atmospheric decorrelation
The resolution and dynamic range of millimeter wavelength aperture synthesis images are limited by atmospheric turbulence. Atmospheric phase noise reduces the observed amplitudes by decorrelating the signals received at each antenna. In an analysis of data obtained with the Hat Creek interferometer at 86 GHz we found a baseline dependent phase structure function with a power law index, between 0.6 and 1.7. A slope close to the Kolmogorov 2D value 0.67 is obtained for longer baselines and stable weather conditions; the slope approaches the Kolmogorov 3D value 1.67 on short baselines and in turbulent weather. The rms pathlength on a 1 km baseline 1 mm, with a variation by a factor 4 over a few days even during good weather conditions Wright. (1996).
We estimated the atmospheric decorrelation for the NGC 7538 observations by analysing the phase calibrator data. The phase calibrator was observed at 25 minute intervals and samples the same atmospheric fluctuations as the observations of NGC7538. Although the short calibrator observations do not have sufficient signal-to-noise to determine the radio seeing for each observation of NGC7538, we can estimate the seeing over several hours from the observed calibrator phase scatter. Atmospheric phase noise increases the measured FWHM of the calibrator image. We calculated amplitude corrections for atmospheric decorrelation by fitting a circular Gaussian model to images of the phase calibrator.
The BIMA data for NGC 7538 were corrected by applying an amplitude correction for atmospheric coherence, by specifying the FWHM in arcsec, of a circular Gaussian fit to the phase calibrator(s) for the target source. The derived scaling factors from decorrelation loss were 1.11 at 74 GHz, 1.08 at 89 GHz, 1.50 at 109 GHz, and 1.18 at 217 GHz. The flux densities in Table 1 have been corrected for these decorrelation losses.
References
- Akabane et al. (1992) Akabane, K., Tsunekawa, S., Inoue, M., et al. 1992, PASJ, 44, 421
- Akabane & Kuno (2005) Akabane, K., & Kuno, N. 2005, A&A, 431, 183
- Argon et al. (2000) Argon, A. L., Reid, M. J., & Menten, K. M. 2000, ApJS, 129, 159
- Beckwith et al. (1990) Beckwith, S. V. W., Sargent, A. I., Chini, R. S., & Güsten, R. 1990, AJ, 99, 924
- Beckwith & Sargent (1991) Beckwith, S. V. W., & Sargent, A. I. 1991, ApJ, 381, 250
- Beuther et al. (2002a) Beuther, H., Schilke, P., Menten, K. M., et al. 2002a, ApJ, 566, 945
- Beuther et al. (2002) Beuther, H., Schilke, P., Sridharan, T. K., et al. 2002b, A&A, 383, 892
- Beuther, Schilke & Wyrowski (2004) Beuther, H., Schilke, P., & Wyrowski, F. 2004, ApJ, 615, 832
- Beuther et al. (2004) Beuther, H., Hunter, T. R., Zhang, Q., et al. 2004, ApJ, 616, L23
- Bonnor (1956) Bonnor, W. B. 1956, MNRAS, 116, 351
- Campbell (1984) Campbell, B. 1984, ApJ, 282, L27
- Cesaroni et al. (2005) Cesaroni, R., Neri, R., Olmi, L., Testi, L., et al. 2005, A&A, 434, 1039
- Corder (2008) Corder, S. 2008, Ph.D. thesis, California University of Technology
- Corder (2010) Corder, S.A., Wright, M.C.H., & Carpenter, J.M., 2010, Proc. SPIE, 7733, 115
- Dutrey et al. (1996) Dutrey, A., Guilloteau, S., Duvert, G., et al. 1996, A&A, 309, 493
- Ebert (1957) Ebert, R. 1957, ZAp, 42, 263
- Fazio & Megeath (2004) Fazio, G., & Megeath, T. 2004, Spitzer Proposal ID #201, 201
- Forster & Caswell (1989) Forster, J. R., & Caswell, J. L. 1989, A&A, 213, 339
- Gaume et al. (1995) Gaume, R. A., Goss, W. M., Dickel, H. R., Wilson, T. L., and Johnston, K. J. 1995, ApJ, 438, 776
- Goldsmith, Bergin & Langer (1997) Goldsmith, P. F., Bergin, E. A., & Lis, D. C. 1997, ApJ, 491, 615
- Hildebrand (1983) Hildebrand, R. H. 1983, QJRAS, 24,267
- Hill et al. (2006) Hill, T., Thompson, M. A., Burton, M. G., et al. 2006, MNRAS, 368, 1223
- Kameya et al. (1990) Kameya, O., Morita, K. -I., Kawabe, R., & Ishiguro, M. 1990, ApJ, 355, 562
- Lugo, Lizano & Garay (2004) Lugo, J., Lizano, S., & Garay, G. 2004, ApJ, 614, 807
- Masi et al. (1995) Masi, S., Aquilini, E., Boscaleri, A., et al. 1995, ApJ, 452, 253
- Mezger & Henderson (1967) Mezger, P. G., & Henderson, A. P. 1967, ApJ, 147, 471
- Moscadelli et al. (2009) Moscadelli, L., Reid, M. J., Menten, K. M., Brunthaler, A., Zheng, X. W., & Xu, Y. 2009, ApJ, 693, 406
- Natta et al. (2004) Natta, A., Testi, L., Neri, R., Shepherd, D. S., & Wilner, D. J. 2004, A&A, 416, 179
- Ossenkopf & Henning (1994) Ossenkopf, V., & Henning, Th. 1994, A&A, 291, 943
- Panagia (1973) Panagia, N. 1973, AJ, 78, 929
- Pestalozzi etal. (2006) Pestalozzi, M. R., Minier, V., Motte, F., & Conway, J. E. 2006, A&A, 448, L57
- Qiu et al. (2011) Qiu, K., Zhang, Q., & Menten, K. M. 2011, 728, 6
- Reid & Menten (1997) Reid, M. A., & Wilson, C. D. 2005, ApJ, 625, 891
- Reid & Wilson (2005) Reid, M. J., & Menten, K. M. 1997, ApJ, 476, 327
- Reynolds (1986) Reynolds, S. P. 1986, ApJ, 304, 713
- Sandell & Wright (2010) Sandell, G., &Wright, M. 2010, ApJ, 715, 919
- Sandell et al. (2009) Sandell, G., Goss, W. M., Wright, M., & Corder, S. 2009, ApJ, 699, L31
- Sandell, Goss & Wright (2005) Sandell, G., Goss, W. M., & Wright, M. 2005, ApJ, 621, 839
- Sandell & Sievers (2004) Sandell, G., & Sievers, A. 2004, ApJ, 600, 269
- Sandell, Wright & Forster (2003) Sandell, G., Wright, M., & Forster, J. R. 2003, ApJ, 590, L45
- Sault, Teuben & Wright (1995) Sault, R. J., Teuben, P. J., and Wright, M. C. H. 1995, in ASP Conf. Ser. 77: Astronomical Data Analysis Software and Systems IV, Eds. R.A. Shaw, H.E. Payne, and J.J.E. Hayes (Astronomical Society of the Pacific: San Francisco), p. 433
- Thronson & Harper (1979) Thronson, H. A., Jr, & Harper, D. A. 1979, ApJ, 230, 133
- van der Tak et al. (2000) van der Tak, F. F. S., van Dishoeck, E. F., Evans II, N. J., and Blake, G. A. 2000, ApJ, 537, 283
- Werner et al. (1979) Werner, M. W., Becklin, E. E., Gatley, I., Matthews, K., Neugebauer, G., & Wynn-Williams, C.G. 1979, MNRAS, 188, 463
- Williams, Fuller & Shridharan (2004) Williams, S. J., Fuller, G. A., & Sridharan, T. K. 2004, A&A, 417, 115
- Zheng et al. (2001) Zheng, X. -W., Zhang, Q., Ho, P. T. P., & Pratap, P. 2001, ApJ, 550, 301
- Wright. (1992) Wright, M., Sandell, G., Wilner, D. J., & Plambeck, R. L. 1992, ApJ, 393, 225
- Wright. (1996) Wright, M. C. H., 1996, PASP 108, 520
| Array Configuration | rest frequency | Bandwidth | Synthesized beam | rms | Observing dates |
|---|---|---|---|---|---|
| [GHz] | [MHz] | ′′ ′′ pa = ∘ | [mJy beam-1] | ||
| Frequency setting: DCN | |||||
| BCD | 73.9 | 400 | 9.1 7.2 78.9 | 3.7 | 22 Jul & 30 Oct 03, 07 Jan 04 |
| Frequency setting: HCO+ , H13CN , NH2D 1, SO | |||||
| BCD | 89.3 | 75 | 4.1 3.9 8.8 | 3.0 | 27 & 31 Jan ,& 03 May 02 |
| 09 Aug, 04 Nov, 11, 12, & 31 Dec 03 | |||||
| Frequency setting: Continuum | |||||
| BC | 109.0 | 800 | 3.5 3.2 89.5 | 0.54 | 27 Mar & 27 Apr 04 |
| Frequency setting: DCN , 13CO , CH3CN | |||||
| BC | 217.3 | 150 | 2.9 2.4 78.4 | 3.0 | 13 Oct 02, 19 Apr, 1 May 03 |
| 10, & 25 Oct 03, 3, & 5 Jan 04 | |||||
| Source | Frequency | (J2000.0) | (J2000.0) | aaAt the edge of the primary beam (correction factor 2). Flux density underestimated because the observations are not sensitive enough to pick up faint extended emission in a 01 beam. | p.a. | Sint |
|---|---|---|---|---|---|---|
| [GHz] | [] | [∘ ′ ′′] | [′′′′] | [∘] | [mJy] | |
| VLA Observations | ||||||
| NGC 7538 S a | 4.86 | 23 13 44.992 | 61 26 49.6 | 0.9 0.3 | 131 | 3.60 0.18 |
| b | 23 13 44.817 | 61 26 50.9 | 0.4 0.5 | 119 | 1.76 0.17 | |
| a | 8.46 | 23 13 44.971 | 61 26 49.7 | 0.6 0.1 | 137 | 3.25 0.09 |
| b | 23 13 44.822 | 61 26 50.8 | 0.9 0.4 | 136 | 1.69 0.11 | |
| c | 23 13 45.066 | 61 26 49.1 | 1.0 0.1 | 117 | 0.93 0.12 | |
| 14.9 | 23 13 44.953 | 61 26 49.8 | 0.45 0.24 | 36 | 4.4 0.4aaAt the edge of the primary beam (correction factor 2). Flux density underestimated because the observations are not sensitive enough to pick up faint extended emission in a 01 beam. | |
| a | 22.49 | 23 13 44.978 | 61 26 49.7 | 0.8 0.1 | 37 | 4.77 0.06 |
| b | 23 13 44.797 | 61 26 51.2 | 1.2 0.4 | 29 | 1.98 0.08 | |
| BIMA Observations | ||||||
| NGC 7538 S | 74.0 | 23 13 44.836 | 61 26 50.5 | point-sourcebbCompact or marginally resolved point-like source in 9′′ beam embedded in faint extended emission. | 39.34.0 | |
| 89.3 | 23 13 44.826 | 61 26 49.1 | 7.4 3.4 | 70 | 12112 | |
| 109.0 | 23 13 44.916 | 61 26 48.8 | 8.2 3.9 | 48 | 22020 | |
| 217.2 | 23 13 44.909 | 61 26 48.8 | 7.82.8 | 54 | 1020100 | |
| South | 109.0 | 23 13 44.20 | 61 26 42.2 | 5.12.8 | 224 | |
| 217.2 | 23 13 44.28 | 61 26 42.2 | 5.50.1 | 9610 | ||
| West | 109.0 | 23 13 44.12 | 61 26 50.2 | 6.72.7 | 251 | 303 |
| 217.2 | 23 13 44.18 | 61 26 50.0 | 4.32.8 | 573 | 15520 | |
| CARMA B-array Observations | ||||||
| SA2 | 222.2 | 23 13 45.057 | 61 26 50.1 | 0.490.33 | 35 | 26.1 |
| SA1 | 222.2 | 23 13 44.986 | 61 26 49.8 | 0.510.34 | -22 | 40.9 |
| SB | 222.2 | 23 13 44.750 | 61 26 48.8 | 36 | ||
| SC | 222.2 | 23 13 44.510 | 61 26 47.8 | 34 | ||
| SD | 222.2 | 23 13 43.88 | 61 26 50.2 | 5 | ||
| SA | 111.1 | 23 13 45.005 | 61 26 49.8 | 0.610.58 | 48.7 | 20.1 |
| SB | 111.1 | 23 13 44.750 | 61 26 48.8 | 5 | ||
| SC | 111.1 | 23 13 44.510 | 61 26 47.8 | 8 | ||
| SD | 111.1 | 23 13 43.878 | 61 26 50.2 | 1.790.68 | 20.1 | 17.5 |
| SA | 87.9 | 23 13 45.005 | 61 26 49.8 | 0.840.37 | 85.5 | 13.3 |
| SB | 87.9 | 23 13 44.750 | 61 26 48.8 | 3 | ||
| SC | 87.9 | 23 13 44.510 | 61 26 47.8 | 2 | ||
| SD | 87.9 | 23 13 43.88 | 61 26 52.2 | |||
| Source | (2000.0) | (2000.0) | S(3.6 m) | S(4.5 m) | S(5.8 m) | S(8 m) | Comment |
|---|---|---|---|---|---|---|---|
| [h m s] | [∘ ′ ′′] | [mJy] | [mJy] | [mJy] | [mJy] | ||
| J23134726+6126339 | 23 13 47.26 | 61 26 33.9 | 10.19 (0.04) | 12.61 (0.07) | 11.68 (0.09) | 13.6 (0.3) | field star |
| J23134708+6127090 | 23 13 47.08 | 61 27 09.0 | 5.07 (0.03) | 16.57 (0.17) | 20.60 (0.16) | 29.1 (0.4) | |
| J23134689+6126435 | 23 13 46.89 | 61 26 43.5 | 0.59 (0.01) | 2.24 (0.02) | 3.11 (0.05) | 3.5 (0.3) | field star |
| J23134622+6126327 | 23 13 46.22 | 61 26 32.7 | 0.81 (0.01) | 1.34 (0.02) | 1.57 (0.04) | 3.7 (0.3) | |
| J23134589+6126437 | 23 13 45.89 | 61 26 43.7 | 1.55 (0.01) | 4.99 (0.04) | 7.45 (0.06) | 7.0 (0.3) | field star |
| J23134498+6126498 | 23 13 44.98 | 61 26 49.8 | 0.05 | 5.06 (0.03) | 32.23 (0.15) | 62.8 (0.6) | NGC 7538 S |
| J23134459+6127148 | 23 13 44.59 | 61 27 14.8 | 48.09 (0.32) | 55.39 (0.27) | 102.8 (0.6) | 231.7 (1.1) | nebulous object |
| J23134400+6126578 | 23 13 44.00 | 61 26 57.8 | 30.67 (0.25) | 28.32 (0.14) | 170.8 (0.7) | 541.2 (2.1) | IRS 11 |
| J23134393+6126503 | 23 13 43.93 | 61 26 50.3 | 3.05 (0.02) | 27.64 (0.13) | 113.5 (0.4) | 237.8 (1.1) | IRS 11 S, H2O maser |
| J23134363+6126086 | 23 13 43.63 | 61 27 08.6 | 1.73 (0.04) | 5.94 (0.04) | 8.10 (0.09) | 25.9 (0.4) | |
| J23134302+6126555 | 23 13 43.02 | 61 26 55.5 | 14.70 (0.08) | 14.07 (0.07) | 109.9 (0.5) | 401.6 (1.6) | |
| J23134293+6127035 | 23 13 42.93 | 61 27 03.5 | 1.03 (0.01) | 4.84 (0.03) | 14.4 (0.1) | 37.8 (0.4) | |
| J23134160+6126427 | 23 13 41.60 | 61 26 42.7 | 1.91 (0.01) | 2.06 (0.02) | 2.73 (0.04) | 3.9 (0.3) | |
| J23134148+6126495 | 23 13 41.48 | 61 26 49.5 | 4.61 (0.03) | 5.41 (0.04) | 6.77 (0.07) | 8.5 (0.3) | field star |