A TYPE Ia SUPERNOVA AT REDSHIFT 1.55
IN HUBBLE SPACE TELESCOPE INFRARED OBSERVATIONS FROM CANDELS
Abstract
We report the discovery of a Type Ia supernova (SN Ia) at redshift with the infrared detector of the Wide Field Camera 3 (WFC3-IR) on the Hubble Space Telescope (HST). This object was discovered in CANDELS imaging data of the Hubble Ultra Deep Field, and followed as part of the CANDELS+CLASH Supernova project, comprising the SN search components from those two HST multi-cycle treasury programs. This is the highest redshift SN Ia with direct spectroscopic evidence for classification. It is also the first SN Ia at found and followed in the infrared, providing a full light curve in rest-frame optical bands. The classification and redshift are securely defined from a combination of multi-band and multi-epoch photometry of the SN, ground-based spectroscopy of the host galaxy, and WFC3-IR grism spectroscopy of both the SN and host. This object is the first of a projected sample at that will be discovered by the CANDELS and CLASH programs. The full CANDELS+CLASH SN Ia sample will enable unique tests for evolutionary effects that could arise due to differences in SN Ia progenitor systems as a function of redshift. This high- sample will also allow measurement of the SN Ia rate out to , providing a complementary constraint on SN Ia progenitor models.
Subject headings:
supernovae: general1. Introduction
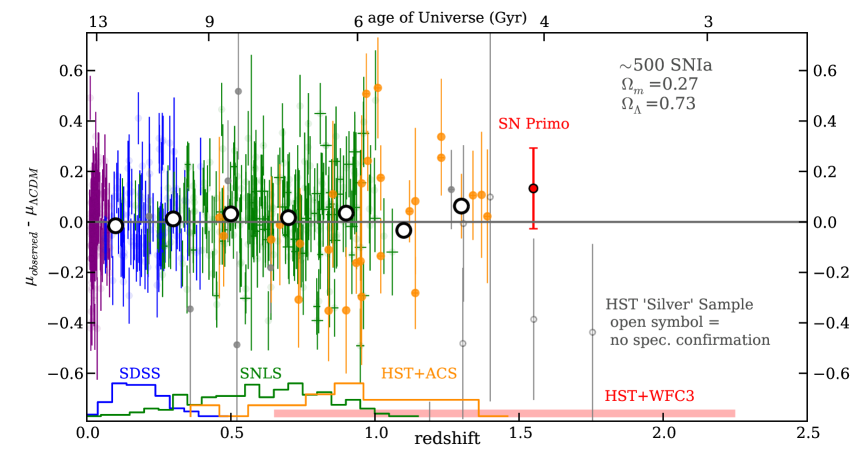
In their use as “standardizable” candles, Type Ia supernovae (SNe Ia) have become one of the pillars of modern observational cosmology. SNe Ia provided the first direct evidence for an accelerating expansion of the universe (Riess et al. 1998; Perlmutter et al. 1999), an effect now commonly attributed to “dark energy.” The present challenge for SN Ia cosmology is to understand the dark energy equation-of-state parameter, (Turner & White 1997; Caldwell et al. 1998; Garnavich et al. 1998). Recent surveys have targeted SNe Ia in one of three broad redshift () categories, illustrated in Figure 1 as follows.
- 1.
-
2.
Mid-. At intermediate redshifts () ground-based surveys such as ESSENCE, SDSS, and SNLS111ESSENCE: Equation of State: SupErNovae trace Cosmic Expansion; SDSS: Sloan Digital Sky Survey; SNLS: SuperNova Legacy Survey. have built up samples of hundreds of SNe Ia, testing models that assume a constant dark energy equation-of-state parameter, (Wood-Vasey et al. 2007; Kessler et al. 2009a; Sullivan et al. 2011). Current and future programs such as PTF, Pan-STARRS, DES, and LSST222PTF: the Palomar Transient Factory; Pan-STARRS: the Panoramic Survey Telescope And Rapid Response System; DES: The Dark Energy Survey; LSST: the Large Synoptic Survey Telescope. will provide samples with thousands of SNe Ia to .
-
3.
High-. The high-redshift range () has been populated almost exclusively by the Hubble Space Telescope (HST) with optical surveys using the Advanced Camera for Surveys (ACS) (Riess et al. 2004, 2007; Suzuki et al. 2011). These high-redshift objects reach back to the era of deceleration, enabling tests of models with a time-varying dark-energy component and checks against extreme SN Ia systematics. From the set of high- SNe Ia with measured light curves, the highest redshift on record is SN 1997ff at (Riess et al. 2001). This object was found in a passive host with an old stellar population, strongly suggesting it is a SN Ia. However, there is no reliable spectroscopic measurement of the SN, it has only a sparsely observed light curve, and the host redshift relies on a photo- and a questionable single-line detection. More and better observations are clearly needed before any inferences about the high- SN Ia population can be drawn.
Collectively, the SN Ia samples out to are consistent with a description of dark energy as the cosmological constant, (Riess et al. 2007; Hicken et al. 2009; Sullivan et al. 2011; Suzuki et al. 2011). Figure 1 shows a recent collection of SNe Ia from Conley et al. (2011), with distances plotted relative to the best-fit CDM cosmology. Histograms on the lower edge show the redshift range of each contributing survey. With the addition of the Wide Field Camera 3 infrared detector (WFC3-IR) on HST, a new window has been opened, allowing the detection of SNe Ia at . This very high redshift regime provides an excellent laboratory in which to test for possible evolution of the SN Ia population (Riess & Livio 2006).
The ratio of dark energy to matter density (now ) decreases with redshift as (e.g., Turner & White 1997), so the universe is matter dominated. Parameterizing the dark energy equation of state as , current observations find and (e.g., Sullivan et al. 2011). Changes in and consistent with these constraints would affect the observed SN Ia magnitudes at by less than 0.1 mag. This means that a larger deviation in the peak magnitudes of high- SNe would provide evidence for evolution of the SN Ia population.
Riess & Livio (2006) considered SN Ia progenitor models that predict a decrease in the observed SN Ia luminosity for objects with a higher initial progenitor mass, due to changes in the internal C/O ratio at the time of explosion (Domínguez et al. 2001; Hoeflich et al. 1998). If such an effect exists, then we might expect to see its signature becoming apparent in the SN Ia population at : the universe is 4 Gyr old at these redshifts, so low-mass stars are still on the main sequence, and thus the SN Ia progenitor stars must necessarily be more massive.
The high- SN Ia sample also provides an important constraint on progenitor models through the measurement of SN Ia rates. Binary stellar population synthesis combined with models of SN Ia explosion conditions can provide a prediction for the delay-time distribution (DTD) that should be observed for the SN Ia progenitor population at any redshift. Convolving this predicted DTD with measurements of the cosmic star formation rate produces a prediction for the SN Ia rate as a function of redshift. There is general consensus on the measured SN Ia rate out to , and these observations can be well matched by a number of progenitor models (see, e.g., Graur et al. 2011, hereafter G11, for a recent compilation). It is at that the SN Ia rate starts to be strongly dependent on the shape of the DTD, and the sparse measurements in this regime place only modest constraints on possible progenitor models (Strolger et al. 2004; Kuznetsova et al. 2008; Dahlen et al. 2008, hereafter D08; G11). Our WFC3-IR survey will provide a significant improvement in the high- SN Ia rate measurements by substantially increasing the spectroscopically confirmed SN Ia sample at .
Metallicity effects should be more pronounced in the SN Ia sample, and may be apparent in the observed SN Ia rates. Consider a SN Ia progenitor system with a long delay time of Gyr. For this object to be observed at , the formation redshift would have been , close to the redshift of reionization (Komatsu et al. 2011) when the universe was only Myr old. This long-delay SN would have been born in the first generation of stars, in an extremely metal-poor environment. The progenitor model of Hachisu et al. (1996) invokes a wind from the accreting white dwarf, and therefore requires a high metallicity as a prerequisite for SN Ia explosion. If this progenitor track accounts for a significant fraction of the SN Ia population, then the Hachisu et al. (1996) model would suggest that the observed SN Ia rate may be much lower at than otherwise expected.
| UT Date | MJD | Filter | Exp.Time | Vega Mag |
|---|---|---|---|---|
| 2010 Oct 10.9∗ | 55479.9 | F350LP | 434 | 27.20.2 |
| 2010 Aug 06.9 | 55414.9 | F125W | 11023 | 28.0 |
| 2010 Oct 10.9∗ | 55479.9 | F125W | 1006 | 24.370.05 |
| 2010 Nov 01.4 | 55501.4 | F125W | 406 | 24.480.06 |
| 2010 Nov 07.7 | 55507.7 | F125W | 1306 | 24.570.03 |
| 2010 Nov 21.2 | 55521.2 | F125W | 2512 | 24.940.04 |
| 2010 Nov 28.4 | 55528.4 | F125W | 1006 | 25.030.07 |
| 2010 Dec 05.2 | 55535.2 | F125W | 2512 | 25.620.07 |
| 2010 Dec 13.8 | 55543.8 | F125W | 5123 | 25.830.06 |
| 2011 Jan 17.7 | 55578.7 | F125W | 1006 | 27.000.40 |
| 2011 Mar 05.6 | 55625.6 | F125W | 1006 | 27.2 |
| 2010 Aug 08.4 | 55416.4 | F160W | 11024 | 27.0 |
| 2010 Sep 02.9 | 55441.9 | F160W | 10824 | 26.2 |
| 2010 Sep 14.9 | 55453.9 | F160W | 5512 | 25.390.15 |
| 2010 Oct 10.9∗ | 55479.9 | F160W | 1056 | 23.980.04 |
| 2010 Oct 26.6 | 55495.6 | F160W | 1206 | 24.270.05 |
| 2010 Nov 07.7 | 55507.7 | F160W | 1306 | 24.530.08 |
| 2010 Nov 22.9 | 55522.9 | F160W | 2512 | 24.610.06 |
| 2010 Nov 28.4 | 55528.4 | F160W | 956 | 24.570.11 |
| 2010 Dec 05.3 | 55535.3 | F160W | 2512 | 24.880.14 |
| 2011 Jan 17.7 | 55578.7 | F160W | 1106 | 25.720.19 |
| 2011 Mar 05.6 | 55625.6 | F160W | 1106 | 26.2 |
| 2010 Oct 26.7 | 55495.7 | G141 | 6618 | (grism obs) |
| 2010 Nov 01.5 | 55501.5 | G141 | 15036 | (grism obs) |
In this work we present an early result from the CANDELS+CLASH Supernova project (PI: Riess). This search-and-follow SN program is a composite survey combining the SN search components from two MCT programs, both of which were designed with cadence and filter choices that enable the detection of high-z SNe using the WFC3-IR detector. The Cosmic Assembly Near-infrared Deep Extragalactic Legacy Survey (CANDELS, PI: Faber & Ferguson) is a wide-field survey targeting five famous fields (GOODS-S, GOODS-N, COSMOS, EGS, and UDS). Observations and data processing for CANDELS are described by Grogin et al. (2011) and Koekemoer et al. (2011), respectively. The second MCT program is the Cluster Lensing And Supernova survey with Hubble (CLASH, PI: Postman), which is targeting 25 low-redshift galaxy clusters (Postman et al. 2011). The SNe contributing to the high-redshift SN Ia sample from CLASH will be located behind the clusters in the primary fields, or in the extended survey area provided by HST parallel observations. Both programs will span three years, from 2010 to 2013.
Within the first epoch of CANDELS imaging, the SN team discovered a high-z SN candidate, dubbed SN Primo. As described below, this object was later confirmed as a SN Ia at , making it the highest redshift SN Ia with a spectroscopic confirmation. The detection and follow-up observations of SN Primo are detailed in §2-6, and in §7 we explore the potential for this survey to extend the SN Ia sample to .
![[Uncaptioned image]](/html/1201.2470/assets/x3.png)
Color-magnitude diagram showing the F350LPF160W color diagnostic, used in the initial identification of SN Primo as a high- SN Ia candidate. The SNANA light curve simulator (Kessler et al. 2009b) was used to generate 10,000 SNe at , with colors and magnitudes measured at times between 5 days before and 10 days after peak brightness, in the observer frame. Relative frequencies for each subclass were drawn from Li et al. (2011) (24% Ia, 19% Ibc, 57% II) and luminosity functions follow Richardson et al. (2002), Kiewe et al. (2012), and Drout et al. (2011). The shaded contours and corresponding histograms show the full extent of each SN subclass (i.e., they contain 100% of the simulated objects for each class). Type II SNe are shown in blue, Type Ibc in green, and Type Ia in red. The solid red line in the central figure demarcates the region containing of the simulated SNe Ia. The SN Ia simulation uses a parameterized model based on the SALT2 light curve fitter (Guy et al. 2007). CC SNe are simulated using 44 spectrophotometric templates that are based on well-observed low- CC SNe (hence the appearance of stripes and gaps in the CC SN contours).
![[Uncaptioned image]](/html/1201.2470/assets/x4.png)
The light curve width parameter for the same simulated SNe shown in Fig. 1. The parameter measures the increase in observed magnitude from the peak to 15 rest-frame days after peak, and is tightly correlated with absolute magnitude for SNe Ia (Phillips 1993). For each simulated SN we measure in both F125W () and F160W (), and plot contours containing the entire sample in the main panel (blue for Type II, green for Type Ibc, and red for Type Ia). Histograms of the one-dimensional projections are shown in the top and side panels. As in Fig. 1, the CC SN contours show spotty coverage of the parameter space, because they are based on 44 discrete templates, rather than a single parameterized light curve model as used for the SNe Ia.
2. Discovery and Follow-up
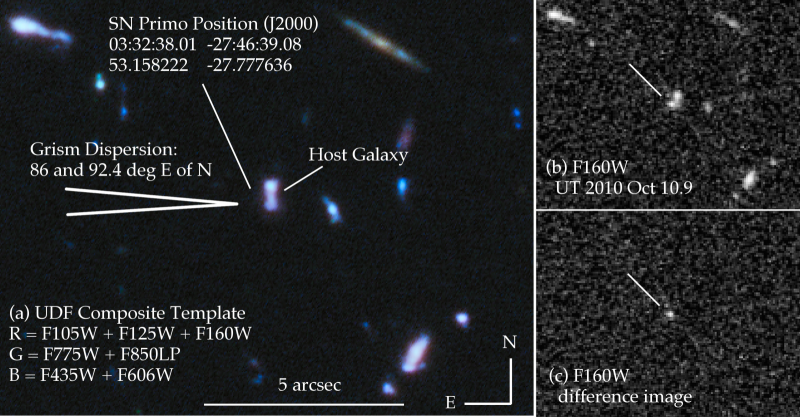
SN Primo was found in CANDELS search images of the GOODS-S field collected on 2010 October 10 (UT dates are used throughout this paper). It was detected in both WFC3-IR search filters (F125W = and F160W = ) as well as the broad “white light” filter of WFC3-UVIS (F350LP = ); see Grogin et al. (2011) for a complete description of the CANDELS observations. The use of F350LP to discriminate core-collapse SNe (CC SNe) from SNe Ia is presented in §3. It was located within the 11.5 arcmin2 Hubble Ultra Deep Field (HUDF) region, which had been recently observed using WFC3-IR under a Cycle 17 HST program (GO-11563, PI: Illingworth). SN Primo was found in a search by eye of difference images that were constructed by subtracting a deep template HUDF image from the October 10 CANDELS images, as shown in Figure 2.
After discovery in the CANDELS imaging data, SN Primo was recovered in prior F160W observations from HST program GO-11563 taken in September, 2010 (see Table 1). Using the non-detection on UT Sep 02.9 and the clear detection on Sept 14.9 as a guide, we made an initial estimate that the explosion occurred between UT Aug 27 and Sep 14. This would make SN Primo 26-45 observer-frame days past explosion at the time of discovery on Oct 10.9.
The host-galaxy photo- was estimated at (§4), meaning that the SN was 10-18 rest-frame days past explosion. If SN Primo was a normal SN from one of the primary sub-classes, this indicated that it was close to peak brightness. Comparing the magnitudes and colors of SN Primo to simulations based on low- templates, SN Primo was found to be consistent with a SN Ia near peak at (§3).
These observations gave us an early indication that this object was very likely to be a SN Ia, so we triggered target of opportunity follow-up observations from the ground with the Very Large Telescope (VLT) and from space with HST. The VLT observations (Frederiksen et al. 2012, in preparation) revealed a spectroscopic redshift of the host galaxy consistent with the photo-z (§4). The HST observations built up the infrared (IR) light curve (§5) and also provided a grism spectrum of both the SN and its host galaxy (§6).
3. Color
A key improvement for the CANDELS and CLASH programs over past HST SN surveys is the availability of the F350LP filter on the WFC3-UVIS camera. This very broad “white light” filter transmits all optical light, and is therefore extremely efficient. In an exposure of just 400 s we can reach a signal-to-noise ratio (S/N) of 20 for point sources as faint as Vega magnitude 25.4. For a SN at the F350LP filter samples the rest-frame ultraviolet, blueward of 3600 Å, offering a stark contrast between mostly blue CC SNe and much redder SNe Ia.
With the date of peak brightness well defined, the F350LPF160W color-magnitude measurement from the discovery epoch provides an important early classification indicator, as shown in Figure 1. Using the known redshift of the host galaxy (§4), we use the SNANA simulation tools (Kessler et al. 2009b) to generate 10,000 simulated SNe of Types Ia, Ib/c, and II. The CC SN simulation is limited by the dearth of well-measured light curve templates at low redshift. Whereas the SN Ia simulation is defined by a parameterized model with strong empirical constraints, our simulated CC SNe are based on just 44 low- templates. This deficiency is reflected in the patchy and streaky CC SN contours in both Figure 1 and 1. Nevertheless, the SNANA simulation provides the most complete picture of the CC SN population possible with currently available data.
The observed F350LPF160W color for SN Primo at peak brightness is consistent with a Type Ia SN at , but could also be matched by CC SN templates at that redshift. The F160W () magnitude is more difficult to reconcile with a core-collapse model. One does not want to use a strong prior on the apparent magnitude of high- SNe as the basis for classification, as cosmological effects could have an impact on observed magnitudes. However, SN Primo is observed at a full 2 mag brighter than the brightest Type II SN of similar color. The less common Type Ib/c SNe come closer to matching SN Primo’s F160W magnitude, but only in the case of the very rare over-luminous SNe Ib/c, which comprise less than 4% of the total CC SN population at low redshift (Arcavi et al. 2010; Smith et al. 2011). The rate of over-luminous CC SNe may be enhanced in low-metallicity environments (see Modjaz 2011, for a recent review). This could make these objects more common at high redshift, although estimates suggest that they will still comprise just a few percent of the total CC SN population.
Thus, SN Primo’s position on the color-magnitude diagram provides good evidence for an initial classification as a SN Ia. After making this assessment, follow-up observations were then executed to fill out the IR light curve and measure the SN spectrum, providing further diagnostics to confirm or refute this classification.
4. Host Galaxy
As shown in Figure 2(b), SN Primo appeared very close to a relatively bright galaxy in the CANDELS IR imaging. As can be seen in the very deep multi-band imaging of the HUDF in Figure 2(a), this galaxy has a bright core on its northern extreme, and a fainter arm extending southward. With no other detectable objects within 15, we made an initial assumption that this object was in fact SN Primo’s host galaxy. However, it is possible that the faint southern arm representing a foreground or background galaxy. To examine this possibility, we measured isophotal photometry, treating the two components of the galaxy as separate objects. The colors of the core are identical to the southern arm to within the measurement error (0.04 mag) across seven optical and IR bands from ACS and WFC3.
Immediately after discovery, the photometric redshift (photo-) of a SN host galaxy is one of the most important tools for segregating targets of interest from impostor transients (e.g., active galactic nuclei, CC SNe at lower redshifts, etc.). The probability distribution of the photo- for SN Primo’s host is sharply peaked at by the extremely deep existing HST data in the HUDF, with a 68% confidence range of and a 95% confidence range . The principal constraint comes from the offset between optical photometry and IR photometry, since the 4000 Å break falls between the optical and IR at . This emphasizes the importance of accurate IR photometry for determining the host galaxy photo- at .
A VLT observation on UT 2010 Oct16 using the X-Shooter spectrograph targeted SN Primo and the bright host galaxy core in a single slit. Both the SN and the host continuum were too faint for detection (the host brightness is comparable to SN Primo at peak, with J=24.3 and H=24.4 AB mag). However, the X-shooter spectrum revealed strong emission lines from H, [O III], and [O II]. These lines fixed the redshift of the host with exquisite precision to z=1.549920.00007, and also confirmed the initial photometric classification of the host as a strongly star-forming galaxy. A complete discussion of the VLT observations and a more detailed discussion of the SN Primo host galaxy will be presented by Frederiksen et al. (2012, in prep).
5. Light Curve
![[Uncaptioned image]](/html/1201.2470/assets/x5.png)
The SN Primo light curve for F125W () as blue circles and F160W () as red squares. At a redshift of these correspond to rest-frame V and R bands, respectively. Solid lines show the best-fitting template, as determined by the SOFT light curve classification program, and dashed lines indicate the model uncertainty (see Rodney & Tonry 2009). The best-fit template is based on the light curve of the normal Type Ia SN 2005cf (Wang et al. 2009).
As detailed in Table 1, the fading light curve was followed from 2010 November through 2011 January, with 6 visits from the SN follow-up program and 2 return visits from CANDELS. The light curve is plotted in Figure 5 with the best-fitting template (SN 2005cf), as determined by the SOFT light curve classification program (Rodney & Tonry 2009, 2010). Reinforcing the color classification, we find that this best-fitting light curve template is a normal SNIa at the redshift of the host galaxy (SN 2005cf has a light curve width of mag). The SOFT fit with various SN Ia light curve templates can allow for mag of host-galaxy extinction. Using the MLCS2k2 light curve fitter (Jha et al. 2007), we find similarly undistinguished fit parameters: a very normal light curve shape parameter and a host-galaxy extinction of . These estimates of low are supported by the VLT spectrum of the host, in which the Balmer decrement of the emission lines is consistent with no reddening (Frederiksen et al. 2012, in prep).
The light curve shape measurement provides a strong test of the SN Ia classification, as shown in Figure 1. The parameter quantifies the shape of a SN Ia light curve as the change in magnitude from peak to 15 rest-frame days past maximum (Phillips 1993). For SNe Ia this parameter varies over a small range and is well correlated across adjacent photometric bands. Figure 1 shows that SN Primo’s light curve shape is consistent with the narrow band defined by our simulated SNe Ia at .
The patchy CC SN contours in Figure 1 do not reflect the true range of CC SN light curve shapes, due to the incomplete information available for modeling this population (see discussion in §3). Thus, one cannot rule out the possibility that SN Primo’s position in parameter space is consistent with a Type Ib/c population that is underrepresented by the SNANA templates. The available information, however, lends strong support to the initial classification as a SN Ia.
6. Grism Spectrum
In the first epoch of follow-up observations, SN Primo was observed using the WFC3 G141 grism (resolution , 1100–1700 nm). Observations were executed in three visits spaced over 7 days,333The initial observing plan would have completed the grism observations in a single day, but a guiding error resulted in a failure during the second visit, so it had to be rescheduled for the subsequent week. for a total integration time of 21.7 ks (see Table 1). SN Primo was separated from the nucleus of its host galaxy by (023 E, 044 S), so it was possible to select the orientation to minimize contamination of the SN spectrum by its own host. These grism data were processed using the aXe software package,444http://axe.stsci.edu and spectra at the location of SN Primo and the bright core of its host were separately extracted. Both spectra were dereddened with a correction for E(B-V)=0.008 mag of Milky Way extinction.
6.1. Host Galaxy Contamination
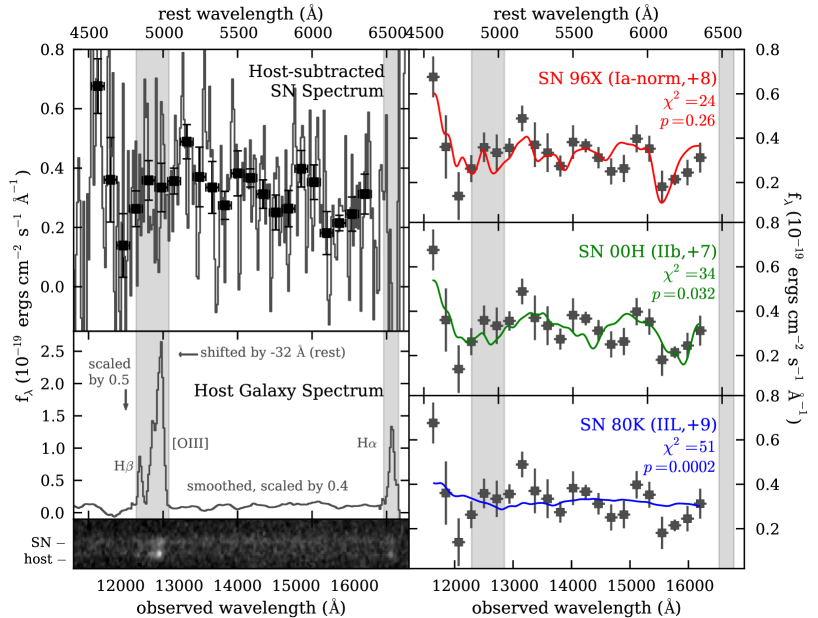
The two-dimensional (2D) grism trace is shown in the bottom-left panel of Figure 3, in which the bright emission knots from H, [O III], and H are readily apparent. The spectrum extracted at the location of SN Primo is visible as the distinct upper trace. Galaxy emission lines are also visible in this spectrum. To remove the host component from the SN Primo spectrum, we need an estimate of the host emission features as well as the continuum at the location of the SN. The galaxy’s emission lines may be unrelated to the continuum strength, as the emission features are driven by the galaxy’s gas while the continuum largely reflects the stellar content. Can the grism spectrum of the host core provide an adequate model for the host light at SN Primo’s location?
As noted in Section 4, the optical and NIR colors of the host galaxy (derived from pre-explosion HUDF imaging) do not have an observable gradient across the visible extent of the galaxy. In particular, the flux ratio from the core to the southern arm of the galaxy is the same for the F125W band (dominated by strong H and [O III] emission) as it is for continuum-dominated F105W and optical bands, to within the measurement uncertainty. This suggests that both the emission and continuum components of the host spectrum as measured at the core should be valid when applied to the southern arm where SN Primo appears.
To adapt the spectrum of the host galaxy core for use in contamination removal requires flux scaling, a wavelength shift and smoothing. To determine the appropriate scaling of the continuum flux, we first measure the isophotal flux in F125W and F160W for the host galaxy core and the southern arm, treating the two as independent objects. The ratio of NIR flux from core to arm is 2.5, which we adopt as our continuum scaling factor. For the emission line regions (demarcated by gray bars in Figure 3) we scale the core flux by a factor of 2.0, which results in a good match from core to arm for the [OIII]+H region.
Next, we shift the host spectrum by Å in the rest frame. As shown in Figure 2, the dispersion axis of the grism observations was roughly 90 degrees East of North, and SN Primo was offset to the East of its host by 023 along that axis. In the slitless grism observations, this spatial separation along the dispersion direction is translated into a wavelength separation between the SN features and the superimposed host-galaxy features. The wavelength shift corrects for this offset.
Finally, we apply a broad smoothing filter (250 Å in the rest frame) to the regions of the host spectrum between emission lines, while leaving the lines untouched. This smoothing avoids the introduction of additional noise when this core spectrum is subtracted from the SN. The final host galaxy spectrum – scaled, shifted and smoothed – is shown in the center-left panel of Figure 3). Subtracting this from the spectrum taken at the location of the SN yields the final host-subtracted SN spectrum shown in the upper left panel.
As shown in the upper left panel of Figure 3, the host-subtracted SN spectrum is noisy and spans only 2000 Å in rest wavelength. The noise in the SN spectrum is characterized by adjacent positive and negative spikes with a width of 50-100 Å (or 20-40 Å in the rest frame). The dispersion of the G141 grism is 46.5 Å pix-1, which we sub-sample to 21.5 Å pix-1. Our analysis here is directed at identifying spectral features of SN sub-classes that are much broader than this in the rest frame. Binning the rest-frame spectrum into wavelength bins of width 80 Å (black points in Figure 3) removes this high frequency noise without obscuring broader features.
6.2. Spectral Confirmation
The relatively weak signal in this spectrum is insufficient for a pure spectral classification, but we argue below that it is enough to provide a spectral confirmation of this object as a normal Type Ia SN. A true spectral classification would require that the object be assigned to a SN (sub)class without any other information, or perhaps with only weak priors on age and redshift. In the case of SN Primo, we have already built up a series of strong classification indicators from the redshift, magnitude, color, and light curve shape. Taken together, this evidence provides a prediction that the grism data should show spectral features consistent with a SN Ia at about 6 days past maximum light. We can confirm or refute this prediction by testing for the presence of such features in the grism data.
The strongest test of spectroscopic confirmation should not rely on any information derived from the broad-band indicators of Sections 3-5. For example, the grism spectrum from HST is flux-calibrated, so we could require that a matching spectral template be consistent with the absolute flux scale. This, however, would essentially be re-using the magnitude classification from Figure 1. We already know that an over-luminous Core Collapse SN would be required to match SN Primo’s photometry, so by working only in relative flux units we allow for the possibility that any of the spectrally normal CC SN represented in our template library could be peculiarly over-luminous at . Similarly, the shape of the light curve is inconsistent with the broad plateaus of Type II-P and some IIn SNe (Figures 5 and 1. We could use this information to limit our spectral template library to only Type I SNe. This would be re-using the light curve shape classification indicator, so we include all CC SN varieties in the template matching test.
We do allow two pieces of prior information to inform the spectral test. First, we use the redshift of derived from host galaxy emission lines to define the rest wavelength scale of the SN spectrum (i.e. we reject the possibility that SN Primo is a foreground or background object not associated with the adjacent galaxy). Second, we define the age of the SN at the time of the grism observations as 63 days past maximum light. This age is derived directly from the observed photometry, independent of any light curve fitting.
6.3. Spectral Cross Correlation Test
The final reduced spectrum suggests a series of absorption features spaced by roughly 400 Å in rest wavelength. This is qualitatively consistent with the expected shape of a Type Ia spectrum: the broad trough from 4600 to 5100 Å is roughly consistent with an Fe/Si complex, and narrower drops around 5300, 5700 and 6100 Åare in line with S II, and Si II absorption features. These features are characteristic of a normal SN Ia spectrum and can also be found in SN Ib/c spectra shortly after maximum, although they are typically less pronounced than in SNe Ia (Filippenko 1997).
For a more quantitative evaluation of the SN Primo spectrum, we use the SuperNova IDentification program (SNID, Blondin & Tonry 2007), which does a cross-correlation comparison of an input spectrum against a library of templates. SNID was designed to be insensitive to the shape of the continuum (it fits the continuum with a high-order polynomial and removes it), so that it can provide spectral classifications based principally on emission and absorption features. This satisfies our requirement from §6.2 that the spectral classification test with SNID is independent of the priors derived from broad-band magnitudes in Figures 1. Additionally, SNID’s continuum removal makes it insensitive to any reddening of the SN spectrum due to host galaxy extinction, so we do not apply any host extinction corrections to SN Primo’s spectrum.
Due to the relatively weak signal, SNID is unable to find a compelling match with any template spectrum. Blondin & Tonry (2007) defines the quality parameter lap, which combines the degree of overlap with the strength of the cross-correlation signal. A good SNID fit typically has lap, but for SN Primo SNID finds no spectral template match with lap3.7. Although this is not sufficient for a true spectral classification, we can still complete the spectroscopic confirmation test by considering the relative quality of fit for the best-fitting templates for each SN class.
The best match from the SNID template library is a normal SN Ia (SN 1996X) at 8 days past maximum, shown in the upper right panel of Figure 3. The best fitting core collapse templates from the Type Ib/c and Type II families of templates are shown in the center and lower right panels. To quantify the quality of the SN Ia fit relative to the CC SN templates, we compute the statistic and measure the integrated tail probability (the -value). Due to the narrow restrictions on redshift and age, the only remaining variable for SNID is the choice of template, so the test has 21 degrees of freedom. The Ia match gives for a -value of 0.24, meaning that the test cannot reject this Ia template as an acceptable model for the observed data. The top Type Ib/c template has for a -value of 0.03, rejecting the model with 97% confidence. The best Type II model is significantly worse, giving or =0.0002, which rejects the model with 99.98% confidence.
When comparing an observed SN to a set of spectral templates, one must be careful that the makeup of the template library does not bias the test in favor of a Type Ia classification. The number of published Type Ia SN spectra in the literature is much larger than for CC SNe, so if the CC SN population is not adequately represented in the template library then the value for the best Ia match will be better simply by virtue of having more templates to choose from. For SN Primo, we have limited the SNID library to spectral templates observed in the range days after peak. This leaves SNID with 72 Type Ia spectra from 31 normal SNe Ia, compared to 74 CCSN spectra from 24 separate CC SNe. Thus, the SNID template library is well balanced for an unbiased test.
As described above, the SNID template matching algorithm is insensitive to the broad shape of the continuum, so the subtraction of a heavily smoothed host continuum should not have a strong effect. As a check that the template matching is not driven by host subtraction, we repeated the above procedure with no subtraction of the host continuum. The emission line regions must be excluded from the fit, but the SN light still dominates the flux in the inter-line region. The best SNID matches are even worse in lap and , but the best-fitting spectral template is still a normal Type Ia SN.
Binning the spectrum to smooth over the high frequency noise makes it easier to identify the broad absorption features that are characteristic of most SNe. However, this procedure could lead to a classification bias by obscuring sharp features that would challenge the SN Ia classification. To test for such bias, the fitting procedure described above was repeated twice. First, with an alternate smoothing using a 10-pixel median filter, and then with no smoothing at all. Both of these approaches significantly degrade the quality of the template match for all classes, but in both instances the Type Ia template remains the best match. The 80 Å binning depicted in Figure 3 provides the strongest discrimination between classes, and unambiguously favors the Type Ia template match.
7. Discussion
The discovery and confirmation of SN Primo demonstrates the new capability of HST to both detect and follow SNe Ia at redshifts above 1.5 using the WFC3 IR detector. Given the depth of our survey observations in the IR, we are able to detect a normal SN Ia like SN Primo to redshifts as high as , where it would appear with an unreddened peak (Vega) magnitude around F125W = 25.3 and F160W = 25.1 mag with a S/N of 10 (i.e., uncertainties of 0.1 mag).
After detecting SNe at , however, the real challenge lies in the follow-up campaign. The classification of SN Primo as a SN Ia is built on four layers of evidence. First, the F350LPF160W color and the host-galaxy photometric redshift suggest that the object may be a high- SN Ia (Figure 1). Second, ground-based follow-up spectra from the VLT pin down the redshift, narrowing the range of possible models and strengthening the SN Ia case. Third, in Figure 1 a well-sampled light curve defines SN Primo’s position in the parameter space as consistent with the narrow SN Ia band. Finally, the spectrum shown in Figure 3 reveals SN Ia spectral features that confirm the SN Ia classification. Although this final test falls short of a pure spectroscopic classification, our spectral confirmation procedure is strengthened by keeping it largely independent of the photometric classification tests: no spectral templates were excluded by invoking the luminosity prior of Figure 1 or the light curve shape constraints of Figure 1, but we still cannot find a better match to SN Primo’s spectral features with any CC SN template.
As the CANDELS+CLASH SN survey progresses, the first question that the growing SN sample will be able to address is simply, how many SNe Ia are there at ? This rate measurement provides an important constraint on models of SN Ia progenitors through measurement of the DTD. Past HST programs using the ACS were able to extend the SN Ia rate measurement to , but only with very weak statistical constraints (Strolger et al. 2004, D08). The D08 results suggest a decline in the SN Ia rate at , but that claim rests on only three SN detections that populate the highest redshift bin. Ground-based rate measurements from the Subaru Deep Field (SDF) survey have claimed a higher SN Ia rate at (G11). The SDF results have larger statistical significance (their sample has 10 SNe Ia at , where D08 has 3). However, there is a greater potential for classification errors, as the G11 sample has only single-epoch detections with a one-year interval, no spectroscopic confirmation of the SNe, and no spectroscopic host redshifts above .
The CANDELS+CLASH survey will be able to resolve this dispute observationally with two rate measurements. First, in the range, this program is the first SN search to use IR bands for SN discovery, making it less sensitive to dust extinction that could have obscured SNe in optical surveys. Second, this survey will for the first time extend the SN Ia rate measurement to . Extrapolating the rate measurements from D08 and G11, we expect to discover SNe Ia at over the three-year CANDELS+CLASH program. As with SN Primo, all of these objects will have secure classifications and the best available redshifts.
Finally, the full sample of SNe will enable a direct test for evolution in the properties of SNe Ia. In Figure 1 we see that SN Primo is consistent with the standard CDM model. Figure 5 shows that SN Primo is very well matched by a light curve template based on SN 2005cf, a normal SN Ia with a light curve width of mag. The spectral features shown in Figure 3 are also consistent with a normal SN Ia. Thus, SN Primo alone provides no evidence for evolution of the SN Ia population with redshift, but with only a single well-studied object so far one cannot draw any meaningful conclusions. Extending these comparisons to the final sample of high- SNe Ia may provide useful constraints on evolution of the SN Ia population.
We would like to thank the anonymous referee for a helpful discussion that significantly improved this paper. Thanks also to our Program Coordinators, Beth Perriello and Tricia Royle, our Contact Scientist Sylvia Baggett, and the entire Hubble planning team, for their efforts in support of this challenging program. The WFC3 team has made substantial contributions to the program by calibrating and characterizing the instrument, and have provided much useful advice. We thank David Koo and Asantha Cooray of CANDELS for helpful discussions and review of this paper, and Marc Postman and Larry Bradley of CLASH for their steadfast support of the CLASH SN search program. Thanks to Zoltan Levay of STScI for assistance in image preparation.
Financial support for this work was provided by NASA through grants HST-GO-12060 and HST-GO-12099 from the Space Telescope Science Institute, which is operated by Associated Universities for Research in Astronomy, Inc., under NASA contract NAS 5-26555. Support for this research at Rutgers University was provided in part by NSF CAREER award AST-0847157 to SWJ. The Dark Cosmology Centre is supported by the Danish National Research Foundation.
Facilities: HST (WFC3) VLT (X-shooter)
References
- Arcavi et al. (2010) Arcavi, I., et al. 2010, ApJ, 721, 777
- Blondin & Tonry (2007) Blondin, S., & Tonry, J. L. 2007, ApJ, 666, 1024
- Caldwell et al. (1998) Caldwell, R. R., Dave, R., & Steinhardt, P. J. 1998, Physical Review Letters, 80, 1582
- Conley et al. (2011) Conley, A., et al. 2011, ApJS, 192, 1
- Contreras et al. (2010) Contreras, C., et al. 2010, AJ, 139, 519
- Dahlen et al. (2008) Dahlen, T., Strolger, L.-G., & Riess, A. G. 2008, ApJ, 681, 462
- Domínguez et al. (2001) Domínguez, I., Höflich, P., & Straniero, O. 2001, ApJ, 557, 279
- Drout et al. (2011) Drout, M. R., et al. 2011, ApJ, 741, 97
- Filippenko (1997) Filippenko, A. V. 1997, ARA&A, 35, 309
- Garnavich et al. (1998) Garnavich, P. M., et al. 1998, ApJ, 509, 74
- Graur et al. (2011) Graur, O., et al. 2011, MNRAS, 417, 916
- Grogin et al. (2011) Grogin, N. A., et al. 2011, ApJS, 197, 35
- Guy et al. (2007) Guy, J., et al. 2007, A&A, 466, 11
- Hachisu et al. (1996) Hachisu, I., Kato, M., & Nomoto, K. 1996, ApJ, 470, L97+
- Hicken et al. (2009) Hicken, M., et al. 2009, ApJ, 700, 331
- Hoeflich et al. (1998) Hoeflich, P., Wheeler, J. C., & Thielemann, F. K. 1998, ApJ, 495, 617
- Jha et al. (2006) Jha, S., et al. 2006, AJ, 131, 527
- Jha et al. (2007) Jha, S., Riess, A. G., & Kirshner, R. P. 2007, ApJ, 659, 122
- Kessler et al. (2009a) Kessler, R., et al. 2009a, ApJS, 185, 32
- Kessler et al. (2009b) —. 2009b, PASP, 121, 1028
- Kiewe et al. (2012) Kiewe, M., et al. 2012, ApJ, 744, 10
- Koekemoer et al. (2011) Koekemoer, A. M., et al. 2011, ApJS, 197, 36
- Komatsu et al. (2011) Komatsu, E., et al. 2011, ApJS, 192, 18
- Kuznetsova et al. (2008) Kuznetsova, N., et al. 2008, ApJ, 673, 981
- Li et al. (2011) Li, W., et al. 2011, MNRAS, 412, 1441
- Modjaz (2011) Modjaz, M. 2011, Astronomische Nachrichten, 332, 434
- Perlmutter et al. (1999) Perlmutter, S., et al. 1999, ApJ, 517, 565
- Phillips (1993) Phillips, M. M. 1993, ApJ, 413, L105
- Postman et al. (2011) Postman, M., et al. 2011, ArXiv e-prints
- Richardson et al. (2002) Richardson, D., Branch, D., Casebeer, D., Millard, J., Thomas, R. C., & Baron, E. 2002, AJ, 123, 745
- Riess et al. (1998) Riess, A. G., et al. 1998, AJ, 116, 1009
- Riess & Livio (2006) Riess, A. G., & Livio, M. 2006, ApJ, 648, 884
- Riess et al. (2001) Riess, A. G., et al. 2001, ApJ, 560, 49
- Riess et al. (2007) —. 2007, ApJ, 659, 98
- Riess et al. (2004) Riess, A. G., et al. 2004, ApJ, 607, 665
- Rodney & Tonry (2009) Rodney, S. A., & Tonry, J. L. 2009, ApJ, 707, 1064
- Rodney & Tonry (2010) —. 2010, ApJ, 715, 323
- Smith et al. (2011) Smith, N., Li, W., Filippenko, A. V., & Chornock, R. 2011, MNRAS, 412, 1522
- Strolger et al. (2004) Strolger, L.-G., et al. 2004, ApJ, 613, 200
- Sullivan et al. (2011) Sullivan, M., et al. 2011, ApJ, 737, 102
- Suzuki et al. (2011) Suzuki, N., et al. 2011, ArXiv e-prints
- Turner & White (1997) Turner, M. S., & White, M. 1997, Phys. Rev. D, 56, 4439
- Wang et al. (2009) Wang, X., et al. 2009, ApJ, 697, 380
- Wood-Vasey et al. (2007) Wood-Vasey, W. M., et al. 2007, ApJ, 666, 694