Low Temperature Measurements by Infrared Spectroscopy in CoFe2O4 Ceramic
Abstract
In this paper results of new far-infrared and middle-infrared measurements (wavenumber range of 4000 cm-1 - 100 cm-1) in the range of the temperature from 300 K to 8 K of the CoFe2O4 ceramic are presented. The bands positions and their shapes are the same in the wide temperature range. The quality of the sample was investigated by X-ray, EDS and EPMA studies. The CoFe2O4 reveals the cubic structure () in the temperature range from 85 K to 360 K without any traces of distortion. On the current level of knowledge the polycrystalline CoFe2O4 does not exhibit phase transition in the temperature range from 8 K to 300 K.
pacs:
78.30.-jI Introduction
Cobalt spinel ferrite CoFe2O4 (CFO) is interesting due to its structural, magnetic, and electrical properties. It has Curie temperature around 793 K, strong magnetic anisotropy, high moderate saturation magnetization and coercivity, and high mechanical hardness. These properties with their physical and chemical stability make it suitable for magnetic recording applications journal-1 ; journal-2 ; journal-3 ; journal-4 ; journal-5 ; journal-6 .
The cobalt ferrite is extensively investigated. Raman and IR spectra for CFO were obtained in the range (800 - 200) cm-1 by Yu et al. journal-7 at the temperature range (300 - 870) K and in the range (900 - 100) cm-1 at room temperature by Wang et al. journal-8 . The aim of this work is to study the low temperature dependence of FIR and MIR spectra in the range (4000 - 100) cm-1.
II Experiment and Results
II.1 Sample preparation
The CFO samples were made by a conventional method. Powders of CoFe2O4 solid solutions were obtained by solid phase synthesis from Co2O3-99,5 % and Fe2O3-70 % oxides. The starting materials were weighed according to the chemical formula, homogenized and milled in an agate ball-mortar in ethanol for 24 h, dried and calcined for 1 h at the temperature 1000 K. The calcined powders were next reground, pressed under the pressure 15 MPa, and sintered for 4 hours at 1100 K.
II.2 X-ray investigations
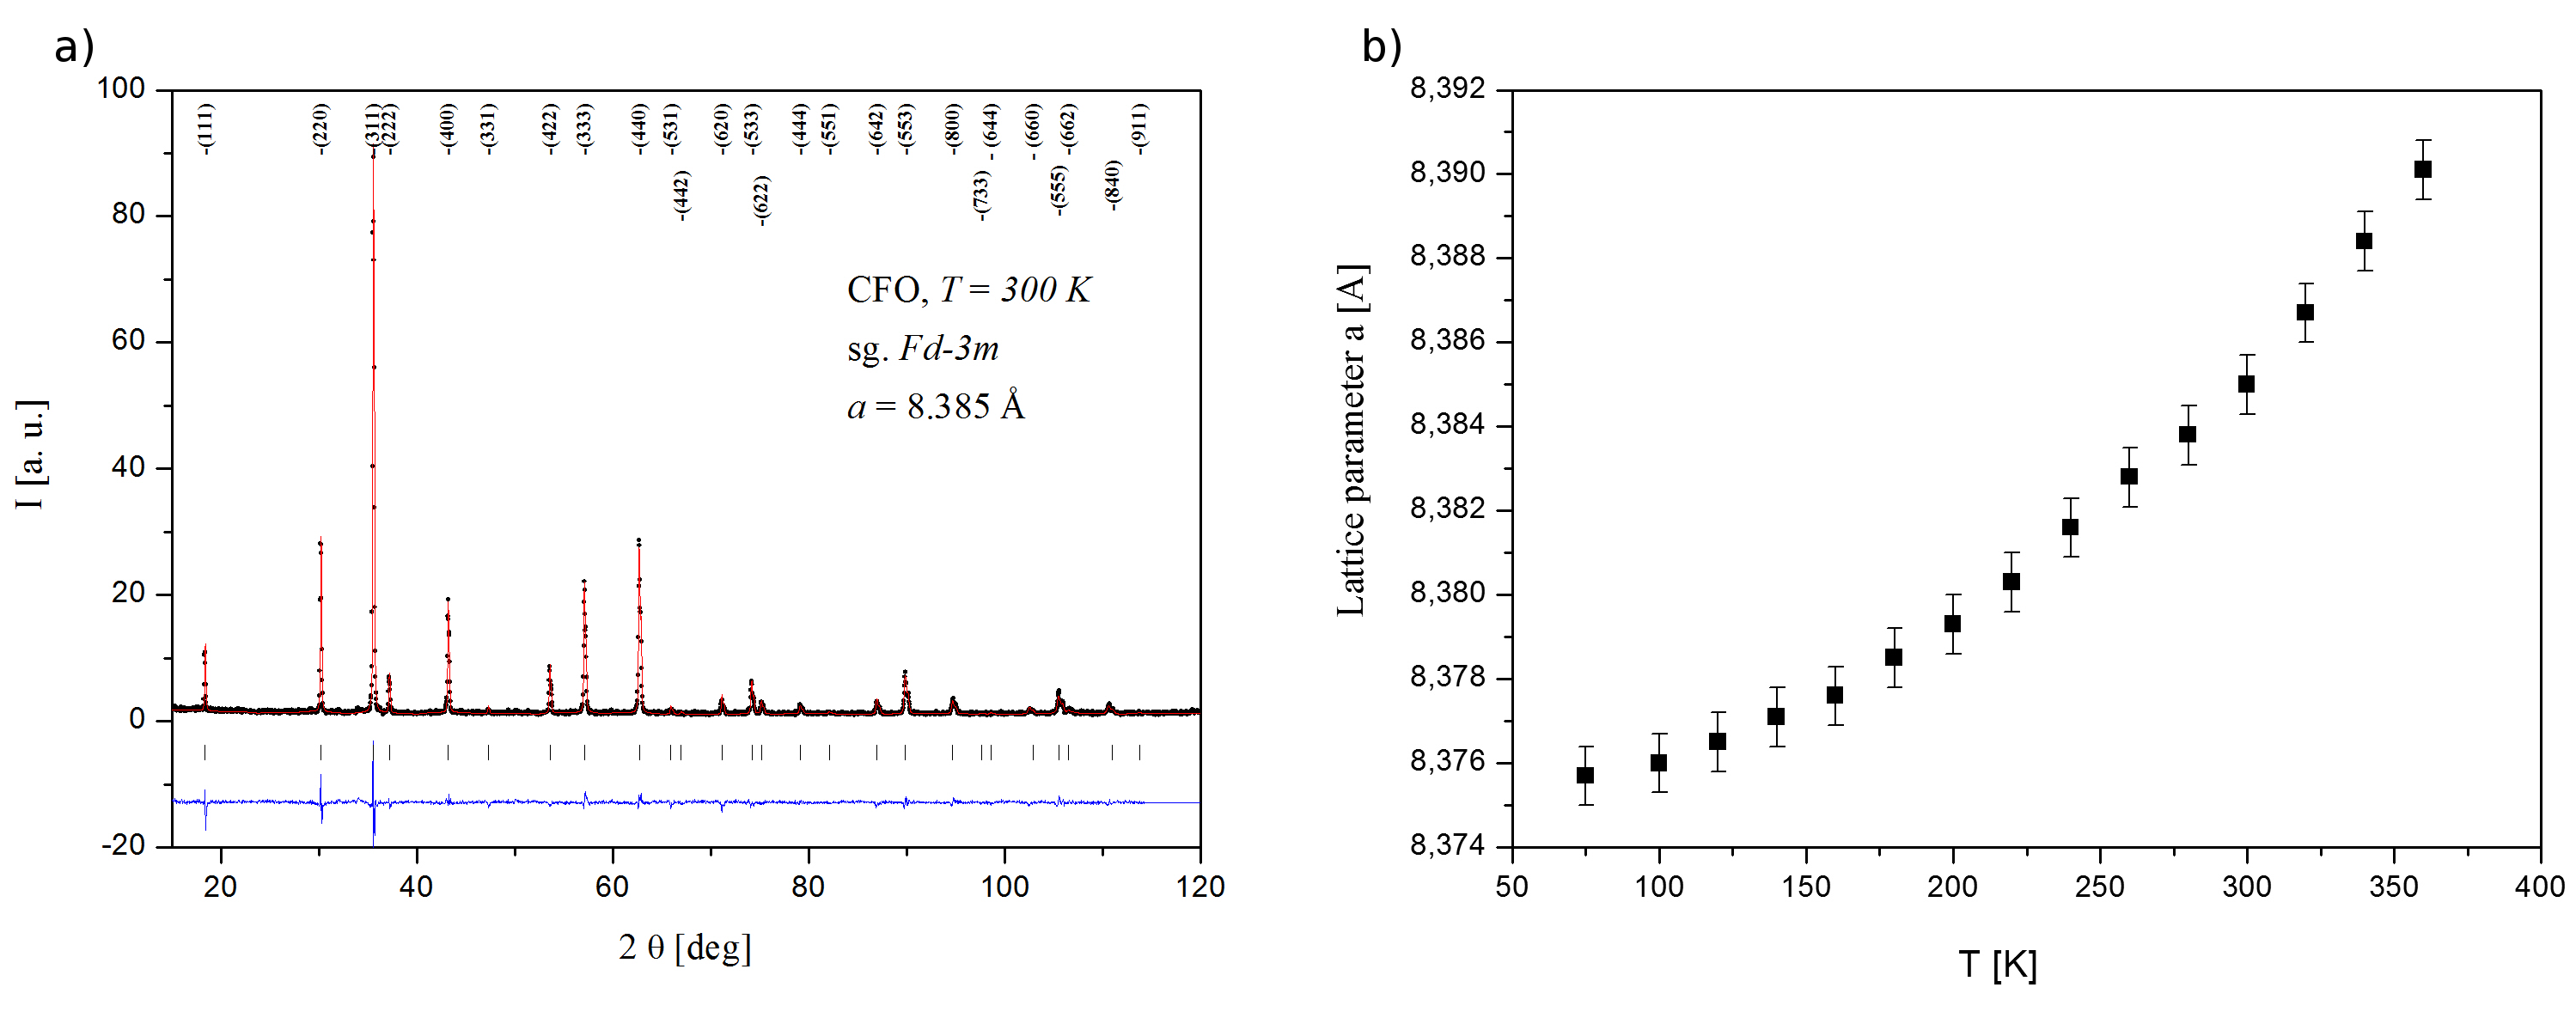
X-ray studies have been carried out using an X’Pert PRO (PANalytical) diffractometer with the CuKα radiation and a graphite monochromator. Temperature of the CFO sample was stabilized (accuracy 1 K) by means of the low temperature chamber TTK 450. The measurements were performed during heating. After each heating stage the sample was held about 10min to obtain temperature equilibrium. A profile-fitting program FULLPROF journal-9 based on the Rietveld method was used to analyze and fit the spectra. An exemplary diagram of X-ray measurement made at RT in Fig.1a is presented and the obtained lattice parameter = 8.385 Å is in good agreement with data in journal-10 . The CFO sample reveals the cubic structure () in the whole temperature range (85 - 360) K without any traces of distortion. The lattice parameter increases from 8.3757 Å at 85 K up to 8.3901 Å at 360 K (Fig.1b), which corresponds to the change of the unit cell volume 0.5 %. Cations of Co and Fe occupy and special Wyckoff positions at (1/2,1/2, 1/2) (1/8, 1/8, 1/8), respectively. Oxygen ions occupy the positions at (). The obtained value = 0.2555(8) at RT is in very good agreement with data from journal-20 . Typical reliability factors obtained from refinements of the XRD patterns were: Rp 12, Rwp 15, Rwp 6 and Chi2 5.5.
II.3 Morphological and chemical investigations
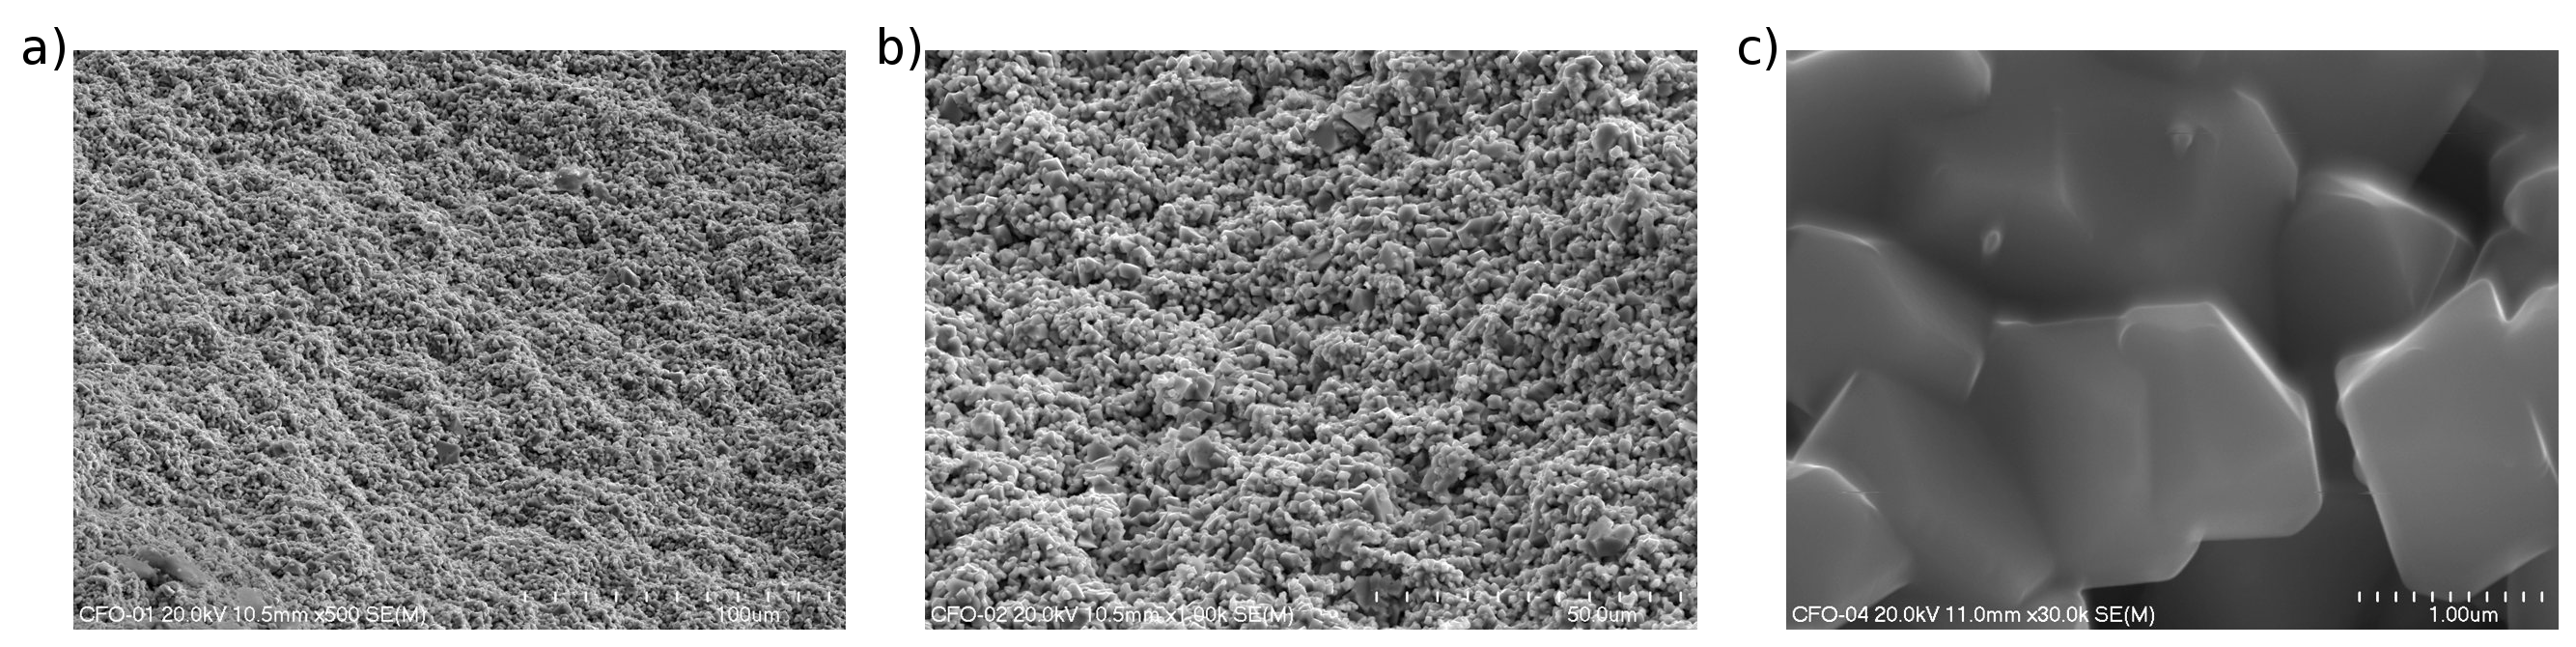
The ceramic microstructure was investigated by means of an electron scanning microscope with microanalyses system Noran-Vantage. SEM micrographs of the fractured surface of the CFO sample with magnifications 500, 1000, and 30 000 are presented in Fig. 2. The microphotographs of fractures of CFO showed that the sample was perfectly sintered and dense (95 % theoretical). The fracture had a fragile nature and in grains the crystalline structures were observed. The average values of grain size (measured by the linear intercept method) was 300 nm. The homogeneity of element distribution in the samples was confirmed by the EPMA method using an X-ray microprobe.
II.4 Elastic properties
Material constants: the Young s modulus , the shear modulus and the Poisson ratio were determined based on the investigations of elastic properties of the CFO polycrystalline samples. An ultrasonic method was applied. The measurements were carried out with the INCO -VERITAS Ultrasonic Measuring Set UZP-1. Two kinds of transducers were used. The 10 MHz frequency transducers connected to a sample by oil were used for longitudinal waves while the 2 MHz frequency transducers stuck on a sample with Canada balsam was applied for transverse waves. Material constants values were calculated from a longitudinal and transverse ultrasonic waves propagation velocity and the apparent density of samples using the following formulas journal-11 ; journal-12 :
where: - density, - velocity of longitudinal wave, - velocity of transverse wave. achieved value 6189.4 m/s, and the next one was 3265.9 m/s. The measured parameters in a direction in the plane of the CFO ceramic are given in Table 1. The CFO sample has high density and small porosity. Therefore material constants of CFO are a bit different for these ones in journal-10 . These results confirmed high mechanical hardness of CFO.
| [kg/m3] | [GPa] | [GPa] | |
|---|---|---|---|
| 6260 100 | 174.5 16.6 | 66.8 0.2 | 0.307 0.014 |
II.5 FT-FIR and FT-MIR studies
The far (FIR) and middle (MIR) infrared absorption measurement were performed using the Bruker 70v vacuum Fourier Transform spectrometer. The transmission spectra were made with a resolution of 2 cm-1 and with 32 scans per each spectrum. The FIR spectra (600-80) cm-1 were collected for sample suspended in apiezon N grease placed on polyethylene disc. The MIR spectra (4000 - 400) cm-1 were carried out for sample mixed with dry KBr and pressed into the form of pellet.
The sample was loaded in cryostat DE-202A at room temperature and measurements were performed in the cooling process to ca. 8 K with the cooling rate 3 K/min. The desired temperature was measured with accuracy of 0.1 K and stabilized for ca. 3 minutes before the data were taken. The LakeShore 331S temperature controller equipped with diode sensor to control the temperature was used. The PE windows were used in cryostat in case of FIR measurements and KRS window in case of MIR measurements.
Fig. 3a presents selected MIR spectra in the region of (4000 - 450) cm-1. One intense maximum is found at ca. 590 cm-1. At lower wavenumbers it is clearly visible shoulder of the main band. None changes is visible during cooling. Peak position as well as band shape (full width at half maximum) does not change as a function of the temperature. Raman spectra were recorded and interpreted by Wang and Ren journal-8 , T. Yu et. al. journal-13 and P. Chandramohan et al. journal-14 . Fig. 3b shows selected MIR spectra in the region of (1000 - 450) cm-1. The presence of shoulder band is clearly visible. Fig. 3c shows selected FIR spectra of the CFO compound. Very weak and broad absorption band is observed at 467 cm-1. Next intense and broad band at ca. 400 cm-1 is visible and shoulder band at ca. 345 cm-1. Very weak and broad bands at ca. 230 cm-1 and ca 180 cm-1 are also visible. However, as can be noticed from this figure, one cannot observe any changes. The band positions and its shape are the same in the wide temperature range.
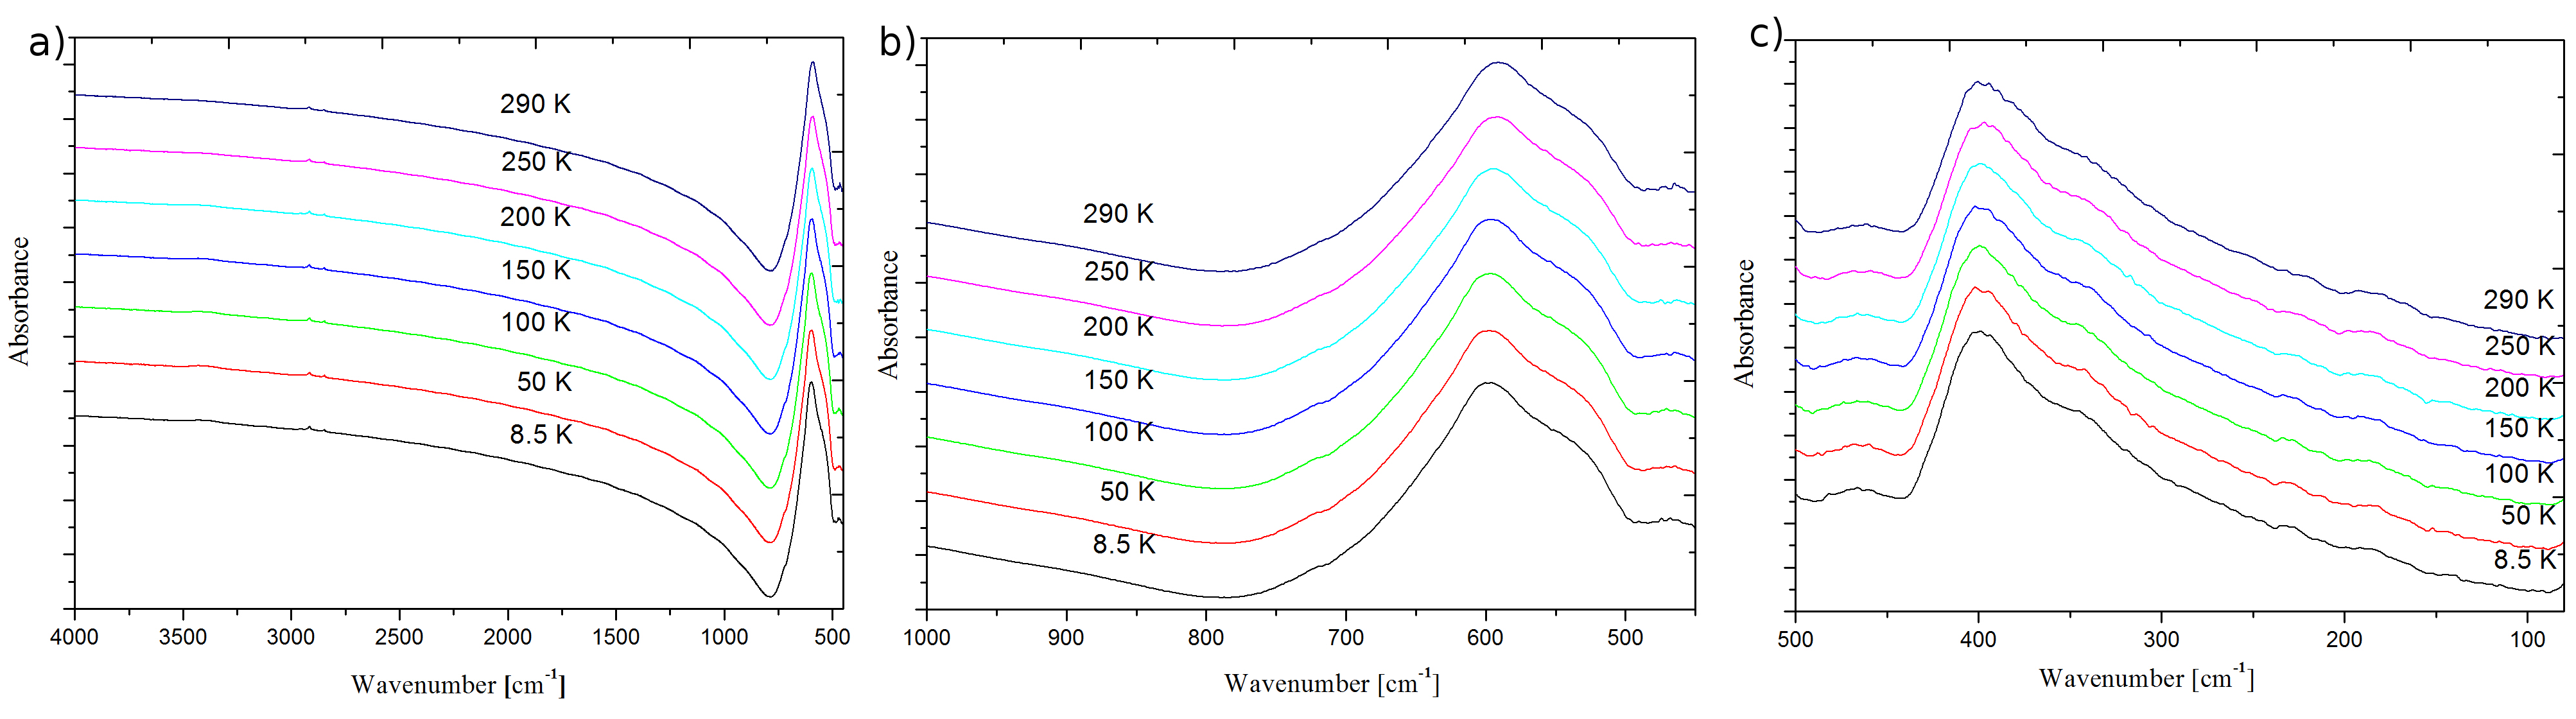
The bands at 590 cm-1 and 467 cm-1 are Raman active modes too. They are consistent with 575.5 cm-1 journal-14 and 470 cm-1 journal-8 ; journal-13 ; journal-14 . There are found four infrared active modes F1u (400 cm-1, 345 cm-1, 230 cm-1, 180 cm-1). These low frequency modes can be assigned to vibrations of the tetrahedral sublattice, whereas the higher energy phonon mode at 590 cm-1 probably is connected with vibrations of the octahedral sublattice journal-8 .
III Calculations
III.1 Ab initio calculations
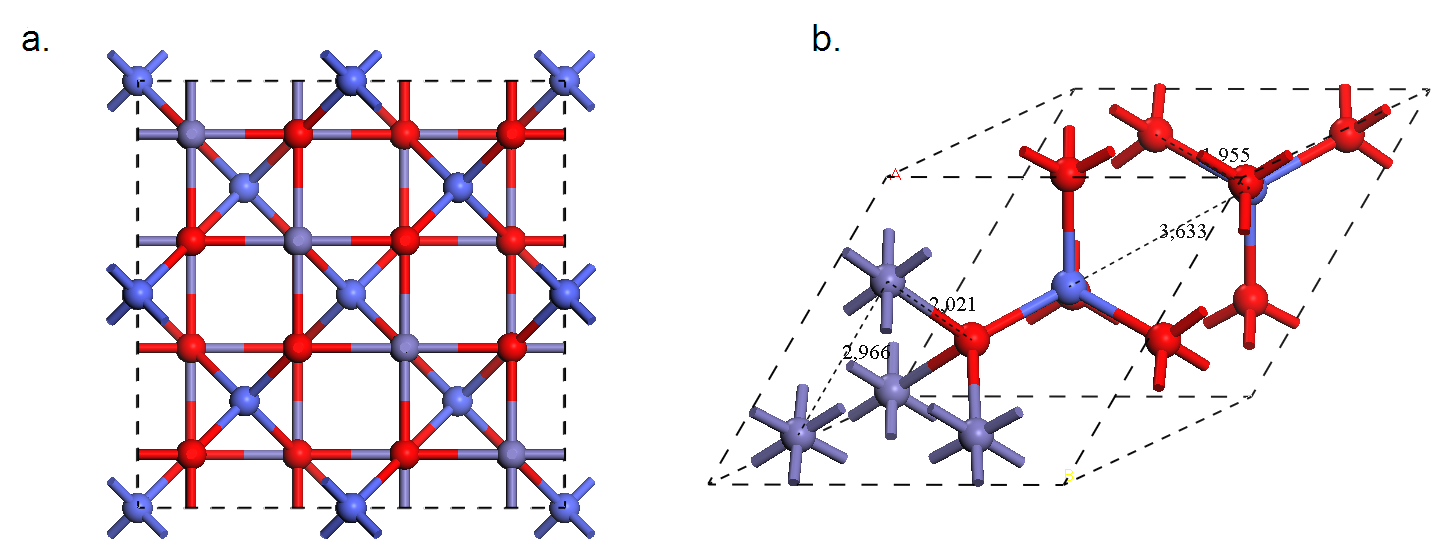
Periodic Boundary Conditions (PBC) calculations of the phonon frequencies for were performed with CASTEP code as implemented in Materials Studio 5.5 journal-15 ,journal-16 and Generalized Gradient Approximation (GGA) represented by PBE functional journal-17 ; journal-18 . The computations were performed with the Troullier-Martins type Norm-Conserving (NC) pseudopotentials developed by Bennett and Rappe journal-19 with the Plane-Wave kinetic energy cut-off of 750 eV. First, the unit cell consisted of 56 atoms, within the well known cubic spinel structure (space group = ; = 8.385 Å), was constructed as presented in Fig. 4a. In the next step the unit cell was reduced into the Co2Fe4O8 primitive cell of face-centered cubic. The resulted lattice parameters were fixed during the optimization and the delocalized internals were relaxed with the 5.010-7 eV/atom; 5.010-3 eV/Å and 5.010-3 Å convergence criteria for the energy; Hellman-Feyman forces and atomic displacements, respectively. The electronic energy was computed within the precise (545454) FFT grid using the 555 Monkhorst-Pack grid for the Brillouin-zone sampling. The SCF tolerance of 5.010-10 eV/atom was applied along with the electron smearing of 0.1 eV. The resulted equilibrium structure was presented in Fig. 4b. Finally, the computations were also repeated under the same conditions with the full size unit cell presented in Fig. 4a.
Since the studied structure is not an insulator it was impossible to simulate the IR activities via the linear-response approach. Also applying the Hubbard correction, what might be suggested for the studied system, is still impossible in phonon calculations using the available solid state DFT software. Hence, the numerical finite-displacement approach, as implemented in CASTEP, was applied to calculate the phonon modes at the point as seen by vibrational optical spectroscopy. For the calculated frequencies the Acoustic Sum Rule (ASR) has been applied. No imaginary frequencies were presented in the calculated results. It should be noticed that we have also tested the ultrasoft pseudopotentials along with pure LDA approach however no improvement was found in this case.
III.2 Vibrational Analysis
According to group theory, the irreducible representations for the studied systems are as follows:
Within the expected normal modes, only the T type vibrations are infrared-active, while A1g, Eg and T2g symmetry modes are allowed in Raman spectroscopy. All the IR-active vibrations are triply degenerated. T1g, A2u, Eu and T2u symmetry vibrations are the silent ones. None of the modes may be observed both by infrared and Raman spectroscopy. As the complete unit cell consists of 56 atoms, the number of the modes allowed to be observed with optical vibrational spectroscopy equals 165 (3N-3). By using the primitive cell approach we have reduced the computational problem into 39 modes which undergo further degeneracy upon expanding the system. However, the computations revealed that the calculations within the full-unit cell dimension resulted mainly in further splitting of the silent modes, with no significant influence on the optically active vibrations.
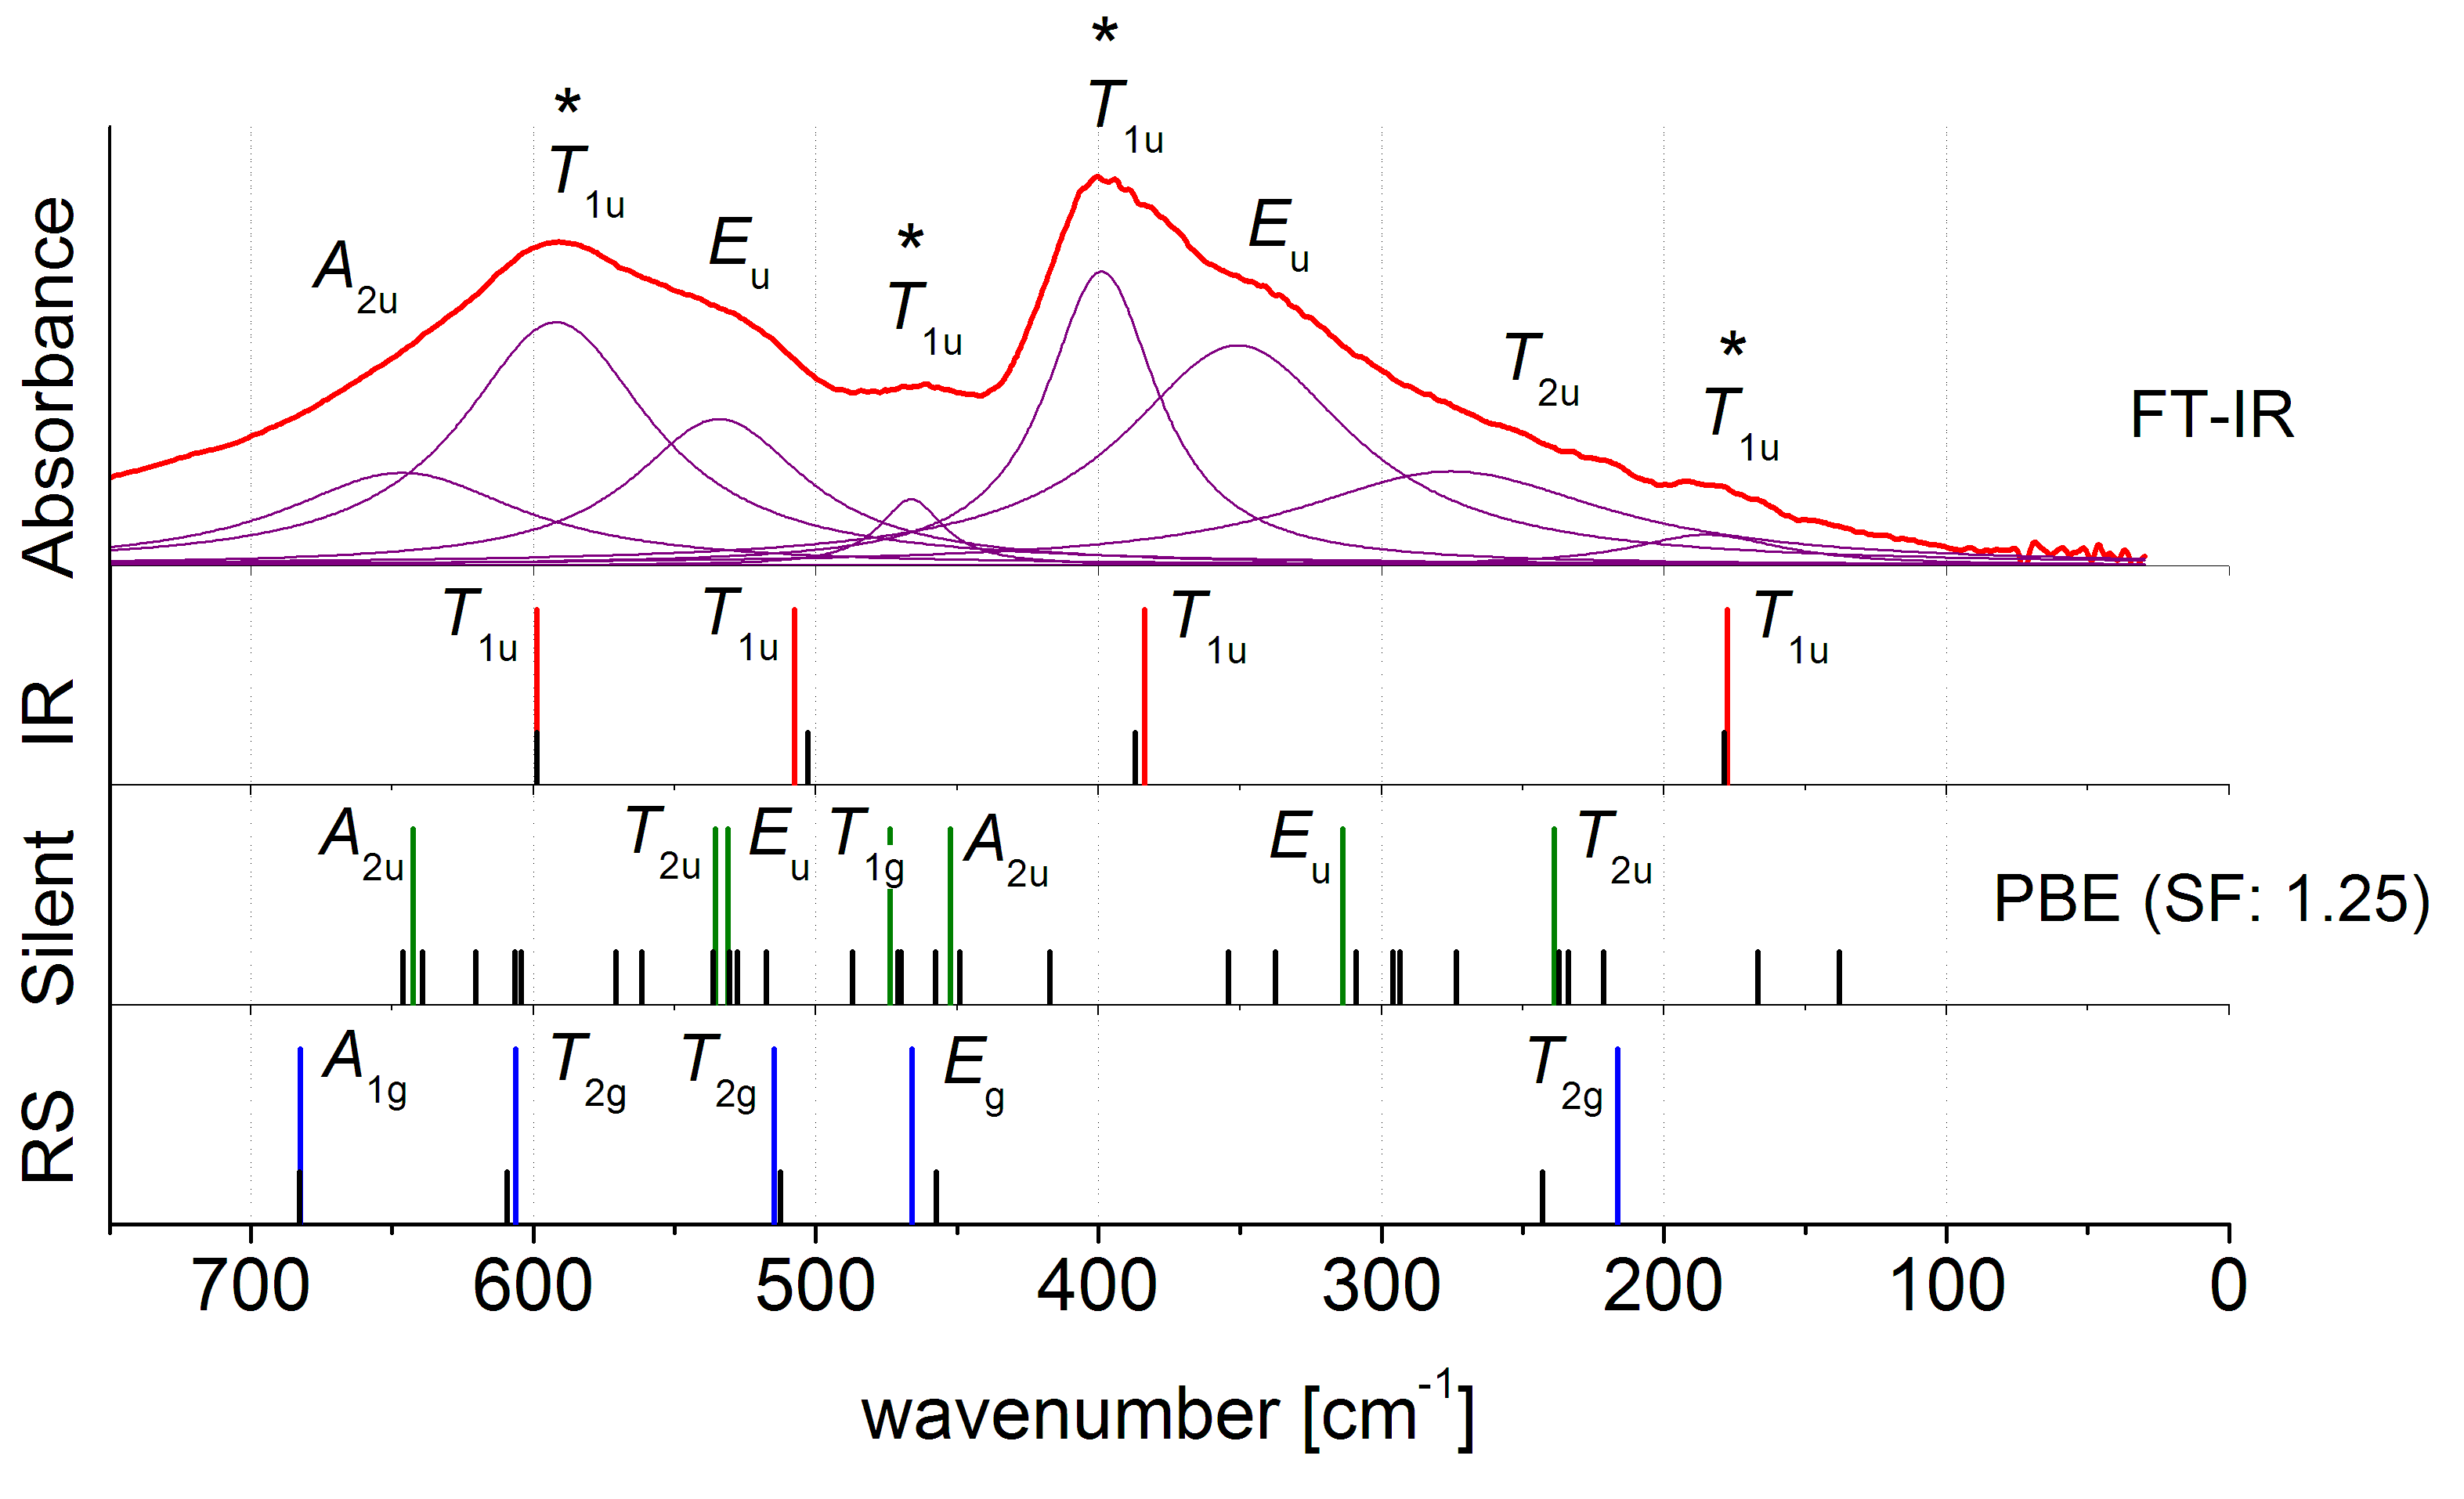
Fig. 5 compares the experimental room temperature FT-IR spectrum of the CoFe2O4 sample, with the calculated frequencies of the IR and Raman active modes and with the symmetry forbidden vibrations (silent modes). The higher sticks correspond to the primitive-cell model, while the lower ones are due to the full-unit cell approach. The infrared active T1u type modes are visualized in Fig. 6. The projection of all the calculated phonons has been given in the supplementary section.
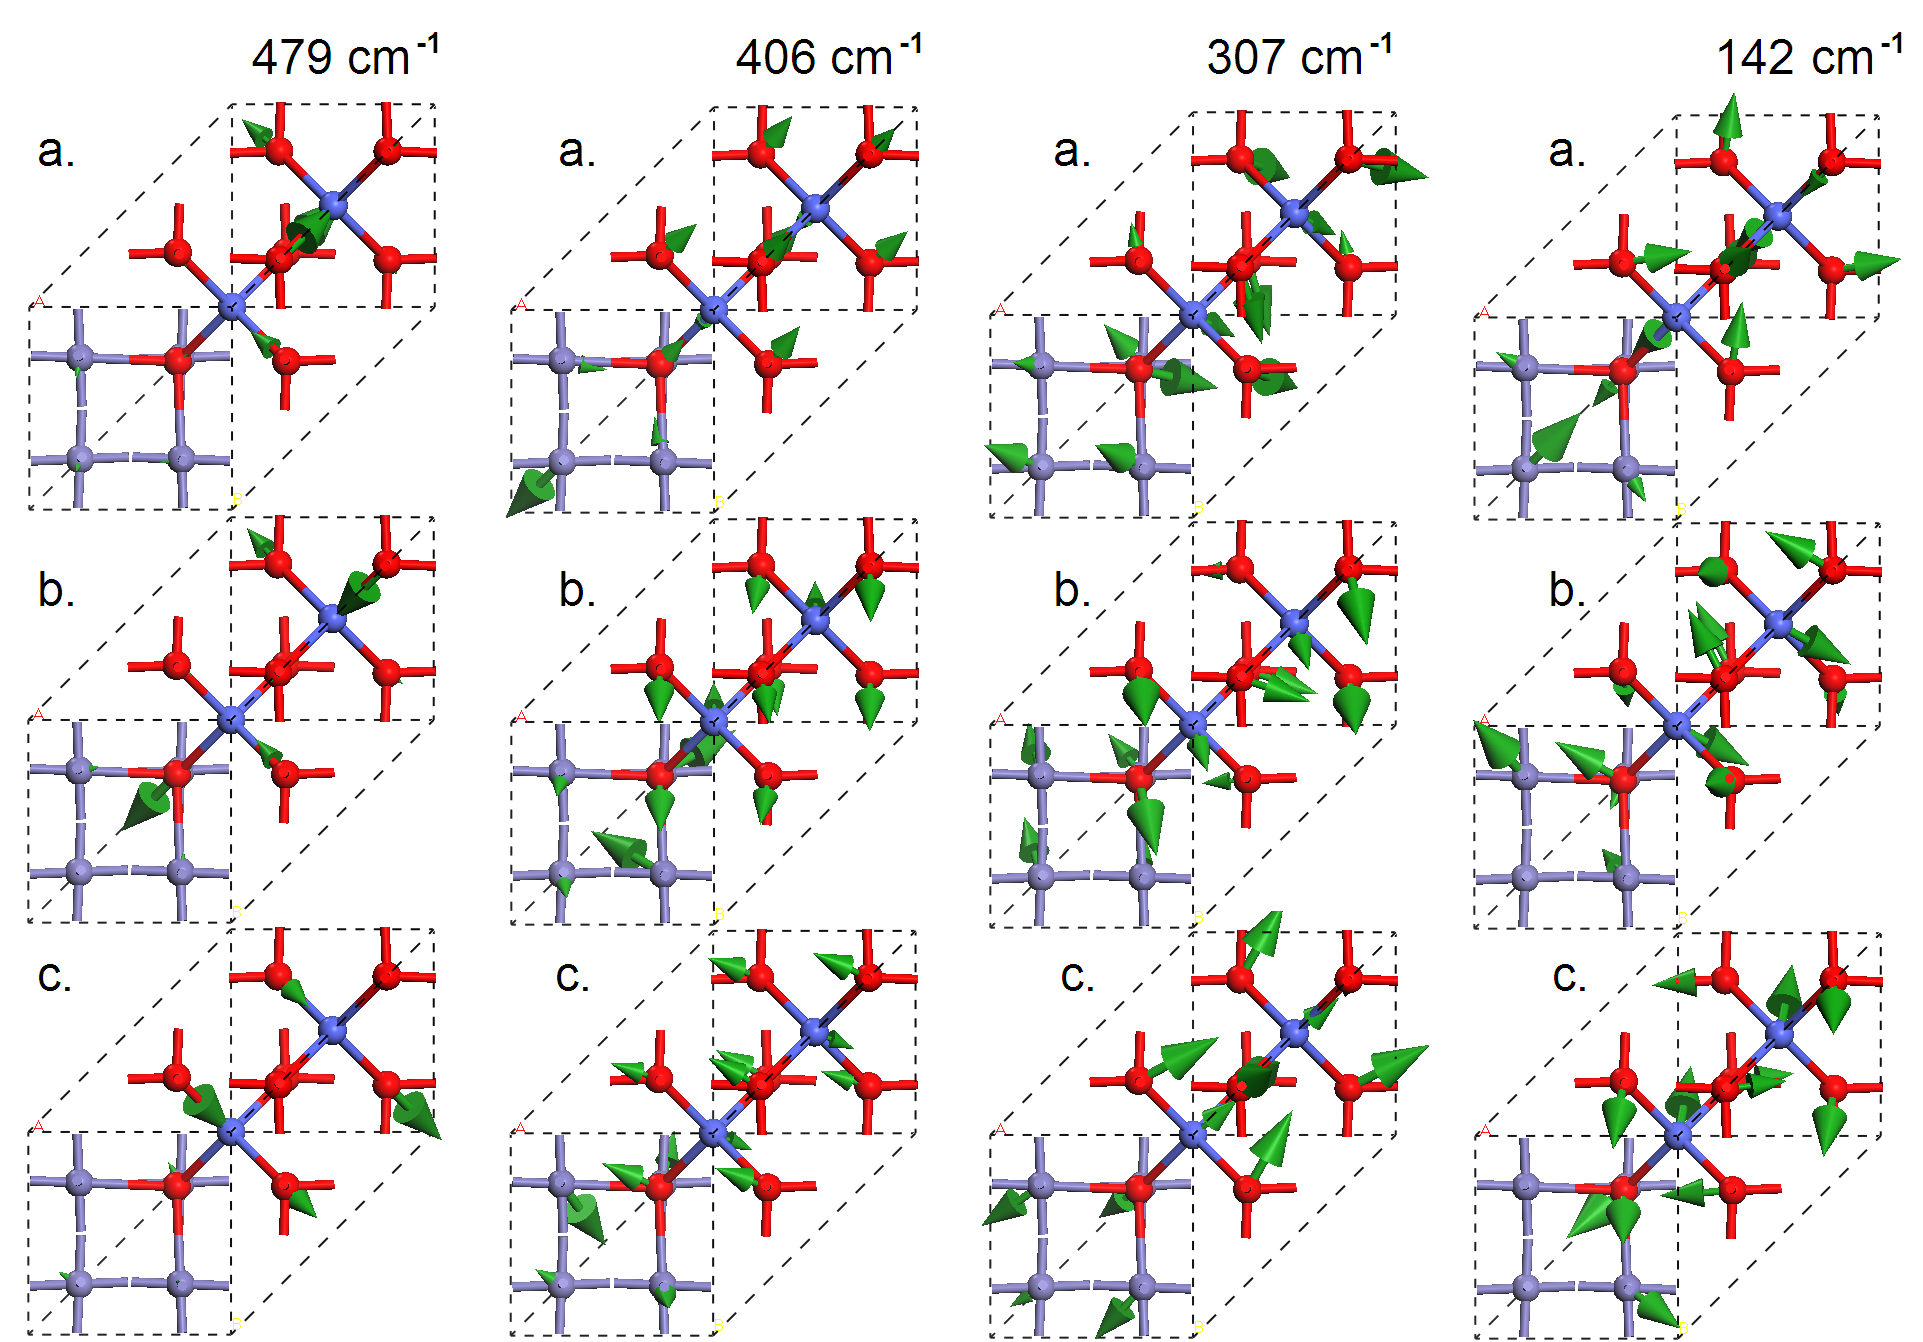
All the theoretical frequencies fall into the far-infrared regime. The theory predicts four, triply degenerated modes, observed at: 479, 406, 307 and 142 cm-1. However, the experiment reveals more spectral features. Figure 5. delivers the experimental spectrum deconvoluted with Lorentzian functions giving the following bands: 646, 592, 534, 466, 399, 351, 275 and 185 cm-1. The calculated frequencies are strongly underestimated with respect to the experiment for about 25%. This effect may be partially linked with the insufficiency of the pure DFT in the description of such strongly electron-correlated system. Although the obtained results suggest a need of introducing a better theoretical model, it allows for sufficient interpretation of the experimental features. Hence, we have empirically rescaled the calculated frequencies by the scaling factor of 1.25. The computations suggest that the T1u type modes may be assigned to the 592, 466, 399 and 185 cm-1 bands. The 534 and 351 cm-1 features seems to be the shoulders of the adjacent T1u bands. Although the experimental spectrum may be disturbed by a modulated background, we believe, that the remaining spectral features comes from the activation of the A2u, Eu and T2u type silent modes, induced by a distortion of the structure which lowers the symmetry. However, we cannot also exclude that the shoulder bands may be also related with a further resonance splitting of the main T1u modes due to some long-correlation effects.
IV Conclusions
FT-MIR and FT-FIR measurements were performed for the first time for CFO ceramic in the wide temperature range. In this paper it is shown that CFO is a structural stable compound in the temperatures from 8 K to 300 K. The small and large peaks of the bands are visible without changes in a wide temperature range. Moreover, none new band with wavenumber higher than 1000 cm-1 appears. It means that these types measurements did not discover any phase transitions for the CFO ceramic. It agrees with other data journal-10 . Interpretation of Raman spectra in the temperature range (300 - 870) K journal-13 and for CFO particles journal-14 , and single crystal journal-8 can be used in this case. The obtained results of the measurements of the lead-free CoFe2O4 ceramic suggest the wide possibility of practical application of this material.
Acknowledgments
The infrared (MIR and FIR) researches were carried out with the equipment purchased thanks to the financial support of the European Regional Development Fund in the framework of the Polish Innovation Economy Operational Program (contract no. POIG.02.01.00-12-023/08). The calculations were done at the Academic Computer Centre CYFRONET AGH, Cracow, Poland (Grants ID: MNiSW/IBM_BC_HS21/UJ/032/2009 Mars Supercomputer) using Materials Studio 5.5 within Accelrys ®polish national license.
Supplementary Information Available
Supporting information about the vibrational analysis of CoFe2O4 may be found in the online version of this article, presenting the visualisation of all the normal vibrations. This information is available free of charge via the Internet at http://….
References
- (1) V.K. Wadhawan, Introduction to ferroic materials, (Gordon and Breach Science Publishers, The Netherlands, 2000)
- (2) S.N. Okuno, Appl. Phys. 71, 5926 (1992)
- (3) V. Pallai, D.O. Shah, J. Magn. Magn. Matter 163, 243 (1996)
- (4) N. Moumen, P. Bonville, M.P. Pileni, J. Phys. Chem. 100, 14410 (1996)
- (5) S. Ammar, A. Helfen, N. Jouini, F. Fievet, I. Rosenman, F. Villain, P. Molinie, M. Danot, J. Mater. Chem. 11, 186 (2001)
- (6) B.H. Liu, J. Ding, Appl. Phys. Lett. 88, 042506-1 (2006)
- (7) Y.W. Ju, J.H. Park, H.R. Jung, S.J. Cho, W.J. Lee, Mater. Sci. Engin. B 147, 7 (2008)
- (8) W.H. Wang, X. Ren, J. Cryst. Growth 289, 605 (2006)
- (9) J. Rodriguez-Carvajal, Abstract Satelite Meeting on Powder Diffraction, (Congr. Int. Union of Crystallography, Toulouse, 1990)
- (10) Landolt-Börnstein, New Series III/4b, (Springer, New York, 1970)
- (11) W. Śmiga, B. Garbarz-Glos, Ferroelectrics 377, 137 (2008)
-
(12)
R. W. G. Wyckoff, The second edition of Structure of Crystals,The Chemical Catalog Company, INC, New York 1931 pg.290;
from: http://www.crystallography.net/ - (13) J. Piekarczyk, H.W. Hennicke, R. Pampuch, cfi/Ber. D. K. G. 59, 227 (1982)
- (14) T. Yu, Z.X. Shen, Y. Shi, J. Ding, J. Phys. Condens. Matter 14, L613 (2002)
- (15) P.Chandramohan, M.P. Srinivasan, S. Velmurugan, S.V. Narasimhan, J. Sol. State Chem. 184, 89 (2011)
- (16) Materials Studio 5.5, Accelrys Software Inc.©, 2001-2011.
- (17) S. J. Clark, M. D. Segall, C. J. Pickard, P. J. Hasnip, M. J.Probert, K. Refson, M. C. Payne, Z. Kristallogr. 220, 567 (2005)
- (18) J. P. Perdew, K. Burke, Y. Wang, Phys. Rev. B 54, 16533 (1996)
- (19) J. P. Perdew, K. Burke, M. Ernzerhof, Phys. Rev. Lett. 77, 3865 (1996)
-
(20)
A. Rappe, J. W. Bennett, http://opium.sourceforge.net/
http://www.sas.upenn.edu/rappegroup/htdocs/Research/psp_gga.html