Present address: ] Research Center for Neutrino Science, Tohoku University, Sendai 980-8578, Japan
Innovative Demodulation Scheme for Coherent Detectors in CMB Experiments
Abstract
We propose an innovative demodulation scheme for coherent detectors used in cosmic microwave background polarization experiments. Removal of non-white noise, e.g., narrow-band noise, in detectors is one of the key requirements for the experiments. A combination of modulation and demodulation is used to extract polarization signals as well as to suppress such noise. Traditional demodulation, which is based on the two-point numerical differentiation, works as a first-order high pass filter for the noise. The proposed demodulation is based on the three-point numerical differentiation. It works as a second-order high pass filter. By using a real detector, we confirmed significant improvements of suppression power for the narrow-band noise. We also found improvement of the noise floor.
pacs:
07.57.Kp, 98.70.Vc, 98.80.-kDetection of primordial gravitational waves could provide a new and unique window on the very early universe. Degree-scale odd-parity patterns in cosmic microwave background (CMB) polarization, -modes, are a smoking-gun signature of the primordial gravitational waves intro1 . Since -modes are very faint ( nK), it is essential to accumulate observation data for long time, e.g., a few years. We evaluate the -modes by using the CMB power spectrum Durrer:2008eb . Suppose polarization sensitive detectors have white Gaussian noise, the precision of the measured spectrum is inversely proportional to the data integration time. However, for real experiments, the data contain non-white components in analysis band; line noise (narrow band noise). Potential sources of such noise are AC line noise, mechanical resonances of the telescope and so on. The line noise degrades the sensitivity improvement with respect to data integration time. In the case of the experiments which use coherent detectors QUIET ; PLANK , the CMB polarization signal is extracted by a combination of modulation and demodulation. This technique can also suppress the non-white noise.
In this paper, we suggest improved demodulation scheme based on the idea extension to three-point differentiation from the two-point one. It drastically improves the suppression of the line noise in the analysis band. Therefore, the residual line noise in the two-point demodulation can be suppressed further, even if we do not know the sources of the line noise.
In the case of coherent detectors, the phase of the input CMB polarization signal is shifted by changing two microwave paths which have different path lengths. The difference is designed to correspond to a half wave length of the input CMB signals. Therefore, periodic path switching works as sign modulation at a given frequency. Two-point differentiation between two modulation states, namely two-point demodulation, extracts the polarization signals and filters noise components at frequencies lower than the modulation frequency. As a result, the demodulated data have a white spectral density whose floor is determined by the input noise at around the modulation frequency.
The raw output at time of the detector can be described as follows:
| (1) |
where is the phase state of the polarization signals, and are the magnitude of the polarization signals and the noise respectively. Here, is the normalized time index with respect to a half cycle of the modulation frequency. We re-define in case the is odd (even) number;
| (2) | |||||
| (3) |
where is the integer number, i.e., .
Traditional demodulation, namely two-point demodulation, can be defined as,
| (4) | |||||
| (5) |
Here corresponds to the modulation frequency. In case of the QUIET experiment QUIET , the modulation frequency is kHz footnote to suppress the noise because its knee frequency is typically a few kHz. Within such a short time interval, variation of observing direction, i.e., variation of the CMB signals, is negligible (). The two-point demodulation is re-written as follows,
| (6) |
where is the time index which synchronizes with the modulation, i.e., and is the two-point difference of the noise. The formula indicates that the two-point modulation works as a first-order high pass filter for the noise. The transfer function from to , i.e., noise filtering power, is shown as a function of frequency in Fig. 1.

Three-point demodulation improves suppression power further by applying one more high pass filter. It is defined as follows,
| (8) | |||||
| (9) |
where and . We can also treat does not vary within the time interval between and . The term is the difference of the two-point differentiations. The three-point demodulation can doubly suppress the low-frequency noise, i.e., it works as a second-order high pass filter as shown in Fig. 1. Therefore, we can suppress the residual line noise in the two-point demodulation by using the three-point demodulation without study for the line noise sources. It can be explained intuitively that smoothing with three neighboring points is more powerful for the low-frequency noise than the smoothing with two neighboring points. The extracted polarization signals do not change unless the demodulation frequency is different from the modulation frequency.
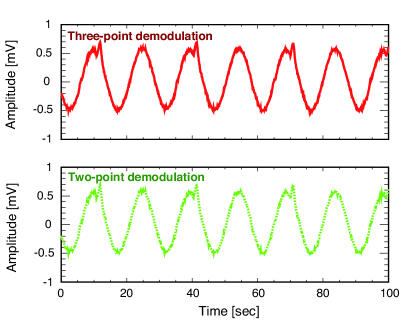
We evaluate the actual impact of the three-point demodulation in real data. The demodulation functions are implemented on the readout electronics board adc to be quickly used in the experiment. The details of the experimental setup are described in hase . Under the condition of 14 Kelvin of load temperature condition, we irradiate 0.6 Kelvin of the polarization which is rotated at seconds of cycle; the QUIET’s detector QUIET measures sinusoidal polarization response in the demodulated data (Fig. 3). We confirmed both demodulation methods measure the same polarization signals; both lock-in amplitudes are consistent within the precision of .
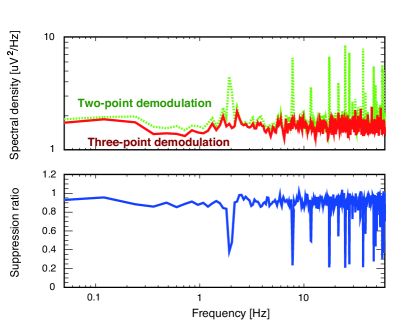
We also measure the demodulated data without any variation of the input polarization signals. The top panel of Fig. 3 shows noise spectral densities of each demodulation. Their ratio is also shown in the bottom panel of Fig. 3. Most of line noise disappeared as expected. We also found 8.4% of improvement for the noise floor in the demodulated data. This is the by-product of the three-point demodulation. The measured noise floor is determined by the input noise level at around the modulation frequency. By using the two-point demodulation, contamination from the noise has not been suppressed perfectly. The three-point demodulation improves the suppression.
To understand the improvement of the noise floor, we performed a simulation. We generated the noise stream that corresponded to the second term in Eq. (1) based on the simple model that consists of the white noise and the noise as , where is the knee frequency, is index to model the shape empirically, and is the white noise level in a spectral density. The generated noise stream also includes a line noise at 20 Hz.
| Input noise properties | Noise floor (V2/Hz) | ||||
| (kHz) | (V2/Hz) | ||||
| 1.0 | 1.0 | 1.0 | 1.18 | 1.16 | 1.15 |
| 1.0 | 1.5 | 1.0 | 1.21 | 1.15 | 1.13 |
| 2.0 | 1.0 | 1.0 | 1.31 | 1.27 | 1.26 |
| 2.0 | 1.5 | 1.0 | 1.47 | 1.32 | 1.30 |
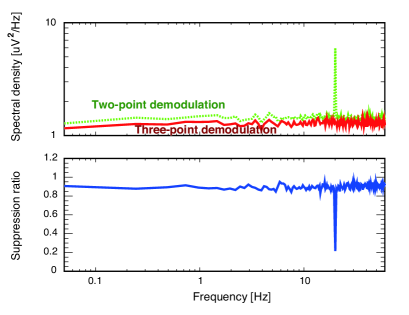
Figure 4 shows the noise spectral densities from both demodulations for the simulation data with (, , )=(2.0 kHz, 1.5, 1.0 V2/Hz) and their ratio as a function of frequency. We confirmed both the line suppression and the improvement of the noise floor by 10.1%. The noise floor depends on the noise properties as listed in Table I. In case of the higher or higher , the noise floor in the two-point demodulation is higher than one for the three-point. In other words, the three-point demodulation has higher suppression power for the noise contamination at around the modulation frequency. Typical detector properties of QUIET’s detectors are (, , ) is (– kHz, –, 1.0 V2/Hz). We expect several percent of improvement for the noise level in the demodulated data. This simulation explains the observed improvements of the noise floor in the real data.
We also estimate the level of the noise floor with four-point demodulation. The difference from the three-point demodulation is at most a few percents (Tab. 1). Compared with the complexity of implementing the logic in the readout electronics, its impact is relatively low. We could achieve sufficient performance with the three-point demodulation within the range of the parameters for the detectors.
In summary, we suggest using three-point demodulation for coherent detectors in the CMB experiments. This innovative demodulation strongly suppresses non-white noise, e.g. the line noise, in the data, which is one of the most important issues for CMB polarization experiments. The three-point demodulation is also immune to the tail of noise, which results in improvement of the measured noise floor. We confirmed both impacts in the real data by using QUIET’s detector. This technique is applicable to ongoing experiments, e.g., PLANK-LFI, and proposed experiments, e.g., QUIET Phase-II.
We acknowledge QUIET collaboration, especially California Institute of Technology, Jet Propulsion Laboratory and Fermi National Accelerator Laboratory for providing detectors and their electronics to control the detector bias. We also thank Donna L. Kubik for carefully reading the manuscript. This work was supported by a Grant-in-Aid for Scientific Research on Innovative Areas (21111002) of The Ministry of Education, Culture, Sports, Science, and Technology, Japan.
References
- (1) L. M. Krauss, S. Dodelson, and S. Meyrt, Science 328, 989-992 (2010).
- (2) R. Durrer, THE COSMIC MICROWAVE BACKGROUND (Cambridge Unisersity Press, 2008).
- (3) QUIET Collaboration, Astrophys. J. 741, 111 (2011).
- (4) A. Mennella, M. Bersanelli, R. Butler, A. Curto, F. Cut- taia, et al., Astronomy & Astrophysics 536, A4 (2011).
- (5) The modulation/demodulation at a higher frequency is a good scheme to suppress the non-white noises. However, such modulation makes more the phase flips on the phase switches. The phase flips induce ringing spikes which must be masked. Compared with the sampling loss induced by the mask, the modulation frequency of 4 kHz is a natural condition to maximize the power of the noise suppression.
- (6) K. Ishidoshiro, M. Nagai, T. Higuchi, M. Hasegawa, M. Hazumi, M. Ikeno, O. Tajima, M. Tanaka, and T. Uchida, To appear in IEEE Transactions on Nuclear Science (TNS) (2012), arXiv:1112.0644 [astro-ph.IM].
- (7) M. Hasegawa, O. Tajima, Y. Chinone, M. Hazumi, K. Ishidoshiro, and M. Nagai, Rev. Sci. Instrum. 82, 054501 (2011).