Chemical modeling of Infrared Dark Clouds: the Role of Surface Chemistry
Abstract
We simulate the chemistry of infrared dark clouds (IRDCs) with a model in which the physical conditions are homogeneous and time-independent. The chemistry is solved as a function of time with three networks: one purely gas-phase, one that includes accretion and desorption, and one, the complete gas-grain network, that includes surface chemistry in addition. We compare our results with observed molecular abundances for two representative IRDCs – IRDC013.90-1 and IRDC321.73-1 – using the molecular species N2H+, HC3N, HNC, HCO+, HCN, C2H, NH3 and CS. IRDC013.90-1 is a cold IRDC, with a temperature below 20 K, while IRDC321.73-1 is somewhat warmer, in the range 20 - 30 K. We find that the complete gas-grain model fits the data very well, but that the goodness-of-fit is not sharply peaked at a particular temperature. Surface processes are important for the explanation of the high gas-phase abundance of N2H+ in IRDC321.73-1. The general success of the 0-D model in reproducing single-dish observations of our limited sample of 8 species shows that it is probably sufficient for an explanation of this type of data. To build and justify more complicated models, including spatial temperature and density structure, contraction, and heating, we require high-resolution interferometric data.
1 Introduction
Based on line and continuum observations as well as supporting simulations, the evolutionary stages of low-mass stellar and planetary formation are relatively well understood. The molecular inventory and chemistry of these stages – cold starless cores, pre-stellar cores, Class-0 sources and hot corinos, outflows, and protoplanetary disks – have been extensively investigated both observationally and theoretically (e.g., Bergin & Langer, 1997; Wakelam et al., 2004; Bergin & Tafalla, 2007; Aikawa et al., 2008; Vasyunin et al., 2009; Herbst & van Dishoeck, 2009). The large amount of high-quality observational data makes the construction of complex spatial models of low-mass protostars feasible with chemistry, dynamics, and radiative transfer often combined.
In the field of massive star-formation, the overall situation is not as well developed, partially because massive young stellar objects exist in complex regions and tend to be more distant. The best studied stage is doubtless the hot core, which is a warm region (200 K - 300 K) in which the chemistry differs strongly from the cold envelope. This chemistry has been studied for at least two decades, with the current consensus that the complex organic molecules detected in the gas are formed mainly on and in grain ices both before and during the warm-up stage (Brown et al., 1988; Caselli et al., 1993; Rodgers & Charnley, 2001; Viti et al., 2004; Garrod et al., 2008). Nor have only complex molecules been studied; Busquet et al. (2011) have investigated the NH3/N2H+ abundance ratio towards the high-mass star-forming region AFGL 5142 and shown that the abundance ratio is strongly affected by the high temperatures. The physical structure of hot cores has been studied by Nomura & Millar (2004), while some physical models have been developed for starless cores that might pertain to the high-mass limit (Keto & Caselli, 2008, 2010). Recent work on the chemistry of intermediate-mass Class 0 protostars has also been reported concerning CO depletion and N2H+ deuteration (Alonso-Albi et al., 2010).
Unlike high-mass protostars, infra-red dark clouds (IRDCs) are thought to represent the earliest stages of massive stars. These distant objects were discovered 15 years ago with the Infrared Space Observatory (ISO; Perault et al., 1996) and Midcourse Space Experiment (MSX; Egan et al., 1998) through their appearance as dark silhouettes against the bright Galactic mid-infrared background. Detected IRDCs show a broad range of masses from several dozens to several thousands of solar masses (Carey et al., 2000; Rathborne et al., 2006; Vasyunina et al., 2009), densities from cm-3 to cm-3 (Carey et al., 1998; Gibson et al., 2009), and typical temperatures from 8 K to 20 K (Carey et al., 1998; Pillai et al., 2006; Devine et al., 2011; Ragan et al., 2011). Since their initial discovery, several molecular line observations have been published for IRDCs (e.g. Carey et al., 1998; Ragan et al., 2006; Battersby et al., 2010; Cyganowski et al., 2009; Brogan et al., 2011; Sakai et al., 2012). This allowed the construction of the first models (e.g., Gibson et al., 2009; Sakai et al., 2012). Still, the results of these models could only be compared with a few observed molecules, and the models contained a simpler physical structure than their low-mass starless analogs. Only recently have molecular surveys, in which many lines were observed for the same object, started to appear in the literature (Sakai et al., 2008, 2010; Vasyunina et al., 2011; Foster et al., 2011). During the Mopra molecular line survey, Vasyunina et al. (2011) searched for 37 points within southern IRDCs using rotational lines of 13 molecular species. These data can be analyzed to give molecular columns and abundances, and these quantities can be compared with the results of chemical simulations, which is a goal of our research.
Because IRDCs are cold and dense, at least as seen through the beam of single-dish telescopes, they might be expected to resemble low-mass starless cores in their chemistry. Yet their temperature range and overall density both tend to be higher, and there is much less knowledge of the physical structure of these distant sources. So, it is useful to study their chemistry as distinct objects and then compare salient aspects of it with both low-mass prestellar cores, generally of somewhat lower temperature and density, and high-mass protostellar objects, generally of higher temperature and density.
Although most IRDCs studied to date have temperatures below 20 K, we can distinguish some IRDCs with higher temperatures. For the present study, we selected two clouds for chemical study: IRDC013.90-1 from the colder group and IRDC321.73-1 from the warmer group. Both clouds have a simple morphology at mid-IR, sub-millimeter, and millimeter wavelengths and have been studied with the most molecular species. Furthermore, the kinematic distance of both regions is clearly below 3 kpc and thus at the lower end of distances for the Mopra sample.
The paper is organized in the following manner. In Section 2 we introduce the IRDCs to be modeled, while in Section 3, we discuss the chemical model itself. In Section 4, observational and modeled molecular abundances are compared. We discuss the chemistry in some detail in Section 5 and present our conclusions in Section 6.
2 Observational data
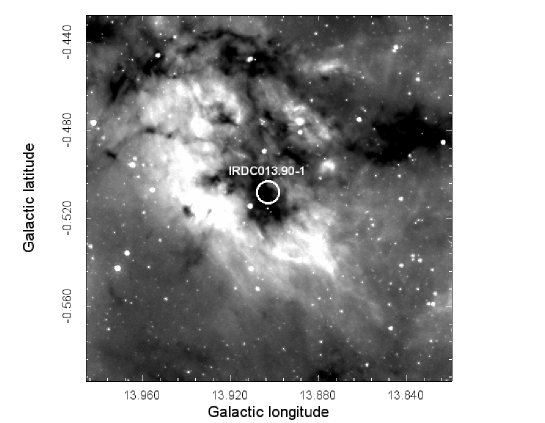
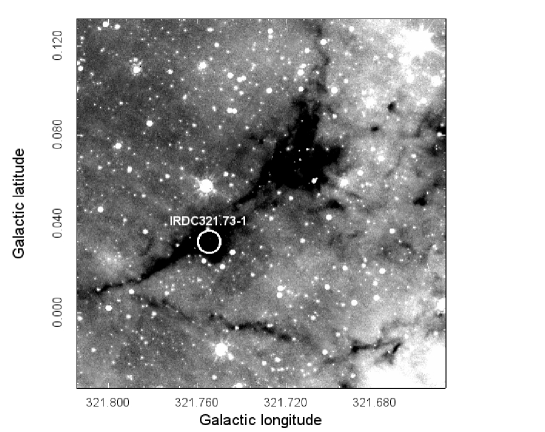
For our modeling study, we chose IRDC013.90 - 1 (, ) and IRDC321.73 - 1 (, ), the observation of which was reported in the Mopra survey by Vasyunina et al. (2011). IRDC013.90 - 1 is a part of a large complex (Figure 1, upper panel) and IRDC321.73 - 1 is an eastern component of IRDC 321.73+0.05, as shown in Figure 1, lower panel. Both clouds show compact rather than filament structure at millimeter, submillimeter and mid-infrared wavelengths. As part of the program to investigate dust properties in southern IRDCs, Vasyunina et al. (2011) estimated their masses and H2 column densities based on 1.2 mm continuum data. For IRDC013.90 - 1 the mass is , while for IRDC321.73-1 the mass is ; the masses are more than enough to form not only low- and intermediate–mass stars, but also one or two early B stars. In comparison with other clouds from the list, IRDC013.90 - 1 and IRDC321.73-1 have a quite high H2 column density of cm-2 and cm-2 respectively (Vasyunina et al., 2009). Such a high column density, considering that it is derived from single-dish observations with a large beam, can lead to the absence of any emission at 3.6 - 8 m; indeed, only at 24 m can very weak sources be detected in IRDC013.90 - 1 and IRDC321.73-1. Given an angular cloud size of about 10′′, we can transform column densities into volume densities, which are cm-3.
The main distinction between the two chosen clouds is their ammonia kinetic temperature. In the case of IRDC013.90 - 1 it is 13 K, while in the case of IRDC321.73 - 1 it is 22 K, which is higher than “normal”. From the astrophysical point of view, a 9 Kelvin difference may not be dramatic; however, this difference can be important for chemical processes on grain surfaces, the rates of which are exponentially sensitive to temperature.
For the present study we used molecular abundances for N2H+, HC3N, HNC, HCO+, HCN and C2H from the Mopra molecular line survey (Vasyunina et al., 2011). These abundances were obtained using the H2 column density estimated from 1.2 mm SIMBA/SEST data from Vasyunina et al. (2009), adopting the corresponding beam size. To add to the molecular data for modeling purposes, we included NH3 data and CS molecular abundances from other observations. Ammonia observations were performed with the Parkes telescope (Linz et al. in prep.), where both IRDC013.90 - 1 and IRDC321.73-1 were covered. CS(2-1) observations for IRDCs from the fourth Galactic quadrant were performed by Jackson et al. (2008) and do not include IRDC013.90 - 1 from the first quadrant. To calculate the CS column density for IRDC321.73-1 from the available integral intensity, we used Eq. 1 from Vasyunina et al. (2011). Furthermore, we estimated the CS and NH3 molecular abundances in the same way as for other species - adopting the H2 column density from 1.2 mm SIMBA/SEST data (Vasyunina et al., 2009), with the corresponding beam size. Observed abundances with respect to H2 for all species used in this study are listed in Table 1, along with calculated abundances described later in the text.
3 Model
For the chemical simulations, we utilized a pseudo–time–dependent 0-D model, in which the density and temperature remain fixed and homogeneous as the chemistry progresses from initial abundances to a final steady-state condition, where for all species in the model, the processes of formation and destruction balance out. Thus, we consider a stationary model in the sense that it does not include any large-scale dynamical processes such as warm-up or collapse, although we do consider adsorption and desorption between gas and grains. The term “pseudo-time-dependent” does not mean that the chemistry arrives at a steady-state within a reasonable time; indeed, for gas-grain models, steady-state conditions are not easily achievable, and can take as long as 108-12 yr to reach, depending upon the efficiency of non-thermal desorption, at which time much of the molecular material involving heavy elements can lie in grain mantles (Garrod et al., 2007).
As we show below, to justify more complicated models, more advanced observational data are required. In the present study, we use molecules that all trace approximately the same temperature and density conditions. Another observational limitation is spatial resolution. Single-dish observations of the clouds located at several kpc distance do not allow the resolution of structures that are smaller than 0.5 pc. Thus any dynamical processes that happen on a smaller scale will be smoothed over the beam size. Under such circumstances, the use of a 1-D model, where temperature and density are different at different radii from the core center, is premature.
In this study, rate equations were employed together with three different networks of reactions based on the KIDA network release described in Semenov et al. (2010), which are in turn based on the Ohio State University (OSU) gas-grain chemical network. The first network is one in which all surface processes and coupling between gas and dust are removed except for the surface process of formation of H2 via the reaction H + H H2 and ion-grain collisions. The second network adds accretion onto and desorption from grains to the first modification. We include two types of desorption in these networks: thermal evaporation, which begins to be important at temperatures 15K, when desorption of the most vaporizable species affects the gas-phase chemistry, and cosmic ray desorption, which can dominate at temperatures 15K (see Figure 8 in Bergin & Tafalla, 2007) . Photodesorption is not included in the model for two reasons. First, the objects considered in this paper are sufficiently opaque, with A, so that the rate of photodesorption via external photons is small (Vasyunin et al., 2008). Secondly, cosmic ray-induced photons cause significant photodesorption only at times greater than 106 yr. Nor do we include desorption via chemical reactions, such as the heat generated by H2 formation.The third network used is the full network, which includes all gas-phase and grain surface reactions. Although desorption via exothermic reactions on the surface can occur when this network is used in a model (Garrod et al., 2007), its effect is strong mainly for complex molecules, which are not considered here. Further in the text we refer to the three networks and the models based on them as “gas-phase”, “accretion/desorption”, and “surface” networks, respectively.
Starting with “low-metal” initial abundances (Morton, 1974; Graedel et al., 1982; Wakelam & Herbst, 2008), shown in Table 2, we ran the code with several sets of gas densities and temperatures. All other parameters, listed in Table 3, were fixed. We assume a cosmic ray ionization rate for H2 of 1.3 s-1, a granular radius of cm, a granular mass density of 3.0 g cm-3, a visual extinction of 10, and a gas-to-dust mass ratio of 100, all of which are typical values for dark clouds.
In this study, we considered only diffusive (Langmuir-Hinshelwood) surface chemical reactions involving physisorbed species. The monolayers of ice that form are treated as a fully reactive phase, which leads to what is known as a “two-phase” model (Hasegawa et al., 1992). We assume that the diffusion of species on the surface is caused only by thermal hopping, and that quantum tunneling is inefficient even for the lightest species (Katz et al., 1999). The diffusion/desorption energy ratio () is chosen to be 0.5, which is somewhere in between the extreme estimates of 0.3 (Hasegawa et al., 1992) and 0.77 (Ruffle & Herbst, 2001). The assumed site density is 1.5 1015 cm-2, typical for an olivine surface (Katz et al., 1999).
To compare the agreement among model results and observations, we used two criteria. First, we simply counted the number of species for which calculated abundances are in agreement with observation to within an order of magnitude at time . Since there are 8 observed species for IRDC321.73 - 1, and 7 for IRDC013.90 - 1, the maximum values of for each cloud are 8 and 7, respectively. Assuming that all lines except those of HCO+ are optically thin, and that the ammonia kinetic temperature equals the excitation temperature, we achieve a factor of a few for the uncertainties in the observational values (Vasyunina et al., 2011). But, taking into account uncertainties in the rate coefficients and initial abundances in the model, we can easily reach a one order-of-magnitude total error range (Vasyunin et al., 2004, 2008; Wakelam et al., 2005, 2006, 2010). Secondly, for every species we estimate a confidence parameter from Garrod et al. (2007):
| (1) |
where is the observed abundance and is the calculated abundance, , and is the complementary error function for species () ; with this definition ranges between zero and unity. A calculated value that lies 1 order of magnitude from has a confidence parameter of 0.317, while a value 2 orders of magnitude from has a confidence parameter of 0.046. Unlike the choice of Garrod et al. (2007), as global confidence parameter for the whole set of species we use the lowest value instead of the average. Thus, we estimate the confidence parameter for the species that shows the worst agreement between model and observations, and hence, all other molecules exhibit better agreement between model and observations. In this study, we have a limited set of observed molecules to be compared with model, so that it is important to reproduce abundances well for all molecules. Our choice for a global confidence parameter allows it to be high only in the case where all species are reproduced well.
4 Results
We have run models with all three networks over a range of temperatures for two H2 densities – 105 cm-3 and 106 cm-3. The temperatures used range from 10 K to 40 K, with 5 K steps between 10-30 K. In this section, we emphasize results for conditions relating to “cold” and “warm” IRDCs.
4.1 A “Cold” IRDC: IRDC013.90 - 1
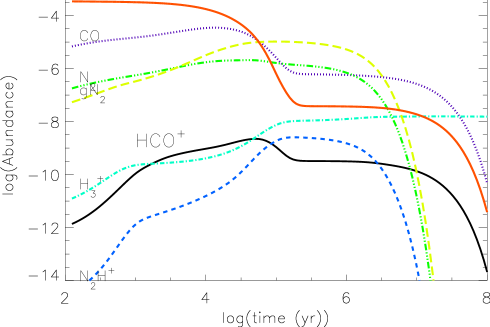
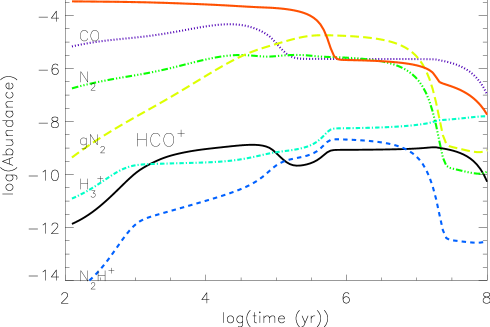
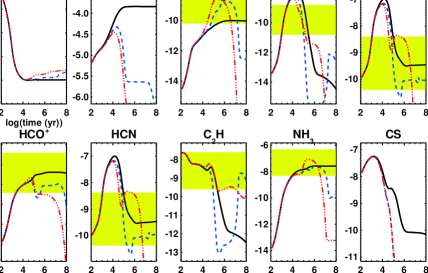
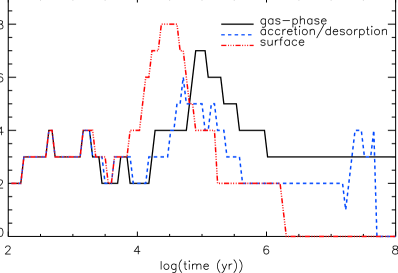
Figure 2 (topmost 10 panels) shows modeled abundance profiles at times through 108 yr at K and cm-3 for ten species including CO, CS and electrons, although CO has not been studied in the two sources, and CS data are not available for IRDC013.90 - 1. The boxes in the panels represent observational values for IRDC13.90-1 with respect to H2 one order of magnitude. With both the accretion/desorption and surface networks, CO freeze-out, which occurs after 103.5 yr, plays an important role, as will be discussed in the next section. Indeed, the complete freeze-out of CO is prevented mainly by cosmic ray desorption. As gaseous CO is lowered in abundance, the abundance of HCO+ is diminished, while the abundance of N2H+ increases and for a time rises to more than an order of magnitude higher than the abundance for the gas-phase network before diminishing.
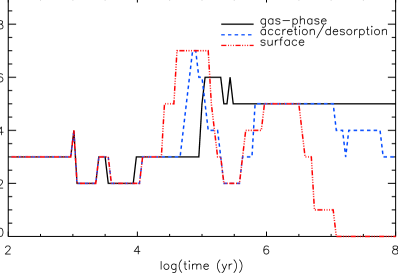
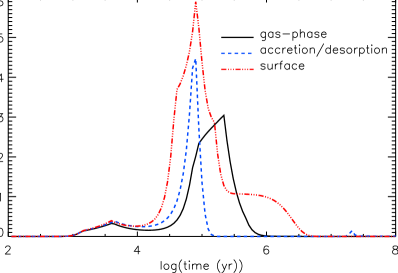
The value of for the 7 observed species is shown in the middle portion of Figure 2. Both the surface and accretion/desorption networks fit all 7 available observational abundances simultaneously although the time range of agreement for the surface network, yr, is much longer. With the gas-phase network, a maximum of 6 occurs at a somewhat later time, as both N2H+ and C2H take turns being only slightly outside the observational limits. The highest (best) value of the confidence parameter occurs for the surface network, in the vicinity of yr, as can be seen in the bottom panel of Figure 2. So, at the temperature and density used, the complete gas-grain network does a marginally better job than the other two. Modeled abundance values are presented in Table 1 for the surface network with cm-3 and K at a time of yr, when the confidence parameter reaches its maximum.
Were the physical conditions for IRDC013.90 - 1 not measured, would our simulations enable us to determine them unambiguously? Even if we only consider the surface network, the situation is murky. In Table 4, we list the maximum and values for the three networks at temperatures from 10 K to 30 K at 5 K intervals and H2 densities of 105 cm-3 and 106 cm-3. One can see that a parameter of 7 is achieved with the surface network for all temperatures at the lower density and for two temperatures at the higher density. If we use the parameter , we see that equal fits are obtained for the lower of the two densities at 15 K (the observed temperature) and 25 K. We can conclude only that the lower density is slightly preferred, in agreement with observations.
4.2 A “Warm” IRDC: IRDC321.73 - 1
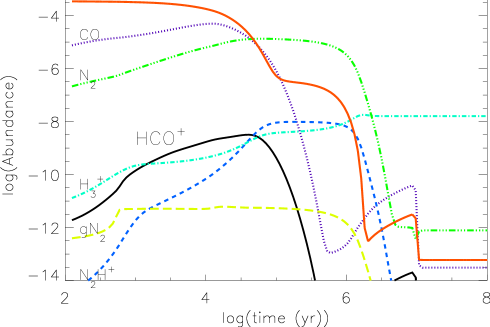
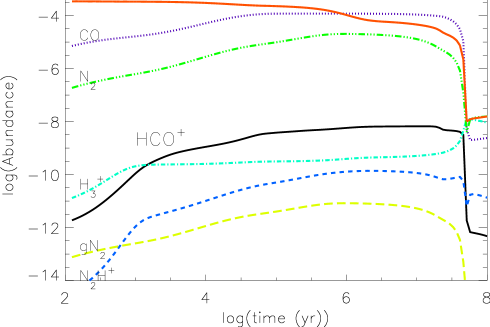
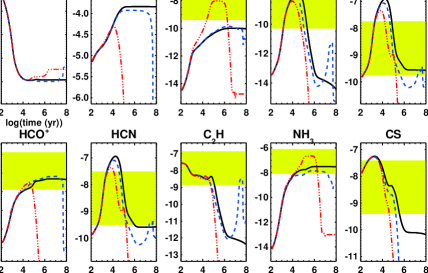
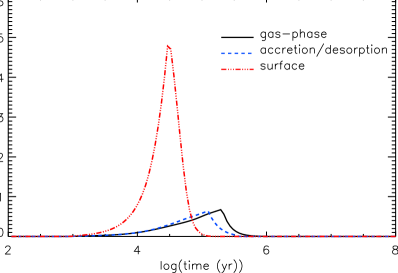
The topmost part of Figure 3 shows observational abundances together with modeled abundances at K and cm-3. Under these conditions, the gas-phase and accretion/desorption networks show similar abundance profiles, whereas the surface network gives different results. Unlike the situation at 15 K, the gaseous CO abundance stays high for a considerable amount of time for the accretion/desorption case, but not for the surface case. Even here, the freeze-out starts somewhat later than at the lower temperature. As the freeze-out occurs, the HCO+ abundance once again undergoes a steep decline. At the same time, the N2H+ abundance once again increases. As can be seen in Figure 3, at 25 K only the surface network allows us to reproduce the observed N2H+ abundance at reasonable times.
The middle panel of Figure 3 shows that only the surface network yields the highest value for of 8, which occurs from 2104 yr to 4104 yr. For the surface network, the peak value of , which is the highest of the three networks by a considerable margin, occurs at yr. Modeled abundance values are presented in Table 1 for the surface network with cm-3 and K at the time when the confidence parameter reaches its maximum.
As can be seen in Table 4, the surface network prefers physical conditions in the range K with cm-3, where the maximum , although the fall-off at both lower and higher temperatures is only to . The criterion yields a similar result. Thus, unlike the cold case, the somewhat higher temperature of IRDC321.73 - 1 is reproduced to some extent by chemical modeling with the surface network.
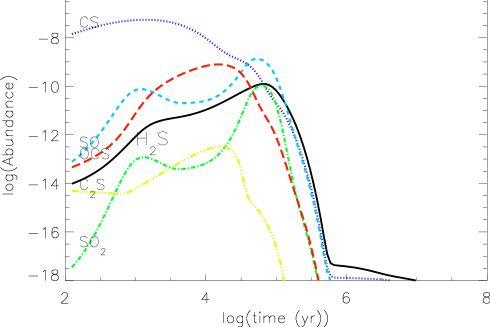
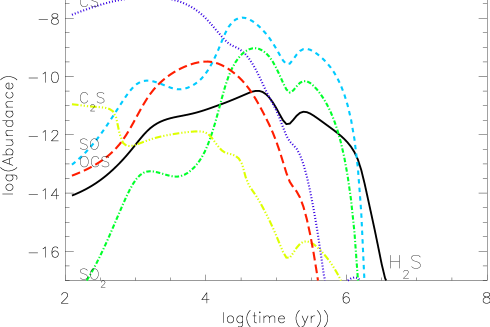
We present predictions for the abundance profiles of 12 species in Figure 4 that have not yet been observed. The panels on the left of the figure correspond to the “cold” case (15 K), while right panels correspond to the “warm” case (25 K); in both cases the surface network was used. In exploring differences between the results at the two temperatures, the sulfur-bearing species SO, SO2 and C2S stand out with 1-2 order-of-magnitude differences in abundance. Hence, observation of these species can reduce the temperature uncertainties deduced from model results, which is in agreement with previous work by Wakelam et al. (2004, 2010). The prediction of low fractional abundances for C2S at both temperatures in the range 104-6 yr is in agreement with the observations of Sakai et al. (2008).
5 Discussion of the Chemistry
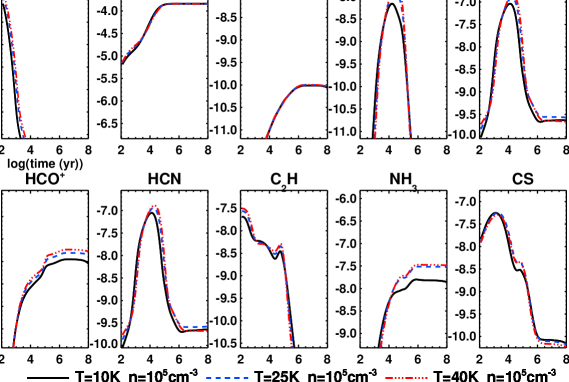
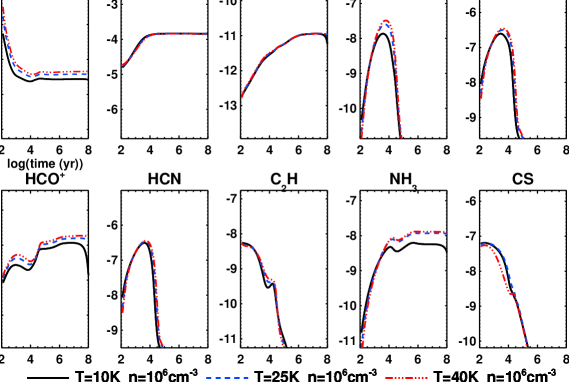
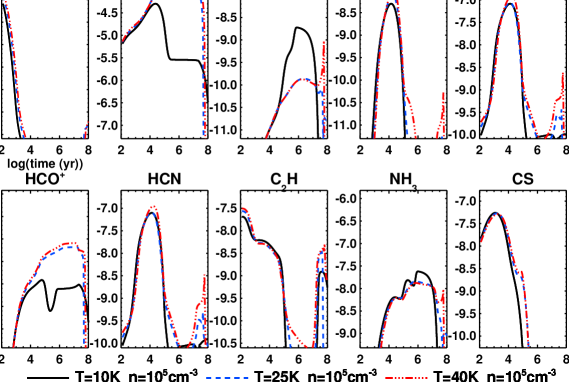
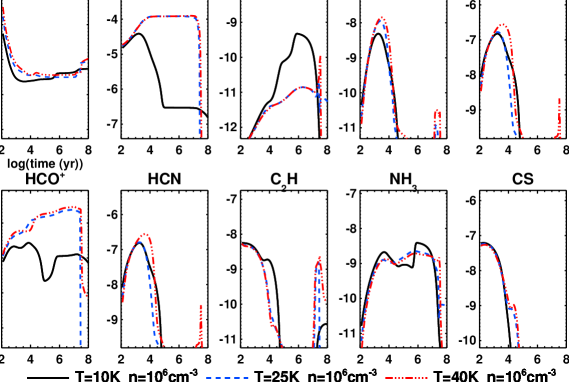
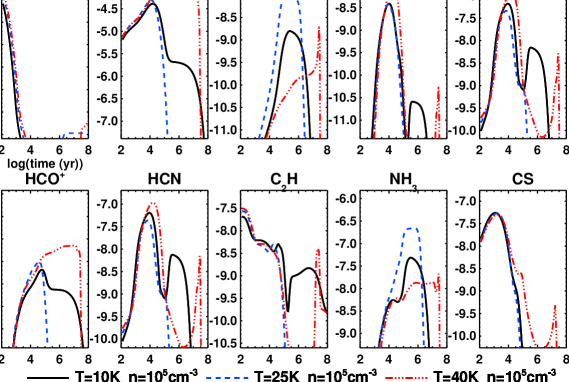
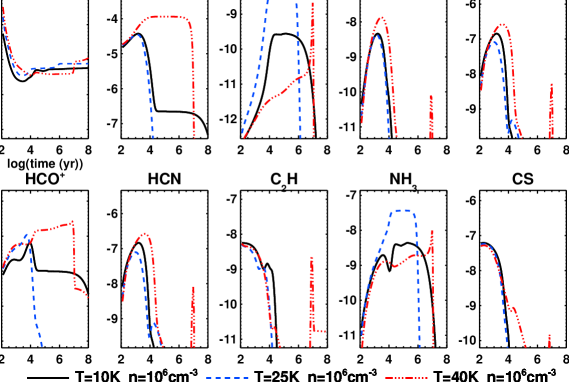
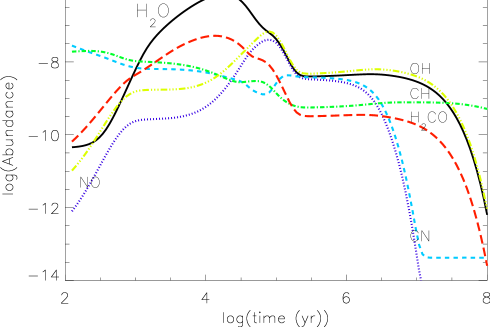
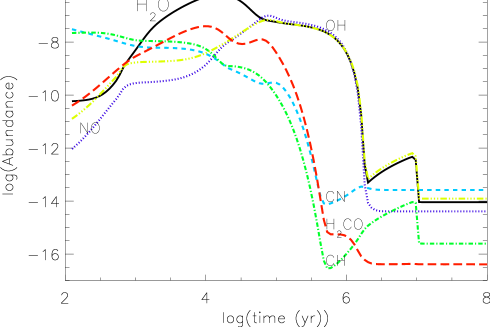
In general, the calculated molecular abundances depend least on temperature for the gas-phase network and more strongly for networks involving gas-grain interactions. This can be seen by comparing results in Figures 5, 6, and 7, which show calculated molecular profiles for the observed species with the gas-phase, accretion/desorption, and surface networks, respectively. The physical conditions depicted include temperatures of 10 K, 25 K, and 40 K, at H2 densities of 105 cm-3 and 106 cm-3. These results supplement the molecular profiles already shown in Figures 2 and 3 for 15 K and 25 K at the lower density. Given the much stronger sensitivity to temperature of surface processes, the result is not remarkable.
The chemical differences between the accretion/desorption and surface networks at 25 K are of particular interest. The accretion/desorption network produces abundance profiles similar to the gas-phase rather than to the surface network. This pattern occurs because the abundance of CO and, hence, HCO+, does not decrease until 108 yr except with the surface network. In the accretion/desorption network, at T=25 K, the freeze-out of CO onto grain surfaces:
| (2) |
is compensated by desorption back into the gas phase:
| (3) |
where gr stands for a species on the grain surface. In the surface network, on the other hand, when CO freezes out on the grain surface, it does not desorb predominantly back into the gas phase. Rather, it is destroyed more rapidly by reactions with other surface species; e.g.,
| (4) |
| (5) |
These two reactions are the most efficient processes destroying CO on grain surfaces in our model. The reaction with sulfur has no barrier, while the reaction with OH has a small activation barrier of 80 K. This barrier significantly reduces its rate at 10 K, but has little influence on the rate at 25 K.
At first glance, the low abundance of gas-phase CO in the model with surface reactions might totally explain the enhancement of N2H+, which can be seen in Figures 3 and 7. The main destruction route of N2H+ is via the reaction
| (6) |
the importance of which has been discussed in the literature (Bergin & Tafalla, 2007) for a variety of sources, ever since the initial work of Snyder et al. (1977). Via this reaction, a decrease in the gaseous CO abundance leads directly to an increase in the N2H+ abundance as long as the production rate of the ion is maintained, a situation that need not occur if gaseous N2 is also depleted. Indeed, for low-mass starless cores, the abundance of N2H+ can be constant in abundance towards the center despite the loss of gaseous CO (Tafalla et al., 2004). Towards low-mass protostellar cores, there is some evidence for an increase in the abundance of N2H+ based on the study of the abundance ratio NH3/N2H+ (Caselli et al., 2002). The situation of intermediate-mass protostellar sources is more complex; although models with a constant abundance of N2H+ fit some of the data, other data are fit with a depletion of this ion when gaseous CO is depleted (Alonso-Albi et al., 2010). Finally, the case of N2H+ towards the massive protostellar cluster AFGL 5142 shows this ion and HCO+ to be anti-correlated in the central core because, as the authors suggest, the high temperature (70 K) allows the CO to evaporate from grain mantles (Busquet et al., 2011).
In our study of IRDCs, we find that the situation is also complex, since here reaction (6) is not the sole cause of the enhancement of N2H+ at higher temperatures. If we look carefully at the expanded scale in Figure 8 for 25 K, we notice that the abundance of N2H+ starts to increase before the decrease of CO for the surface network. To fully explain the initial increase in N2H+, it is necessary to consider its principal formation reaction:
| (7) |
Figure 8 shows that the N2 abundance profiles are quite similar for the surface and accretion/desorption networks whereas the abundance of H becomes higher after 103 yr if we use the complete surface network. This difference can be explained in the follow manner. At very early times (103 yr t 104 yr) H reacts primarily with O via
| (8) |
and only later primarily with CO:
| (9) |
Just as with CO, O atoms on the surface react rather than desorb in the surface network. Thus, accretion turns out to be a destruction process for gaseous O as well as gaseous CO. A reduction in gas-phase atomic oxygen leads to an increase in the abundance of H at early times and thus to an early increase in the N2H+ abundance through reaction (7) for the surface network. Later, at 104.5 yr, the N2H+ abundance is further increased due to the rapid drop in the gas-phase CO abundance.
With the surface network at 15 K, the N2H+ abundance, and to a lesser degree the NH3 abundance, differs somewhat from what we see at 25 K in Figure 8. At the lower temperature, surface CO reacts more slowly, so that desorption, although slower than at 25 K, is sufficiently competitive to maintain a significant abundance of gaseous CO. On the other hand, a large amount of N2 stays on the grain surface for long periods of time at 15 K, while at 25 K there is enough thermal energy to desorb it into the gas-phase. Taking into account reaction (7), this leads to a somewhat lower N2H+ abundance at 15 K than at 25 K throughout much of the time of the calculations. Although the distinction is minimal at the time of maximum , as shown in Table 1, it can range up to an order of magnitude, as shown in Figure 8.
Now let us compare the abundance of N2H+ among different types of sources. An interplay among the formation of N2H+ via process (7), its destruction through reaction (6), and destruction of CO through grain-surface processes (4) and (5) in the surface network allows us to qualitatively explain the systematic differences in the N2H+ abundance among low-mass starless cores, high-mass protostellar objects and IRDCs noticed in Vasyunina et al. (2011). In this investigation, higher N2H+ abundances were determined for IRDCs in comparison with both low-mass starless cores and high-mass protostellar objects (HMPOs). In our explanation, we take into account that typical temperatures in these three classes of objects are different. Low-mass starless cores have typical temperatures of 10 K (e.g. Tafalla et al., 2004), some IRDCs reach temperatures of about 15 K – 25 K (Vasyunina et al., 2011), and HMPO temperatures are higher than 30 K (Beuther et al., 2007). At 10 K, N2, the major precursor of N2H+, is partially frozen onto the dust particles, but some sufficient fraction of it still resides in the gas phase, making possible the formation of a moderate amount of gaseous N2H+ in low-mass starless cores, as seen in observations. HMPOs, on the other hand, are warm enough to maintain a high gas-phase abundance of N2, but here the CO gaseous abundance also stays high because of the rapid desorption (see Figure 7), so that CO can react with N2H+ via reaction (6) to suppress the ionic abundance. Finally, warm IRDC321.73-1 represents the most comfortable environment for N2H+ because it is warm enough (T 25 K) to keep all N2 in the gas phase, while the majority of CO is removed from the gas via accretion followed by reactions (4) and (5). These processes lead to an N2H+ abundance that is on average higher in IRDCs than in low-mass starless cores and HMPOs. Also, it explains the higher observed abundance of N2H+ in warm IRDC321.71-1 than in cold IRDC013.90-1, the chemistry of which is much more similar to the chemistry of low-mass starless cores.
The fact that the abundances of gas-phase species such as CO, HCO+ and N2H+ in the surface model of warm IRDC321.73-1 are controlled by the grain-surface chemistry of CO leads us to the interesting conclusion that grain-surface chemistry can be investigated not only via direct observations of ices or complex organic molecules, but also by means of careful observations of the chemistry of simple molecular ions. This is possible when the temperature of dust in a source stays in the range between 20 K and 30 K, which ensures the simultaneous participation of reactive gas-phase molecules such as CO both in the gas-phase and on grains. Such a warm medium is not typical for low-mass pre-stellar objects, but seems to be present in some objects that represent the earliest stages of high-mass star formation. Therefore, warm infrared dark clouds may serve as an unusual and very useful laboratory that makes possible the investigation of grain-surface chemistry through the observations of simple gas phase species.
6 Summary and Conclusions
Infrared dark clouds represent a new area for chemical study in which the temperatures and densities are somewhat higher than in low-mass cold prestellar cores. The recent study of a number of gas-phase molecules via single-dish observations allows us to compare observed molecular abundances with the results of chemical simulations and to determine in some detail how the chemistry in IRDCs compares with the chemistry in low-mass sources. To study the chemistry, we chose the infrared dark clouds IRDC013.90-1 and IRDC321.73-1, which are relatively well studied observationally and represent different temperature conditions for IRDCs: K for the former and K for the latter. Given the large beam of the single-dish observations, we chose a simple 0-D model with time-independent physical conditions. The 0-D model was used f with three different networks: the surface network, which contains the complete OSU gas-grain network, the gas-phase network, in which only gas-phase processes occur except for the surface formation of H2 and ion-grain reactions, and the accretion/desorption network, in which accretion and desorption are added to the gas-phase network.
We used two time-dependent criteria to determine the goodness-of-fit of the model results to the data – the simple criterion of counting the number of species for which theory and observation agree to within an order of magnitude, and the more subtle confidence parameter approach. With these criteria, we found for IRDC321.73 - 1 that the best fit occurs at times below 105 yr with the surface network at 20-25 K and cm-3, in good agreement with the ammonia kinetic temperature. This best fit, however, is not sharply peaked in temperature, and fits for temperatures lower than or higher than the 20-25 K range do almost as well. For IRDC013.90-1, it is even more difficult to determine the optimum temperature from best fits with our two criteria. All we can say is that the physical conditions based on observations – = 15 K and cm-3 – are among the more reasonable choices with the surface network. Analyzing predicted molecular profiles for species not included in our study, we conclude that additional observations of sulfur-bearing species can help to sharpen the temperature range of the best fits.
We looked at model results for the three networks in detail over a temperature range from 10 K to 40 K at densities of cm-3 and cm-3. For these ranges, we can see that only in the case of the gas-phase network do temperature and density have no large influence on molecular abundances. As soon as we take gas-grain interactions into account, the temperature dependence can become quite large, especially at later times. Our study revealed a limited temperature range of 20 - 30 K, where grain-surface chemistry becomes important for gas-phase abundances of certain species such as CO, HCO+, N2H+. Hence, those IRDCs that have temperatures in the 20 - 30 K range can be a good laboratory to study the impact of surface reactions on the abundances of simple gas-phase species. Moreover, the interplay of gas-phase and surface chemistry can distinguish low-mass prestellar cores, IRDCs and higher-mass protostellar objects because their different temperatures lead to different abundances of the ion N2H+. The chemistry can also explain the differing abundances of this ion when comparing colder and warmer IRDCs. The highest N2H+ fractional abundance occurs in warm IRDCs (up to 10-8), a feature that is reproduced quantitatively by our simple surface model.
The success of the 0-D model in reproducing single-dish observations of 8 species confirms that it is sufficient to use simple physical models for explaining this type of data. To build 1-D models with some temperature and density structure requires extending the number of species including tracers of more dense gas (N2D+ and DCO+) and less dense gas (CO). To build and justify more complicated models, including contraction and heating, we need high-resolution interferometric data (e.g., Brogan et al., 2011). Interferometers such as ALMA will allow us to achieve the same spatial resolution for distant IRDCs as we have now with large single-dish telescopes for closer low-mass clouds.
| IRDC013.90-1 | IRDC321.73-1 | |||
| Species | Observation | Model | Observation | Model |
| 8104 yr | 3104 yr | |||
| N2H+ | 6.4(-10) | 1.3(-09) | 3.9(-09) | 1.4(-09) |
| HCCCN | 1.5(-10) | 9.0(-11) | 5.1(-10) | 7.1(-10) |
| HNC | 4.0(-10) | 1.3(-09) | 1.8(-09) | 2.1(-09) |
| HCO+ | 3.8(-09) | 1.6(-09) | 1.3(-08) | 3.1(-09) |
| HCN | 4.2(-10) | 1.4(-09) | 3.1(-09) | 2.0(-09) |
| C2H | 2.5(-09) | 3.5(-09) | 1.4(-08) | 3.3(-09) |
| NH3 | 4.8(-08) | 1.4(-08) | 8.0(-08) | 2.3(-08) |
| CS | – | – | 3.9(-09) | 7.4(-10) |
| Species | Abundance |
|---|---|
| H2 | 0.50 |
| He | 1.40(-1) |
| N | 2.14(-5) |
| O | 1.76(-5) |
| C+ | 7.30(-5) |
| S+ | 8.00(-8) |
| Si+ | 8.00(-9) |
| Fe+ | 3.00(-9) |
| Na+ | 2.00(-9) |
| Mg+ | 7.00(-9) |
| Cl+ | 1.00(-9) |
| P+ | 2.00(-10) |
| F+ | 6.68(-9) |
| Parameter | Value |
| cosmic ray ionization rate | 1.3(-17) s-1 |
| Grain size | 0.1 m |
| Grain density | 3.0 g/cm3 |
| Diffusion/desorption energy ratio | 0.5 |
| Gas-to-dust mass ratio | 100 |
| Extinction | 10 |
| Surface site density | 1.5(15) cm-2 |
| Thermal desorption | on |
| Cosmic ray desorption | on |
| Photodesorption | off |
| Tunneling through diffusion barriers | off |
| Tunneling through reaction barriers | on |
| Thermal hopping | on |
| n / T | 10 K | 15 K | 20 K | 25 K | 30 K |
|---|---|---|---|---|---|
| C(t) for IRDC013.90-1 | |||||
| 105 cm-3 | 6, 7, 7 | 6, 7, 7 | 6, 7p, 7 | 6, 6, 7 | 6, 6, 7 |
| 106 cm-3 | 4, 2, 6 | 5, 3, 6 | 5, 5, 7 | 5, 4, 7 | 5, 4, 6p |
| K(t) for IRDC013.90-1 | |||||
| 105 cm-3 | 0.3, 0.4, 0.5 | 0.3, 0.4, 0.6 | 0.3, 0.4, 0.4 | 0.3, 0.3, 0.6 | 0.3, 0.3, 0.4 |
| 106 cm-3 | 0.03, 0.1, 0.1 | 0.03, 0.08, 0.1 | 0.03, 0.1, 0.5 | 0.03, 0.05, 0.4 | 0.03, 0.1, 0.2 |
| C(t) for IRDC321.73-1 | |||||
| 105 cm-3 | 7, 4, 6 | 7, 6p, 7 | 7, 7, 8 | 7, 6p, 8 | 7, 7p, 7 |
| 106 cm-3 | 5, 4, 6p | 4, 3, 5p | 4, 3, 7p | 4, 4, 5 | 5, 6p, 6p |
| K(t) for IRDC321.73-1 | |||||
| 105 cm-3 | 0.07, 0.1, 0.3 | 0.07, 0.1, 0.4 | 0.06, 0.2, 0.5 | 0.06, 0.06, 0.5 | 0.06, 0.1, 0.2 |
| 106 cm-3 | 0.003, 0.02, 0.05 | 0.004, 0.01, 0.06 | 0.004, 0.04, 0.2 | 0.004, 0.01, 0.2 | 0.004, 0.1, 0.05 |
References
- Aikawa et al. (2008) Aikawa, Y., Wakelam, V., Garrod, R. T., & Herbst, E. 2008, ApJ, 674, 984
- Alonso-Albi et al. (2010) Alonso-Albi, T., Fuente, A., Crimier, N., Caselli, P., Ceccarelli, C., Johnstone, D., Planesas, P., Rizzo, J. R., Wyrowski, F., Tafalla, M., Lefloch, B., Maret, S., & Dominik, C. 2010, A&A, 518, A52
- Battersby et al. (2010) Battersby, C., Bally, J., Jackson, J. M., Ginsburg, A., Shirley, Y. L., Schlingman, W., & Glenn, J. 2010, ApJ, 721, 222
- Bergin & Langer (1997) Bergin, E. A. & Langer, W. D. 1997, ApJ, 486, 316
- Bergin & Tafalla (2007) Bergin, E. A. & Tafalla, M. 2007, ARA&A, 45, 339
- Beuther et al. (2007) Beuther, H., Churchwell, E. B., McKee, C. F., & Tan, J. C. 2007, Protostars and Planets V, 165
- Brogan et al. (2011) Brogan, C. L., Hunter, T. R., Cyganowski, C. J., Friesen, R. K., Chandler, C. J., & Indebetouw, R. 2011, ApJ, 739, L16
- Brown et al. (1988) Brown, P. D., Charnley, S. B., & Millar, T. J. 1988, MNRAS, 231, 409
- Busquet et al. (2011) Busquet, G., Estalella, R., Zhang, Q., Viti, S., Palau, A., Ho, P. T. P., & Sánchez-Monge, Á. 2011, A&A, 525, A141
- Carey et al. (1998) Carey, S. J., Clark, F. O., Egan, M. P., Price, S. D., Shipman, R. F., & Kuchar, T. A. 1998, ApJ, 508, 721
- Carey et al. (2000) Carey, S. J., Feldman, P. A., Redman, R. O., Egan, M. P., MacLeod, J. M., & Price, S. D. 2000, ApJ, 543, L157
- Caselli et al. (2002) Caselli, P., Benson, P. J., Myers, P. C., & Tafalla, M. 2002, ApJ, 572, 238
- Caselli et al. (1993) Caselli, P., Hasegawa, T. I., & Herbst, E. 1993, ApJ, 408, 548
- Cyganowski et al. (2009) Cyganowski, C. J., Brogan, C. L., Hunter, T. R., & Churchwell, E. 2009, ApJ, 702, 1615
- Devine et al. (2011) Devine, K. E., Chandler, C. J., Brogan, C., Churchwell, E., Indebetouw, R., Shirley, Y., & Borg, K. J. 2011, ApJ, 733, 44
- Egan et al. (1998) Egan, M. P., Shipman, R. F., Price, S. D., Carey, S. J., Clark, F. O., & Cohen, M. 1998, ApJ, 494, L199+
- Foster et al. (2011) Foster, J. B., Jackson, J. M., Barris, E., Brooks, K., Cunningham, M., Finn, S. C., Fuller, G. A., Longmore, S. N., Mascoop, J. L., Peretto, N., Rathborne, J., Sanhueza, P., Schuller, F., & Wyrowski, F. 2011, ArXiv e-prints
- Garrod et al. (2007) Garrod, R. T., Wakelam, V., & Herbst, E. 2007, A&A, 467, 1103
- Garrod et al. (2008) Garrod, R. T., Weaver, S. L. W., & Herbst, E. 2008, ApJ, 682, 283
- Gibson et al. (2009) Gibson, D., Plume, R., Bergin, E., Ragan, S., & Evans, N. 2009, ApJ, 705, 123
- Graedel et al. (1982) Graedel, T. E., Langer, W. D., & Frerking, M. A. 1982, ApJS, 48, 321
- Hasegawa et al. (1992) Hasegawa, T. I., Herbst, E., & Leung, C. M. 1992, ApJS, 82, 167
- Herbst & van Dishoeck (2009) Herbst, E. & van Dishoeck, E. F. 2009, ARA&A, 47, 427
- Jackson et al. (2008) Jackson, J. M., Finn, S. C., Rathborne, J. M., Chambers, E. T., & Simon, R. 2008, ApJ, 680, 349
- Katz et al. (1999) Katz, N., Furman, I., Biham, O., Pirronello, V., & Vidali, G. 1999, ApJ, 522, 305
- Keto & Caselli (2008) Keto, E. & Caselli, P. 2008, ApJ, 683, 238
- Keto & Caselli (2010) —. 2010, MNRAS, 402, 1625
- Morton (1974) Morton, D. C. 1974, ApJ, 193, L35
- Nomura & Millar (2004) Nomura, H. & Millar, T. J. 2004, A&A, 414, 409
- Perault et al. (1996) Perault, M., Omont, A., Simon, G., Seguin, P., Ojha, D., Blommaert, J., Felli, M., Gilmore, G., Guglielmo, F., Habing, H., Price, S., Robin, A., de Batz, B., Cesarsky, C., Elbaz, D., Epchtein, N., Fouque, P., Guest, S., Levine, D., Pollock, A., Prusti, T., Siebenmorgen, R., Testi, L., & Tiphene, D. 1996, A&A, 315, L165
- Pillai et al. (2006) Pillai, T., Wyrowski, F., Carey, S. J., & Menten, K. M. 2006, A&A, 450, 569
- Ragan et al. (2006) Ragan, S. E., Bergin, E. A., Plume, R., Gibson, D. L., Wilner, D. J., O’Brien, S., & Hails, E. 2006, ApJS, 166, 567
- Ragan et al. (2011) Ragan, S. E., Bergin, E. A., & Wilner, D. 2011, ApJ, 736, 163
- Rathborne et al. (2006) Rathborne, J. M., Jackson, J. M., & Simon, R. 2006, ApJ, 641, 389
- Rodgers & Charnley (2001) Rodgers, S. D. & Charnley, S. B. 2001, ApJ, 546, 324
- Ruffle & Herbst (2001) Ruffle, D. P. & Herbst, E. 2001, MNRAS, 322, 770
- Sakai et al. (2012) Sakai, T., Sakai, N., Furuya, K., Aikawa, Y., Hirota, T., & Yamamoto, S. 2012, ArXiv e-prints
- Sakai et al. (2010) Sakai, T., Sakai, N., Hirota, T., & Yamamoto, S. 2010, ApJ, 714, 1658
- Sakai et al. (2008) Sakai, T., Sakai, N., Kamegai, K., Hirota, T., Yamaguchi, N., Shiba, S., & Yamamoto, S. 2008, ApJ, 678, 1049
- Semenov et al. (2010) Semenov, D., Hersant, F., Wakelam, V., Dutrey, A., Chapillon, E., Guilloteau, S., Henning, T., Launhardt, R., Piétu, V., & Schreyer, K. 2010, A&A, 522, A42+
- Snyder et al. (1977) Snyder, L. E., Hollis, J. M., & Watson, W. D. 1977, ApJ, 212, 79
- Tafalla et al. (2004) Tafalla, M., Myers, P. C., Caselli, P., & Walmsley, C. M. 2004, A&A, 416, 191
- Vasyunin et al. (2008) Vasyunin, A. I., Semenov, D., Henning, T., Wakelam, V., Herbst, E., & Sobolev, A. M. 2008, ApJ, 672, 629
- Vasyunin et al. (2009) Vasyunin, A. I., Semenov, D. A., Wiebe, D. S., & Henning, T. 2009, ApJ, 691, 1459
- Vasyunin et al. (2004) Vasyunin, A. I., Sobolev, A. M., Wiebe, D. S., & Semenov, D. A. 2004, Astronomy Letters, 30, 566
- Vasyunina et al. (2009) Vasyunina, T., Linz, H., Henning, T., Stecklum, B., Klose, S., & Nyman, L.-Å. 2009, A&A, 499, 149 (Paper I)
- Vasyunina et al. (2011) Vasyunina, T., Linz, H., Henning, T., Zinchenko, I., Beuther, H., & Voronkov, M. 2011, A&A, 527, A88+
- Viti et al. (2004) Viti, S., Collings, M. P., Dever, J. W., McCoustra, M. R. S., & Williams, D. A. 2004, MNRAS, 354, 1141
- Wakelam et al. (2004) Wakelam, V., Caselli, P., Ceccarelli, C., Herbst, E., & Castets, A. 2004, A&A, 422, 159
- Wakelam & Herbst (2008) Wakelam, V. & Herbst, E. 2008, ApJ, 680, 371
- Wakelam et al. (2010) Wakelam, V., Herbst, E., Le Bourlot, J., Hersant, F., Selsis, F., & Guilloteau, S. 2010, A&A, 517, A21+
- Wakelam et al. (2006) Wakelam, V., Herbst, E., & Selsis, F. 2006, A&A, 451, 551
- Wakelam et al. (2005) Wakelam, V., Selsis, F., Herbst, E., & Caselli, P. 2005, A&A, 444, 883
Facilities: Nickel, HST (STIS), CXO (ASIS).