The AGN content in luminous IR galaxies at 2 from a global SED analysis including Herschel data
Abstract
We use Herschel-PACS far-infrared data, combined with previous multi-band
information and mid-IR spectra, to properly account for the presence of an
active nucleus and constrain its energetic contribution in luminous
infrared (IR) sources at . The sample is composed of
24 sources in the GOODS-South field, with typical IR luminosity of
. Data from the 4 Ms Chandra X-ray imaging in this field
are also used to identify and characterize AGN emission.
We reproduce the observed spectral energy distribution (SED), decomposed into
a host-galaxy and an AGN component. A smooth-torus model for
circum-nuclear dust is used to account for the direct and re-processed
contribution from the AGN.
We confirm that galaxies with typical at
are powered predominantly by star-formation. An AGN
component is present in nine objects ( of the sample) at
the 3 confidence level, but its contribution to the
8-1000 m emission accounts for only of the energy budget.
The AGN contribution rises to 23% over the 5–30 m range
(in agreement with Spitzer IRS results) and to 60% over the narrow
2–6 m range.
The presence of an AGN is confirmed by X-ray data for 3 (out of nine)
sources, with X-ray spectral analysis indicating the presence of
significant absorption, i.e. N cm-2.
An additional source shows indications of obscured AGN emission from
X-ray data.
The comparison between the mid-IR–derived X-ray luminosities and those
obtained from X-ray data suggests that obscuration is likely present also
in the remaining six sources that harbour an AGN according to the
SED-fitting analysis.
keywords:
galaxies: active — galaxies: nuclei — infrared: galaxies1 Introduction
Ultra-luminous infrared galaxies (ULIRGs, defined as having ; Soifer et al. 1987) are among the most luminous objects of the Universe, radiating most of their energy in the infrared (IR) band. In the local Universe, ULIRGs are rare objects and, although very luminous, account for only of the total integrated IR luminosity density (Soifer & Neugebauer, 1991). Moving to higher redshift, the contribution of ULIRGs to the energy budget increases, as clearly illustrated by infrared luminosity function studies (Le Floc’h et al. 2005; Caputi et al. 2007). Magnelli et al. (2011), deriving the infrared luminosity function up to from deep 24 and 70 m Spitzer data, obtained a contribution of from ULIRGs to the IR luminosity density at . This result has been recently confirmed also by the Herschel Science Demonstration Phase (SDP) preliminary results; Gruppioni et al. (2010), by deriving the total IR luminosity function up to , estimated that ULIRGs account for to the IR luminosity density at .
At high redshift (), a key question regards the nature of the sources that power these ultra-luminous objects (i.e., star-formation vs. accretion). Locally, thanks to Infrared Space observatory (ISO) mid-IR spectroscopy, ULIRGs were proven to be powered predominantly by star formation in the mid-IR, with the fraction of AGN-powered objects increasing with luminosity (from 15% at to about 50% at higher luminosity; Lutz et al. 1998). A limited percentage (15–20%) of mid-IR light dominated by accretion processes has also been found using -band (3-4 m) observations of local ULIRGs with by Risaliti et al. (2010). Interestingly, these authors show that, although their sources are powered mostly by starburst processes, at least 60% of them contain an active nucleus. Using accurate optical spectral line diagnostics applied to a sample of 70 m selected luminous sources at 1, Symeonidis et al. (2010) found that only 20–30% of their objects may host an active nucleus. However, such AGN are never bolometrically dominant. In the same paper, a discussion on how the low AGN incidence can be partially due to selection effects (i.e. the 70 m band sampling the starburst 50 m rest-frame far-IR bump) is also presented.
At , our understanding of the AGN content in ULIRGs is much more uncertain. On the one hand, sources selected with a 24 m flux density 0.9–1 mJy mainly sample the bright end of the ULIRG population. The analysis of the IRS spectra of a color-selected sample of sources with S mJy and at () shows that the majority of these sources are AGN-dominated (; Sajina et al. 2008). On the other hand, sub-millimeter selected galaxies (SMGs) at , falling in the ULIRG regime, appear largely starburst-dominated objects (e.g., Valiante et al. 2007; Pope et al. 2008).
In this paper, we aim at providing a better understanding of luminous sources at 2 with typical IR luminosities of , i.e. sampling the knee of the IR luminosity function instead of the bright end. We will re-analyse the sample from Fadda et al. (2010, hereafter F10), where an estimate of the AGN contribution in ULIRGs has already been presented, based on Spitzer IRS data, Chandra 2 Ms observations, optical/near-IR multi-band properties, and ACS morphological properties. In this work, we will extend the analysis to far-IR data, obtained recently by the Herschel satellite as part of the guaranteed survey “PACS Evolutionary Probe” (PEP; Lutz et al. 2011), and to the recently published Chandra 4 Ms data (Xue et al. 2011).
We note that an analysis of the F10 sample (including the new far-IR data) has been already presented by Nordon et al. (2012) [hereafter N12], where the general properties of the mid-to-far IR spectral energy distributions (SEDs) of 0.72.5 galaxies have been investigated. The authors confirm the early Herschel results (e.g., Elbaz et al. 2010), i.e. the star-formation rates at are over-estimated if derived from 24 m flux densities, and discuss how this effect can be due to enhanced PAH emission with respect to local templates (see also Elbaz et al. 2010; Elbaz et al. 2011). In N12, the SED library from Chary & Elbaz (2001) was used, longward of 6 m rest-frame, and the IRS spectra data were stacked to improve the faint signal of sources at . In this paper we adopt a different method to study the properties of IR galaxies, as described in 3; a comparison of our results vs. those obtained by N12 is presented in 4.1.
Hereafter, we adopt the concordance cosmology ( km sec-1 Mpc-1, =0.3, and =0.7, Spergel et al. 2003). Magnitudes are expressed in the Vega system.
2 The data
The sample is composed of 24 luminous sources at 2, selected by F10 in the Chandra Deep Field South (CDF-S), with 24 m flux densities mJy and at . The sample can be considered luminosity-selected, since all of the sources satisfying these selection criteria are considered. Given the redshift of the sources, their 24 m flux densities translate roughly into infrared luminosity around . We excluded two objects, originally defined as luminous IR galaxies (LIRGs; ) by F10 (L5511 and L6211) and subsequently included in the ULIRG class thanks to the new IRS redshift measurements, since they would be the only two sources outside the HST ACS area (L5511 is also outside the Herschel area).
The sample benefits from a large amount of information available for the CDF-S, from multi-band photometry to the recent Spitzer IRS spectroscopy. The IRS observations were performed at low-resolution in the observed 14-35 m wavelength regime, i.e. sampling at the important rest-frame PAH features at 6.2 m and 7.7 m, and the 9.7 m silicate feature (see F10). As reported above, in this work we also use recent far-IR data obtained from the Herschel satellite, which consists of PACS data at 70, 100 and 160 m from the PEP survey (Lutz et al., 2011). We use the PACS blind catalogue v1.3 down to 3 limits of 1.2, 1.2 and 2.0 mJy at 70, 110 and 160 m, respectively. Herschel data have been matched to 24 m Spitzer MIPS sources (Magnelli et al., 2009) using the likelihood ratio technique (Sutherland & Saunders 1992; Ciliegi et al. 2001), as described in Berta et al. (2011). Shorter wavelength information has been included by matching the 24 m sources to the multi-band (from UV to Spitzer IRAC bands) GOODS-MUSIC photometric catalog (Santini et al., 2009). In particular, we cross-correlated the 24 m selected ULIRGs with the PEP catalogue, considering the positions of the 24 m sources already associated to the PEP ones. Among the 24 ULIRGs, 21 sources have counterparts in PACS. For the 3 sources undetected by Herschel (U5050, U5152, and U5153), we consider the conservative 5 upper limits (2.2, 2.0 and 3.0 mJy at 70, 100 and 160 m, respectively). For PACS detections, the typical separation between 24 m and PEP sources is less than 1″, with the exception of U5805 and U16526 (4″). By visually checking the far-IR images, these sources appear as blends of more than one 24 m source. In these cases, the PACS flux densities are considered as upper limits. Photometry at 16 m, obtained by F10 from IRS data, has also been included.
Finally, we consider the recently published Chandra 4 Ms point-like source catalogue in the CDF-S (Xue et al. 2011). Eight of the 24 sources have an X-ray counterpart within 1″.
Table 1 lists the source names, redshifts from optical and IRS spectroscopy (see F10), source IDs in the GOODS-MUSIC catalogue, flux densities and associated errors from mid-IR (16 m) to far-IR (160 m).
| Name | IDMUSIC | S16μm | S24μm | S70μm | S100μm | S160μm | ||
|---|---|---|---|---|---|---|---|---|
| (1) | (2) | (3) | (4) | (5) | (6) | (7) | (8) | (9) |
| U428 | 1.664 | 1.783 | 8053 | 65 3 | 289 5 | 1270 380 | 2870 450 | |
| U4367 | 1.762 | 1.624 | 3723 | 101 8 | 152 4 | 2270 530 | ||
| U4451 | 1.684 | 1.875 | 3689 | 199 4 | 2000 380 | 5110 550 | ||
| U4499 | 1.909 | 1.956 | 70361 | 167 3 | 6990 580 | |||
| U4631 | 1.896 | 1.841 | 7087 | 275 5 | 4010 560 | |||
| U4639 | 2.130 | 2.112 | 7553 | 213 4 | 3570 550 | |||
| U4642 | 1.748 | 1.898 | 8217 | 65 9 | 242 5 | 1150 360 | ||
| U4812 | 1.910 | 1.930 | 13175 | 295 6 | 2590 410 | 10000 380 | 24830 730 | |
| U4950 | 2.291 | 2.312 | 15260 | 453 8 | 557 6 | 2060 420 | ||
| U4958 | 2.145 | 2.118 | 15483 | 109 10 | 232 4 | 1360 410 | 2690 380 | 3720 550 |
| U5050 | 1.720 | 1.938 | 13758 | 51 7 | 197 4 | |||
| U5059 | 1.543 | 1.769 | 13887 | 272 5 | 1450 380 | 1750 360 | 4400 610 | |
| U5150 | 1.738 | 1.898 | 15083 | 65 11 | 277 4 | 4350 440 | 5690 700 | |
| U5152 | 1.888 | 1.794 | 70066 | 66 9 | 267 8 | |||
| U5153 | 2.030 | 2.442 | 70054 | 166 3 | ||||
| U5632 | 1.998 | 2.016 | 9261 | 2 | 427 5 | 2290 530 | 4250 360 | 11470 560 |
| U5652 | 1.616 | 1.618 | 6758 | 154 9 | 343 4 | 1600 380 | 6920 380 | 17220 740 |
| U5775 | 1.779 | 1.897 | 9361 | 164 4 | 1440 360 | 3930 670 | ||
| U5795 | 1.524 | 1.703 | 11201 | 250 4 | 5030 670 | |||
| U5801 | 1.642 | 1.841 | 12003 | 186 4 | 2310 550 | |||
| U5805 | 2.093 | 2.073 | 12229 | 68 6 | 172 4 | 1910a 360 | 5100a 670 | |
| U5829 | 1.597 | 1.742 | 9338 | 57 5 | 185 4 | 1920 380 | 4320 550 | |
| U5877 | 1.708 | 1.886 | 13250 | 179 8 | 364 5 | 4600 420 | 7460 440 | 11570 870 |
| U16526 | 1.718 | 1.749 | 3420 | 69 4 | 306 9 | 4130a 920 | 8600a 390 | 15970 a 760 |
Notes — (1) Source name (F10); (2) optical redshift (negative and positive values are referred to photometric and spectroscopic redshifts, respectively; see F10 for details); (3) redshift derived from IRS spectroscopy (F10); (4) ID from the v2 GOODS-MUSIC catalogue (Santini et al. 2009); (5) 16 m flux density from F10, in Jy; (6) 24 m flux density in Jy (Magnelli et al. 2009); (7), (8), (9) Herschel PEP flux density in Jy (Lutz et al. 2011). a indicates a possible contribution from a nearby source.
3 SED decomposition
The IR energy budget of a galaxy can be mainly ascribed to stellar photosphere and star-formation emissions and accretion processes; to estimate the relative importance of these three processes, a proper SED decomposition should be carried out. Disentangling the different contributions to the total SED is becoming more and more effective with the advent of the Spitzer and Herschel satellites. In this regard, many studies have been performed to compare the full range of observed photometric data with expectations from a host-galaxy component and models for the circum-nuclear dust emission (e.g., Polletta et al. 2008; Hatziminaoglou et al. 2008; Vignali et al. 2009; Pozzi et al. 2010). Here, together with the full-band photometric SED, we benefit also from the IRS spectra, that we combine with the photometric datapoints (Sec. 3.2; see also Mullaney et al. 2011, Alonso-Herrero et al. 2011 for examples of combined photometric/spectroscopic data analysis). The IRS spectra provide an important diagnostic, sampling the rest-frame mid-IR spectral range (m for our sample), where the difference between starburst and AGN is strongest. In this wavelength range, starburst galaxies are generally characterized by prominent polycyclic aromatic (PAH) features and weak 10 m continuum, whereas AGN display weak or no PAH features plus a strong continuum (e.g. Laurent et al. 2000).
3.1 AGN and stellar components
We have decomposed the observed SEDs using three distinct components: stars, having the bulk of the emission in the optical/near-IR; hot dust, mainly heated by UV/optical emission due to gas accreting onto the super-massive black hole (SMBH) and whose emission peaks between a few and a few tens of microns; cold dust, principally heated by star formation (we refer to Pozzi et al. 2010; but see also Hatziminaoglou et al. 2008 for a detailed description of the properties of the AGN and host-galaxy (starscold dust) components). Here we report only the most important issues concerning this analysis, with the AGN component being the main focus.
The stellar component has been modelled as the sum of simple stellar population (SSP) models of solar metallicity and ages ranging from ≈1 Myr to 2.3 Gyr, which corresponds to the time elapsed between (the redshift assumed for the initial star formation stars to form) and in the adopted cosmology. A Salpeter (1955) initial mass function (IMF), with mass in the range 0.15–120 M⊙, is assumed. The SSP spectra have been weighted by a Schmidt-like law of star formation (see Berta et al. 2004):
| (1) |
where is the age of the galaxy (i.e. of the oldest SSP) and is the duration of the burst in units of the oldest SSP. A common value of extinction is applied to stars of all ages, and a Calzetti et al. 2000) attenuation law has been adopted (=4.05).
To account for emission above 24 m, a component coming from colder, diffuse dust, likely heated by star-formation processes, has been included in the fitting procedure. It is represented by templates of well-studied starburst galaxies (i.e. Arp 220, M82, M83, NGC 1482, NGC 4102, NGC 5253 and NGC 7714) and five additional host-galaxy average templates obtained recently by Mullaney et al. (2011) from the starburst templates of Brandl et al. (2006). This set of five templates have been included since they properly reproduce the relative PAH strengths in the average IRS spectra of our ULIRG sample (see F10).
Regarding the AGN component, we have used the radiative transfer code of Fritz et al. (2006). This model follows the formalism developed by different authors (e.g., Pier & Krolik 1992; Granato & Danese 1994; Efstathiou & Rowan-Robinson 1995), where the IR emission in AGN originates in dusty gas around the SMBH with a “flared disk”, “smooth distribution”. Recently, this model has been widely used and found to successfully reproduce the photometric data, including the 9.7 m silicate feature in emission observed for type-I AGN (e.g., Siebenmorgen et al. 2005). Recent high-resolution, interferometric mid-IR observations of nearby AGN (e.g., Jaffe et al. 2004) have confirmed the presence of a geometrically thick, torus-like dust distribution on pc-scales; this torus is likely irregular or “clumpy”. Over the last decade, many codes have been developed to deal with clumpy dust distributions (e.g., Nenkova et al. 2002; Nenkova et al. 2008; Hönig & Kishimoto 2010).
According to Dullemond & van Bemmel (2005), the two models (smooth and clumpy) do not differ significantly in reproducing sparse photometric datapoints (see also Elitzur 2008). The main difference is in the strength of the silicate feature observed in absorption in objects seen edge-on, which is, on average, weaker for clumpy models with the same global torus parameters. The comparison between the two models has been applied only to few samples including IRS data and the results are not conclusive. Recently, Vignali et al. (2011) made a comparison of the smooth vs. clumpy models for the matter responsible for reprocessing the nuclear component of a hyper-luminous absorbed X-ray quasar at (IRAS 091044109), for which both photometric and spectroscopic (IRS) data were available. While smooth solutions (the F06 model) are able to reproduce the complete dataset, clumpy models (Nenkova et al. 2008) have problems in reproducing the source photometry and spectroscopy at the same time. In Mullaney et al. (2011), smooth vs. clumpy models are tested against a sample of 10 local Swift/BAT AGN with prominent emission at IRAS wavelengths. In this case, the authors claim that clumpy solutions reproduce the data better; smooth model parameters produce a much wider range of SED solutions, i.e. this model seems to produce too degenerate solutions. A further, more complete and extensive comparison of smooth vs. clumpy solutions is presented in Feltre et al. (submitted), where the theoretical SED shapes and the detailed spectral features of the two classes of models (i.e. F06 for the “smooth distribution” and Nenkova et al. 2008 for the “clumpy distribution”) are compared using a large compilation of AGN with IRS spectroscopic data. Overall, similar results to those obtained by Dullemond & van Bemmel (2005) are derived, i.e. SED fitting applied to both photometric and spectroscopic data is not a sufficiently reliable tool to discriminate between the smooth and the clumpy distributions. We remind the reader that in the present paper we are focusing on the torus “global” energy output (i.e., the relevance of accretion-related emission with respect to the total source SED), not on the details of the torus structure and geometry, so the choice of the adopted model does not critically influence the results; as shown by Feltre et al. (submitted), the two models provide consistent results in terms of energetics.
3.2 SED-fitting procedure
In most previous work using the F06 code, only photometric datapoints were used, and the quality of the fitting solutions was estimated using a standard minimization technique, where the observed values are the photometric flux densities (from optical-to-mid-IR/far-IR) and the model values are the “synthetic” flux densities obtained by convolving the sum of stars, AGN, and starburst components through the filter response curves (see Hatziminaoglou et al. 2008). In Vignali et al. (2011), the spectroscopic information was taken into account a posteriori in order to discriminate among different photometric best-fitting solutions.
Here we propose a first attempt to simultaneously fit the photometric and spectroscopic datapoints using smooth torus models by transforming the mid-IR 14–35 m observed-frame spectra into “narrow-band” photometric points of 1 m band-width in the observed frame (i.e., subdividing the spectral transmission curve in sub-units), and estimating the corresponding fluxes and uncertainties using ordinary procedure of filter convolution and error propagation. The “new” filters have been chosen to achieve, in each wavelength bin, a sufficient signal-to-noise ratio without losing too much in terms of spectral resolution, which is needed to reproduce the 9.7 m feature, when present. To take into account slit loss effects, IRS data have been normalized to the 24 m flux density, deriving normalization factors between 1.2 and 1.8. We would like to remark here that the F06 code does not necessarily impose the presence of an AGN component, i.e., solutions with only stellar emission are possible, as described in 4.1. Furthermore, the relative normalization of the optical/near-IR component and the far-IR emission of the host galaxy is free, given the extremely complex physical relation of the two (i.e. Baes et al. 2010). Overall, the SED-fitting procedure ends with 11 free parameters: six are related to the AGN, two to the stellar component, and one to the starburst. The further two free parameters are the normalizations of the stellar and of the starburst components; the torus normalization is estimated by difference, i.e., it represents the scaling factor of the torus model capable to account for the data-to-model residuals once the stellar components have already been included. Here we briefly recall the parameters involved in our SED fitting analysis, and refer to F06 and Feltre et al. (submitted) for a detailed description of the AGN model parameter. The six parameters related to the torus are: the ratio between the outer and the inner radius of the torus (the latter being defined by the sublimation temperature of the dust grains); the torus opening angle ; the optical depth at 9.7 m (); the line of sight with respect to the equatorial plane; two further parameters, and , describe the law for the spatial distribution of the dust. In the currently adopted version (see Feltre et al., submitted), the “smooth” torus database contains 2368 AGN models. In Pozzi et al. (2010) (see also Hatziminaoglou et al. (2008)), the degeneracies related to the six torus parameters are extensively described: in fact, various combinations of parameter values are equally able to provide good results in reproducing a set of observed data points. In particular, the optical depth has the largest effect on the fit. The infrared luminosity, provided by the SED-fitting code, is robustly determined (within 0.1 dex) and appears “solid” against parameter degeneracies.
Concerning the parameters associated with the other components, two are related to the stellar emission: , i.e. the parameter of the Schmidt-like law for the star formation, and the reddening . Regarding the starburst component, the free parameter is related to the choice of the best-fitting template among the starburst library.
The given number of free parameters means that the acceptable solutions, within 1(3) confidence levels, are derived, for each source, by considering the parameter regions encompassing +(12.65, 28.5), respectively, in presence of 11 degrees of freedom (d.o.f.; see Lampton et al. 1976).
4 AGN fraction
4.1 SED-fitting results
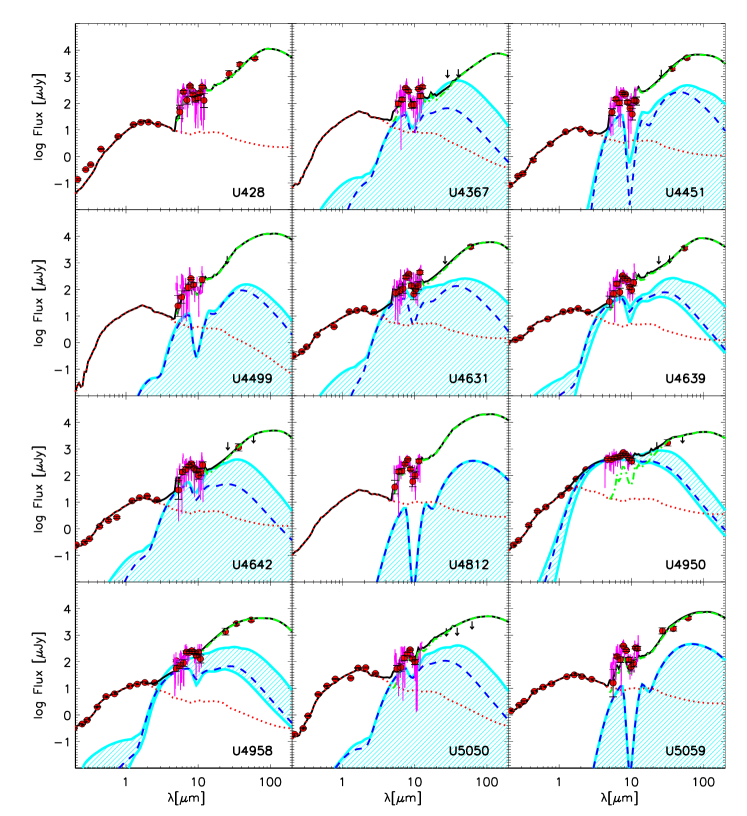
In Fig.1a,b the observed UV–160 m datapoints (filled red points) are reported along with the best-fitting solutions (black lines) and the range of AGN models within the 3 confidence level (filled region). All the sources need a host galaxy (red dotted-line) and a starburst component (green dot-dashed line). The host galaxy dominates the UV–8 m photometry (at , the IRAC 8 m band samples the 2.7 m rest-frame), while the starburst component dominates at longer wavelengths. For the three sources with no PACS detection (U5050, U5152, and U5153), the starburst component is required by the SED-fitting procedure to reproduce the mid-IR spectral data, although its shape is not well constrained.
Regarding the AGN component, our goal is to check whether its presence is required by the data and, in this case, to estimate its contribution to the IR luminosity. The SED-fitting procedure found that for all but one source (U428) the presence of an AGN is consistent with the photometry, although for only nine sources ( of the sample: U4639, U4950, U4958, U5150, U5152, U5153, U5652, U5805, and U5877) its presence is significant at the 3 confidence level (i.e., solutions with no torus emission have +28.5). However, in these sources as well, the AGN component far from dominates the whole spectral range, but emerges only in the narrow 2–10 m range, where the stellar emission from the host galaxy has a minimum while the warm dust heated by the AGN manifests itself (e.g., Laurent et al. 2000; Gruppioni et al. 2010).
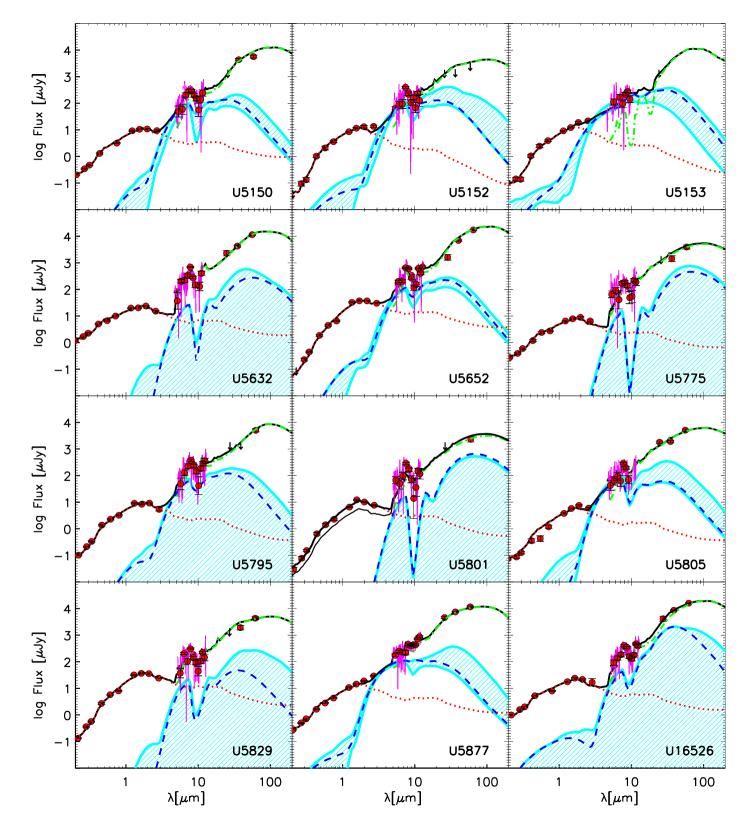
In Fig. 2 we report a zoom of the SED over the 2–20 m range in order to visualize the AGN emission for all of the nine sources where such component is required at the 3 confidence level. At a visual inspection, the presence of a nuclear component can be inferred for sources with a power-law SED (i.e., U4950 and U5877), for sources where the stellar component alone is not able to reproduce the datapoints around 3 m (i.e., U4958, U5153) or for sources where the starburst component, normalized to the far-IR datapoints, has already declined around 5–6 m (i.e. U5152, U5153, and U5805). Finally, there are few cases (i.e., U4639) where visual inspection of the SED decomposition is not strongly suggesting an AGN component, which is however required by the SED-fitting analysis.
The likely AGN in these sources is either obscured or of low-luminosity, although a combination of both effects is plausible as well. While our analysis is able to place constraints on the presence of an AGN, we cannot draw any firm conclusion on either the obscured or the low-luminosity hypothesis for the AGN emission from mid-IR data. Despite the uncertainties affecting the estimate of the gas column density derived from the dust optical depths (e.g., Maiolino et al. 2001), what we observe is that for all of the sources with an AGN component, a certain level of obscuration111The column density has been derived from the the optical depth at 9.7m, using the Galactic extinction law (Cardelli et al. 1989) and dust-to-gas ratio (Bohlin et al. 1978). ( cm-2) is required.
In particular, the three sources where the presence of an AGN is particularly evident in the mid-IR regime from our SED decomposition (U4950, U4958, and U5877) – as already pointed out by F10 on the basis of the presence of a powerlaw mid-IR SED (U4950 and U5877), optical emission lines (U4958, with an apparently broad C iii] feature) and optically unresolved nucleus (U4950 and U5877) – also show a relatively bright X-ray counterpart (see Sec. 4.2). The optical depth at 9.7 m of the best-fitting solutions corresponds to cm-2 (i.e., in the Compton-thin regime; cm-2 is obtained once the solutions at the 3 level are considered). Of the remaining six sources, one (U4639) has an association with a relatively weak X-ray source, while for the others only an upper limit to the X-ray emission can be placed (see Table 2). For these six sources, the SED-fitting procedure indicates an obscuration still in the Compton-thin regime, but higher (up to cm-2, with cm-2 when the solutions at the 3 level are taken into account) than for the previous three sources.
Further insights on the properties of these sources, hence on the nature of their broad-band emission, will be discussed using X-ray diagnostics (see Sec. 4.2).
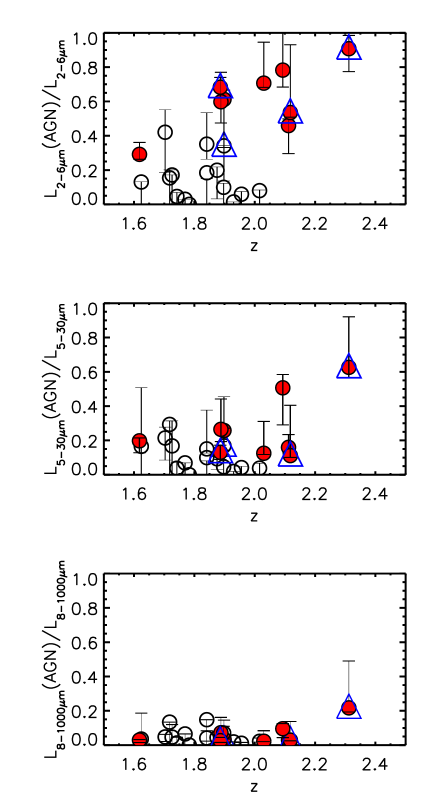
Turning now to source energetics, for the nine objects with an AGN component from the mid-IR, we computed the total and nuclear luminosity in three different spectral ranges: the whole (8–1000 m) IR range, the mid-IR (5–30 m) range (partially sampled by IRS), and the narrow 2–6 m wavelength interval. We find that the 8–1000 m luminosity is always completely dominated by star-formation emission, the AGN nuclear contribution being 5 (see Fig. 3, bottom panel), and that in only one source (U4950) out of the nine is the nuclear component contribution significant (). Our finding that starburst processes dominate the 8–1000 m emission is consistent with the F10 and N12 conclusions.
In the 5–30 m range, where the re-processed emission from the dust surrounding the nuclear source peaks (e.g., Silva et al. 2004), we find a larger AGN contribution (i.e. 25%; see Fig. 3, middle panel). As shown in Fig.1a,b, at m the nuclear component typically starts being overwhelmed by the starburst emission. We note that the mid-IR AGN/starburst relative contribution is also discussed by F10, adopting a completely different method than ours (i.e., scaling the SED of Mrk 231 to the 5.8 m continuum and fitting the residual SED with the average starburst from Brandl et al. 2006). Excluding from their analysis the three sources with the strongest AGN evidence from either X-ray or optical data (U4950, U4958, and U5877), F10 found a nuclear fraction of 20% (see their Fig. 22, top panel), which is consistent with our results.
The only wavelength range where we find that the AGN overcomes the galaxy emission and contributes to 60% of the emission is the narrow 2–6 m interval (see Fig. 3, top panel). The power of the near-IR spectral range to detect obscured AGN emission confirms previous results (e.g., Risaliti et al. 2006, 2010 using -band spectroscopy, but see also Lu et al. (2003), where a weak near-IR excess continuum emission, detected in disk galaxies thanks to ISOPHOT spectral observations, was ascribed to interstellar dust emission at temperatures of K).
The dominance of the AGN emission in the narrow 2–6 m interval is not in contrast with N12 conclusions, i.e. that these sources in the mid-IR are dominated by the PAH features, once the different spectral range is taken into account.
In Table 3, we report the total IR luminosities (8–1000 m), the AGN fractions over the three wavelengths discussed above (for the nine sources with an AGN emission detected at least at the 3 confidence level), and both observed and predicted 2–10 keV luminosities for our sample. The latter luminosities have been derived from the 5.8 m luminosity, using the Fiore et al. (2009) correlation (see Sec. 4.2 for further details), and only for the nine sources with an AGN component detected at least at 3 confidence (last column of Table 3). The integration of the SED over the 8–1000 m range confirms the ULIRG classification (), inferred by F10 on the basis of the 24 m flux densities and redshifts, for 14 out of the 24 sources, the remaining 10 sources showing slightly lower IR luminosities, between 0.5 and . The fact that 24 m–based measurements tend to over-estimate the for sources is consistent with other works based on Herschel-PEP data (e.g., Elbaz et al. 2010; N12) and stacking methods (e.g., Papovich et al. 2007). The final IR luminosity range of our sample is 0.5–2.8 (, with a dispersion ).
4.2 X-ray results
| Name | XID | F | log(L) | log(L,fit) | Class. X (Xu et al. 11) | Class. X (revised) | Class. SED | |
| (1) | (2) | (3) | (4) | (5) | (6) | (7) | (8) | (9) |
| Sources with an X-ray counterpart in the 4 Ms CDF-S catalog | ||||||||
| U428 | 579 | 0.07 | 41.9 | - | - | Gal | Gal | Gal. |
| U4639 | 555 | 0.07 | 42.0 | - | - | Gal | Gal | AGN |
| U4642 | 437 | 0.29 | 42.5 | 42.8 | 4.5 | AGN | AGN | Gal. |
| U4950 | 351 | 6.64 | 43.9 | 44.2 | 1.2 | AGN | AGN | AGN⋆ |
| U4958 | 320 | 0.31 | 42.3 | 43.7 | 1.9 | AGN | AGN | AGN⋆ |
| U5632 | 552 | 0.09 | 42.1 | - | - | AGN | Gal. | Gal. |
| U5775 | 360 | 0.05 | 41.8 | - | - | AGN | Gal. | Gal. |
| U5877 | 278 | 3.34 | 43.0 | 44.0 | 6.0 | AGN | AGN | AGN⋆ |
| Sources without X-ray detection in the 4 Ms catalog | ||||||||
| U4367 | - | - | - | - | - | - | Gal. | |
| U4451 | - | - | - | - | - | - | Gal. | |
| U4499 | - | - | - | - | - | - | Gal. | |
| U4631 | - | - | - | - | - | - | Gal. | |
| U4812 | - | - | - | - | - | - | Gal. | |
| U5050 | - | - | - | - | - | - | Gal. | |
| U5059 | - | - | - | - | - | - | Gal. | |
| U5150 | - | - | - | - | - | - | AGN | |
| U5152 | - | - | - | - | - | - | AGN | |
| U5153 | - | - | - | - | - | - | AGN | |
| U5652 | - | - | - | - | - | - | AGN | |
| U5795 | - | - | - | - | - | - | Gal. | |
| U5801 | - | - | - | - | - | - | Gal. | |
| U5805 | - | - | - | - | - | - | AGN | |
| U5829 | - | - | - | - | - | - | Gal. | |
| U16526 | - | - | - | - | - | - | Gal. | |
Notes — (1) Source name (F10); (2) XID from Xue et al. (2011); (3) observed-frame 0.5–8 keV flux in units of 10-15 erg cm-2 s-1 (Xue et al. 2011); errors on the X-ray fluxes (hence on the luminosities) vary from less than 10% for the few sources with most counts up to 40% for the X-ray faintest sources; (4) logarithm of the rest-frame 2–10 keV luminosity derived from either the 0.5–8 keV flux or the 0.5–8 keV sensitivity map (upper limits in the lower panel). The flux (or upper limit) is converted into a luminosity by assuming a powerlaw model with =1.4; (5) logarithm of the rest-frame, absorption-corrected 2–10 keV luminosity, in units of erg s-1; (6) column density. Both (5) and (6) have been derived directly from X-ray spectral fitting, which has been limited to the four sources with the highest counting statistics (see Sect. 4.2 for details). We note that X-ray luminosities – columns (4) and (5) – are different because of the different spectral modeling and assumptions (see Xue et al. 2011 and Sect. 4.2); (7), (8), (9) source classifications from X-ray data (Xue et al. 2011 and current work) and from SED-fitting, respectively. The term “AGN” in the source classification based on SED fitting (last column) indicates that the nuclear component is detected at the 3 confidence level. ⋆ indicates the presence of an AGN from optical data (U4958 – optical emission lines; U4950 and U5877 – optical morphology, see F10).
The 4 Ms X-ray source catalog in the CDF-S (Xue et al. 2011) provides additional information for the sub-sample of eight matched sources (see Table 2). The depth of the Chandra mosaic in the field, though variable across its area, provides constraints down to very faint flux limits ( in the 0.5–2 keV band). In the following, we use the X-ray information to provide an independent estimate of the AGN presence in our sample of IR-luminous galaxies and, for sources with most counts, characterize their X-ray emission. We also provide upper limits to the X-ray luminosity of the sources which are not detected in the 4 Ms CDF-S image.
A basic source classification is reported by Xue et al. (2011) (AGN/galaxy/star), where five different classification criteria are adopted to separate AGN from galaxies222 The criteria to classify a source as an AGN are: high X-ray luminosity (above erg s-1); flat effective photon index (); X-ray-to-optical flux ratio log(fX/fR); an X-ray luminosity at least three times higher than that possibly due to star formation (see Alexander et al. 2005); presence of either broad or high-ionisation emission lines in the optical spectra. See 4.4 of Xue et al. 2011 for details.; at least one of these criteria should be satisfied. According to such classification, only two sources of the present sample are classified as galaxies, U428 and U4639, the remaining six being AGN. However, in the following we will provide indications for a “revision” of this classification using all of the available X-ray information (e.g., spectral properties, luminosities, count distribution).
In Table 2 the source classifications from X-ray data (Xue et al. 2011 and current work, respectively), along with the results from the SED-fitting analysis (see Sec. 4.1), are presented.
X-ray luminosities, coupled with X-ray spectral analysis (see below), indicate the presence of an AGN in the three sources (U4950, U4958, and U5877) for which the SED fitting analysis and F10 already suggested an AGN. Also U4642 has an X-ray luminosity typical of AGN emission.
In comparison with the 2 Ms Chandra data (Luo et al. 2008) used by F10, U4958 represents a new AGN detection, although the presence of an active nucleus was already inferred by the mid-IR featureless spectra and the optical spectrum, showing a broad C iii] line and strong N v and C iv emission lines.
All of the X-ray matched sources have a full-band (0.5–8 keV) detection. One source (U4958) has an upper limit in the soft band (0.5–2 keV); this result is suggestive of heavy absorption, since Chandra has its highest effective area, and hence best sensitivity, in this energy range. Basic X-ray spectral analysis (using an absorbed powerlaw with photon index fixed to 1.8, as typically observed in AGN; Piconcelli et al. 2005), actually confirms the presence of strong, possibly Compton-thick obscuration333A source is called Compton-thick if its column density cm-2, where is the Thomson cross section. towards this source (N cm-2). Four sources have hard-band (2–8 keV) upper limits: U428, U4639, U5632, and U5775, all of which being characterized by limited counting statistics (12–26 counts in the full band). Their X-ray luminosity (see Table 2)444For the four sources with 2–8 keV upper limits, the 2–10 keV luminosities are reported in Table 2 as these sources were detected in the hard band. We note, in fact, that the values reported in the table are derived from the 0.5–8 keV fluxes, where all of these sources are detected. is consistent with star-formation activity, although the presence of a low-luminosity AGN cannot be excluded.
U4950 and U5877 are characterized by 1420 and 360 counts in the 0.5–8 keV band, which allow a moderate-quality X-ray spectral analysis. Both sources can be fitted using a powerlaw model, but the flat photon index ( and 1, respectively) is indicative of absorption, which has been estimated to be 1.2 cm-2 and 6.0 cm-2, respectively, after fixing the photon index to 1.8. The same model applied to U4642 data provides good results, although the derived column density is poorly constrained ( cm-2). Apart from U4950, U4958, U5877 and U4642, for the remaining X-ray matched sources, the limited counting statistics prevent us from placing constraints on any possible obscuration.
For the sources which were not detected in the 4 Ms CDF-S observations, we derived rest-frame 2–10 keV luminosity upper limits by converting the full-band sensitivity map (weighted over a region surrounding the source of interest of 4″ radius to minimize possible spurious fluctuations in the map) using a powerlaw with =1.4 (see Table 2). The assumption of =1.8 would imply luminosities higher by dex. The derived X-ray upper limits place strong constraints on the further presence of luminous AGN in our sample, unless they are heavily obscured.
Following F10, for the nine sources with an AGN from the SED fitting, we estimated the rest-frame X-ray emission using the mid-IR emission of the AGN component as a proxy of the nuclear power (Table 3). In particular, we use the –5.8 m relation (Fiore et al. 2009; , with luminosities expressed in erg s-1; see also Lutz et al. 2004), which was calibrated using unobscured AGN in the CDF-S and COSMOS surveys.
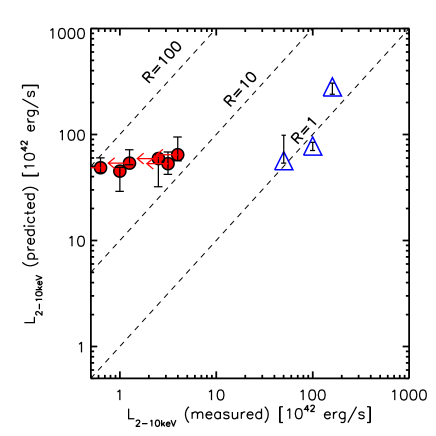
In Fig. 4 the predicted and measured X-ray luminosities are compared. For the three sources with clear AGN signatures (also from X-ray data), the luminosities have been corrected for the absorption (see Table 2 and above), while for the remaining sources, no correction has been applied, due to the lack of constraints to any possible column density from the low-count X-ray spectra. Overall, it appears that the three sources showing clear AGN signatures in the mid-IR band and in X-rays (U4950, U4958 and U5877) are broadly consistent with the 1:1 relation, considering the dispersion in the mid-IR/X-ray relation, the observational errors, and the uncertainties in deriving the intrinsic 2–10 keV luminosity properly. The correction accounting for the absorption seems to be correct also for the most heavily obscured of our X-ray sources, U4958.
For the other six sources, the expected 2–10 keV luminosity is a factor of 10–100 higher than the measured X-ray luminosity. Although caution is obviously needed in all the cases where mid-IR vs. X-ray luminosity correlations are used (see, e.g., the discussion in Vignali et al. 2010), the obscuration derived from the SED fitting for the remaining six sources (1023 cm-2) and the ratio between the measured and predicted luminosities suggest the presence of significant obscuration in these sources. Our conclusion is robust against the possible presence of absorption affecting also the values, since in this case the predicted X-ray luminosities should be considered as lower limits. Sensitive X-ray data over a larger bandpass would be needed to test the hypothesis of heavy obscuration in these sources.
| Name | f | f | f | log(L2-10keV) | logL() | Class.SED | ||
|---|---|---|---|---|---|---|---|---|
| (1) | (2) | (3) | (4) | (5) | (6) | (7) | (8) | (9) |
| U428 | 1.78 | 12.06 | - | - | - | 41.9 | - | |
| U4367 | 1.62 | 11.70 | - | - | - | - | - | |
| U4451 | 1.88 | 12.00 | - | - | - | - | - | |
| U4499 | 1.96 | 12.25 | - | - | - | - | - | |
| U4631 | 1.84 | 11.89 | - | - | - | - | - | |
| U4639 | 2.11 | 12.08 | 0.03 | 0.16 | 0.46 | 42.0 | 43.7 | AGN |
| U4642 | 1.90 | 11.83 | - | - | - | 42.8 | - | |
| U4812 | 1.93 | 12.45 | - | - | - | - | - | |
| U4950 | 2.31 | 12.17 | 0.22 | 0.63 | 0.91 | 44.2 | 44.4 | AGN |
| U4958 | 2.12 | 12.10 | 0.03 | 0.11 | 0.54 | 43.7 | 43.7 | AGN |
| U5050 | 1.73 | 11.90 | - | - | - | - | - | |
| U5059 | 1.77 | 11.95 | - | - | - | - | - | |
| U5150 | 1.90 | 12.24 | 0.04 | 0.26 | 0.61 | - | 43.8 | AGN |
| U5152 | 1.89 | 11.94 | 0.07 | 0.26 | 0.60 | - | 43.7 | AGN |
| U5153 | 2.09 | 12.26 | 0.10 | 0.51 | 0.78 | - | 43.8 | AGN |
| U5632 | 2.02 | 12.39 | - | - | - | 42.1 | - | |
| U5652 | 1.62 | 12.37 | 0.03 | 0.20 | 0.29 | - | 43.7 | AGN |
| U5775 | 1.90 | 11.98 | - | - | - | 41.8 | - | |
| U5795 | 1.70 | 11.93 | - | - | - | - | - | |
| U5801 | 1.84 | 11.70 | - | - | - | - | - | |
| U5805 | 2.03 | 12.12 | 0.02 | 0.13 | 0.71 | - | 43.7 | AGN |
| U5829 | 1.74 | 11.90 | - | - | - | - | - | |
| U5877 | 1.89 | 12.37 | 0.03 | 0.13 | 0.68 | 44.0 | 43.9 | AGN |
| U16526 | 1.72 | 12.38 | - | - | - | - | - |
Notes — (1) Source name (F10); (2) IRS redshift (F10); (3) logarithm of the total (AGNstellar) IR (8–1000 m) luminosity (in ); (4), (5), (6) AGN contribution to the 8–1000, 5–30 and 2–6 m luminosity, respectively, for the nine sources with an AGN component at the 3 level; (7) logarithm of the 2–10 keV luminosity (erg s-1; see Sec. 4.2 and Table 2); (8) logarithm of the 2–10 keV luminosity predicted from the – relation for sources with an AGN component detected at the 3 confidence level (erg s-1; see Fiore et al. 2009 and Sec. 4.2); (9) Source classification from SED fitting. “AGN” indicates that the nuclear component is detected at the 3 confidence level. All of the remaining sources are consistent with no significant AGN emission from the SED-fitting analysis.
5 Summary
In this paper we have studied the multi-band properties of a sample of IR luminous sources at in order to estimate the AGN contribution to their mid-IR and far-IR emission. The sample was selected by F10 at faint 24 m flux densities ( mJy) and to specifically target luminosities around , i.e. sampling the knee of the IR luminosity function.
We have extended the previous analysis by taking advantage of new far-IR data recently obtained by the Herschel satellite as part of the guaranteed survey “PACS Evolutionary Probe” (PEP, Lutz et al. 2011), and of the recently published 4 Ms Chandra data (Xue et al. 2011). The available photometry, coupled with IRS mid-IR data, have been used to reconstruct the broad-band SEDs of our IR-luminous galaxies. These SEDs have been modeled using a SED-fitting technique with three components, namely a stellar, an AGN, and a starburst component. The most up-to-date smooth torus model by F06 have been adopted for the AGN emission. The major results of the work can be summarized as follows.
-
•
SED fitting indicates that emission from the host galaxy in the optical/near-IR and star formation in the mid-IR/far-IR is required for all of the sources. Presence of an AGN component is consistent with the data for all but one source (U428), although only for 9 out of the 24 galaxies ( of the sample) is this emission significant at least at the 3 level.
-
•
Of the sub-sample of nine sources that likely harbour an AGN according to the SED fitting, we find that their total (8–1000 m) and mid-IR (5–30 m) emissions are dominated by starburst processes, with the AGN-powered emission accounting for only and of the energy budget in these wavelength ranges, respectively. We find that the AGN radiation overcomes the stellar + starburst components only in the narrow 2–6 m range, where it accounts for 60% of the energy budget. In this wavelength range, stellar emission has significantly declined and emission from PAH features and starburst emission is not prominent yet.
-
•
For this same sub-sample, the gas column densities (derived by converting the dust optical depth at 9.7 m obtained from the SED fitting) are indicative of a significant level of obscuration. In particular, three sources, also detected as relatively bright X-ray sources (U4950, U4958, and U5877, see below), have cm-2 (considering all the solutions at the 3 confidence level), while the remaining six sources have cm-2.
-
•
X-ray analysis confirm that three sources (U4950, U4958, and U5877) are actually powered by an AGN at short wavelengths, and that this AGN varies from being moderately (U4950 and U5877) to heavily obscured, possibly Compton thick (U4958). The X-ray luminosity of U4642 is also suggestive of moderately obscured AGN emission. The remaining four sources detected by Chandra have X-ray emission consistent with star-formation processes.
-
•
For the six sources where the AGN is required only by SED fitting (i.e., no strong AGN emission is observed in X-ray), we estimate an intrinsic X-ray nuclear luminosity from the AGN continuum at 5.8 m. The ratio (from 10 up to 100) between the predicted and the measured luminosities suggests the presence of significant obscuration in these sources.
acknowledgements
The authors thank the referee for his/her useful comments.
FP and CV thank the Sterrenkundig Observatorium (Universiteit Gent),
in particular Prof. M. Baes and Dr. J. Fritz, for their kind hospitality.
The authors are grateful to F.E. Bauer and F. Vito for their help with
Chandra spectra.
CV acknowledges partial support from the Italian Space Agency (contract
ASI/INAF/I/009/10/0).
PACS has been developed by a consortium of institutes led by MPE (Germany) and
including UVIE (Austria); KU Leuven, CSL, IMEC (Belgium); CEA, LAM (France);
MPIA (Germany); INAF- IFSI/OAA/OAP/OAT, LENS, SISSA (Italy); IAC (Spain).
This development has been supported by the funding agencies BMVIT (Austria),
ESA-PRODEX), CEA/CNES (France), DLR (Germany), ASI/INAF (Italy),
and CICYT/MCYT (Spain).
References
- Alexander et al. (2005) Alexander D. M., Bauer F. E., Chapman S. C., Smail I., Blain A. W., Brandt W. N., Ivison R. J., 2005, ApJ, 632, 736
- Alonso-Herrero et al. (2011) Alonso-Herrero A. et al., 2011, ApJ, 736, 82
- Baes et al. (2010) Baes M. et al., 2010, A&A, 518, L39+
- Berta et al. (2004) Berta S., Fritz J., Franceschini A., Bressan A., Lonsdale C., 2004, A&A, 418, 913
- Berta et al. (2011) Berta S. et al., 2011, A&A, 532, A49
- Bohlin et al. (1978) Bohlin R. C., Savage B. D., Drake J. F., 1978, ApJ, 224, 132
- Brandl et al. (2006) Brandl B. R. et al., 2006, ApJ, 653, 1129
- Calzetti et al. (2000) Calzetti D., Armus L., Bohlin R. C., Kinney A. L., Koornneef J., Storchi-Bergmann T., 2000, ApJ, 533, 682
- Caputi et al. (2007) Caputi K. I. et al., 2007, ApJ, 660, 97
- Cardelli et al. (1989) Cardelli J. A., Clayton G. C., Mathis J. S., 1989, ApJ, 345, 245
- Chary & Elbaz (2001) Chary R., Elbaz D., 2001, ApJ, 556, 562
- Ciliegi et al. (2001) Ciliegi P., Gruppioni C., McMahon R., Rowan-Robinson M., 2001, Ap&SS, 276, 957
- Dullemond & van Bemmel (2005) Dullemond C. P., van Bemmel I. M., 2005, A&A, 436, 47
- Efstathiou & Rowan-Robinson (1995) Efstathiou A., Rowan-Robinson M., 1995, MNRAS, 273, 649
- Elbaz et al. (2011) Elbaz D. et al., 2011, A&A, 533, A119
- Elbaz et al. (2010) Elbaz D. et al., 2010, A&A, 518, L29
- Elitzur (2008) Elitzur M., 2008, New Astronomy Review, 52, 274
- Fadda et al. (2010) Fadda D. et al., 2010, ApJ, 719, 425
- Fiore et al. (2009) Fiore F. et al., 2009, ApJ, 693, 447
- Fritz et al. (2006) Fritz J., Franceschini A., Hatziminaoglou E., 2006, MNRAS, 366, 767 (F06)
- Granato & Danese (1994) Granato G. L., Danese L., 1994, MNRAS, 268, 235
- Gruppioni et al. (2010) Gruppioni C. et al., 2010, A&A, 518, L27+
- Hatziminaoglou et al. (2008) Hatziminaoglou E. et al., 2008, MNRAS, 386, 1252
- Hönig & Kishimoto (2010) Hönig S. F., Kishimoto M., 2010, A&A, 523, A27+
- Jaffe et al. (2004) Jaffe W. et al., 2004, Nat, 429, 47
- Lampton et al. (1976) Lampton M., Margon B., Bowyer S., 1976, ApJ, 208, 177
- Laurent et al. (2000) Laurent O., Mirabel I. F., Charmandaris V., Gallais P., Madden S. C., Sauvage M., Vigroux L., Cesarsky C., 2000, A&A, 359, 887
- Le Floc’h et al. (2005) Le Floc’h E. et al., 2005, ApJ, 632, 169
- Lu et al. (2003) Lu N. et al., 2003, ApJ, 588, 199
- Luo et al. (2008) Luo B. et al., 2008, ApJS, 179, 19
- Lutz et al. (2004) Lutz D., Maiolino R., Spoon H. W. W., Moorwood A. F. M., 2004, A&A, 418, 465
- Lutz et al. (2011) Lutz D. et al., 2011, A&A, 532, A90
- Lutz et al. (1998) Lutz D., Spoon H. W. W., Rigopoulou D., Moorwood A. F. M., Genzel R., 1998, ApJL, 505, L103
- Magnelli et al. (2009) Magnelli B., Elbaz D., Chary R. R., Dickinson M., Le Borgne D., Frayer D. T., Willmer C. N. A., 2009, A&A, 496, 57
- Magnelli et al. (2011) Magnelli B., Elbaz D., Chary R. R., Dickinson M., Le Borgne D., Frayer D. T., Willmer C. N. A., 2011, A&A, 528, A35+
- Maiolino et al. (2001) Maiolino R., Marconi A., Salvati M., Risaliti G., Severgnini P., Oliva E., La Franca F., Vanzi L., 2001, A&A, 365, 28
- Mullaney et al. (2011) Mullaney J. R., Alexander D. M., Goulding A. D., Hickox R. C., 2011, MNRAS, 414, 1082
- Nenkova et al. (2002) Nenkova M., Ivezić Ž., Elitzur M., 2002, ApJL, 570, L9
- Nenkova et al. (2008) Nenkova M., Sirocky M. M., Nikutta R., Ivezić Ž., Elitzur M., 2008, ApJ, 685, 160
- Nordon et al. (2012) Nordon R. et al., 2012, ApJ, 745, 182
- Papovich et al. (2007) Papovich C. et al., 2007, ApJ, 668, 45
- Piconcelli et al. (2005) Piconcelli E., Jimenez-Bailón E., Guainazzi M., Schartel N., Rodríguez-Pascual P. M., Santos-Lleó M., 2005, A&A, 432, 15
- Pier & Krolik (1992) Pier E. A., Krolik J. H., 1992, ApJ, 401, 99
- Polletta et al. (2008) Polletta M., Weedman D., Hönig S., Lonsdale C. J., Smith H. E., Houck J., 2008, ApJ, 675, 960
- Pope et al. (2008) Pope A. et al., 2008, ApJ, 675, 1171
- Pozzi et al. (2010) Pozzi F. et al., 2010, A&A, 517, A11+
- Risaliti et al. (2010) Risaliti G., Imanishi M., Sani E., 2010, MNRAS, 401, 197
- Risaliti et al. (2006) Risaliti G. et al., 2006, MNRAS, 365, 303
- Sajina et al. (2008) Sajina A. et al., 2008, ApJ, 683, 659
- Salpeter (1955) Salpeter E. E., 1955, Vistas in Astronomy, 1, 283
- Santini et al. (2009) Santini P. et al., 2009, VizieR Online Data Catalog, 350, 40751
- Siebenmorgen et al. (2005) Siebenmorgen R., Haas M., Krügel E., Schulz B., 2005, A&A, 436, L5
- Silva et al. (2004) Silva L., Maiolino R., Granato G. L., 2004, MNRAS, 355, 973
- Soifer & Neugebauer (1991) Soifer B. T., Neugebauer G., 1991, AJ, 101, 354
- Soifer et al. (1987) Soifer B. T., Neugebauer G., Houck J. R., 1987, ARA&A, 25, 187
- Spergel et al. (2003) Spergel D. N. et al., 2003, ApJS, 148, 175
- Sutherland & Saunders (1992) Sutherland W., Saunders W., 1992, MNRAS, 259, 413
- Symeonidis et al. (2010) Symeonidis M., Rosario D., Georgakakis A., Harker J., Laird E. S., Page M. J., Willmer C. N. A., 2010, MNRAS, 403, 1474
- Valiante et al. (2007) Valiante E., Lutz D., Sturm E., Genzel R., Tacconi L. J., Lehnert M. D., Baker A. J., 2007, ApJ, 660, 1060
- Vignali et al. (2010) Vignali C., Alexander D. M., Gilli R., Pozzi F., 2010, MNRAS, 404, 48
- Vignali et al. (2011) Vignali C. et al., 2011, MNRAS, 416, 2068
- Vignali et al. (2009) Vignali C. et al., 2009, MNRAS, 395, 2189 (V09)
- Xue et al. (2011) Xue Y. Q. et al., 2011, ApJS, 195, 10