Mid-Infrared Spectral Variability Atlas of Young Stellar Objects***This work is based on observations made with the Infrared Space Observatory (ISO) and with the Spitzer Space Telescope. ISO is an ESA project with instruments funded by ESA Member States (especially the PI countries: France, Germany, the Netherlands and the UK) and with the participation of ISAS and NASA. Spitzer is operated by the Jet Propulsion Laboratory, California Institute Technology under a contract with NASA.
Abstract
Optical and near-infrared variability is a well-known property of young stellar objects. However, a growing number of recent studies claim that a considerable fraction of them also exhibit mid-infrared flux changes. With the aim of studying and interpreting variability on a decadal timescale, here we present a mid-infrared spectral atlas containing observations of 68 low- and intermediate mass young stellar objects. The atlas consists of 2.5–11.6m low-resolution spectra obtained with the ISOPHOT-S instrument on-board the Infrared Space Observatory (ISO) between 1996 and 1998, as well as 5.2–14.5m low-resolution spectra obtained with the IRS instrument on-board the Spitzer Space Telescope between 2004 and 2007. The observations were retrieved from the ISO and Spitzer archives and were post-processed interactively by our own routines. For those 47 objects where multi-epoch spectra were available, we analyze mid-infrared spectral variability on annual and/or decadal timescales. We identify 37 variable candidate sources. Many stars show wavelength-independent flux changes, possibly due to variable accretion rate. In several systems, all exhibiting 10m silicate emission, the variability of the 68m continuum and the silicate feature exhibit different amplitudes. A possible explanation is variable shadowing of the silicate emitting region by an inner disk structure of changing height or extra silicate emission from dust clouds in the disk atmosphere. Our results suggest that mid-infrared variability, in particular the wavelength-dependent changes, are more ubiquitous than was known before. Interpreting this variability is a new possibility to explore the structure of the disk and its dynamical processes.
1 Introduction
At the early phases of their formation, stars are intimately linked to their circumstellar environment. Dust particles in the circumstellar disk and envelope are heated both internally by viscous energy released in the midplane of the accretion disk, and externally by irradiation from the central star. The absorbed energy is re-radiated as thermal emission at infrared (IR) wavelengths. The shape of the IR spectral energy distribution (SED) reflects the temperature and density structure of the circumstellar environment. Of particular importance is the mid-IR domain (3–25m), where the disk emission originates from the region where planets are formed. The same domain contains spectral features of PAH particles, small silicate grains, and molecular ices. PAH features give information about the UV radiation field and ionization balance in the circumstellar gas (Tielens, 2008); the shape and amplitude of the 10m silicate feature is partly related to the degree of crystallinity of the silicate grains, indicating how far these grains evolved from the interstellar medium (Henning, 2010); while ice features are used to study the organic chemistry and thermal history of the circumstellar material (van Dishoeck, 2004).
Although optical and near-IR variability is a well-known property of young stellar objects (YSOs), a growing number of recent studies claim that a considerable fraction of them also exhibit mid-IR photometric changes (e.g. Barsony et al., 2005; Morales-Calderón et al., 2009, 2011). In young eruptive stars and some T Tauri stars, changing accretion is thought to be responsible for mid-IR variability (e.g. Ábrahám et al., 2004; Kóspál et al., 2007; van Boekel et al., 2010). There are claims that in some young eruptive stars the temporarily increased heat leads to structural changes in the innermost part of the system, resulting in decreased extinction and consequently in IR brightness changes (see, e.g., V1647 Ori in Muzerolle et al. 2005b, or PV Cep in Kun et al. 2011). In some intermediate mass young stars, structural changes in the inner disk were invoked to explain their mid-IR flux changes (Juhász et al., 2007; Sitko et al., 2008). A similar reason, i.e. changing inner disk height, may also explain the variability of those low-mass objects whose disks contain holes and gaps (Muzerolle et al., 2009; Espaillat et al., 2011). These indications of dynamical processes suggest that disks are less steady-state than thought before.
The wavelength-dependence of the mid-IR variability carries information on the disk and envelope structure, because the emission at different wavelengths corresponds to disk regions with different temperatures and thus to different radial distances from the star. An interesting aspect is the exploration of possible changes in the strength and profile of IR spectral features. Several studies published so far concentrate on the variability of the 10m silicate feature. Time-dependent shadowing of disk areas by the inner gas disk could explain the spectral changes in the Herbig stars HD 31648 and HD 163296 (Sitko et al., 2008). In the highly accreting T Tauri stars DG Tau and XZ Tau (Bary et al., 2009), self-absorption may play a role in the variability of the 10m feature. Changes in the mineralogical composition of the emitting dust particles were also observed by Ábrahám et al. (2009) in the most recent outburst of EX Lupi, where they detected the appearance of crystalline silicates that were not present in quiescence. However, more detailed investigations are limited by the lack of multi-epoch mid-IR spectroscopic databases.
The timescale of mid-IR variability is related to the timescale on which the heating of the emitting region can vary and on which the dust particles in the disk can react to changes in the energy input. For example, almost instantaneous (seconds to minutes) responses to fluctuations in the stellar illumination may indicate emission from an optically thin medium, while longer timescales (years) may indicate an optically thick medium (Chiang & Goldreich, 1997). Dynamical changes leading to rearrangement of the density structure can occur on the timescale of an orbital period. Thus, the timescale of the variability is an essential input to understand the physics behind the flux changes. Recent studies carried out with the Spitzer Space Telescope sampled MIR variability on several different timescales. While hourly variations are rare and small in amplitude (Morales-Calderón et al., 2009), variability on daily, weekly, and yearly timescales is ubiquitous, and amplitudes range from a few tenths of magnitudes to 1 mag (Morales-Calderón et al., 2009; Luhman et al., 2010; Morales-Calderón et al., 2011; Rebull, 2011). These timescales, if caused by changes in the disk structure, indicate that the variability is connected to the innermost 0.1–1 AU of the disk. With Spitzer alone, however, one cannot investigate whether variability on longer timescale exists. Such data would provide information on dynamical changes at larger radial distances from the star, typically several AU. Such study can only be performed by comparing data from two IR space missions separated in time by several years.
Motivated by the above mentioned considerations, here we present a new atlas of 2.5–11.6m low-resolution spectra obtained with the ISOPHOT-S instrument on-board the Infrared Space Observatory (ISO) between 1996 and 1998, as well as 5.2–14.5m low-resolution spectra obtained with the IRS instrument on-board the Spitzer Space Telescope between 2004 and 2007. The overlapping wavelength range and different epochs of ISO and Spitzer make it possible to do a systematic mid-IR spectral variability study for a large sample of well-known YSOs both on annual timescale (less than a few years, i.e. within the cryogenic lifetime of either telescope), and of nearly a decade (by comparing the results of the two telescopes). Although the beams of the two instruments significantly differ, beam confusion is usually not an issue, because at mid-IR wavelengths, the size of the emitting region (warm dust in the inner few AUs) is smaller than either in the optical (scattered light) or in the far-IR/mm (thermal emission from cold dust). We identify typical variability patterns and hypothesize about their possible physical origin. Our results on monitoring and interpreting variability may provide a powerful “extra dimension” of information on the structure of the circumstellar material. Our sample may also serve as a starting point to plan follow-up mid-IR monitoring campaigns.
2 Observations and data reduction
2.1 Sample selection
We made a query of the ISO data archive for ISOPHOT-S observations (AOT PHT40) and selected observations of low- and intermediate mass YSOs by consulting the SIMBAD database and the literature. The query resulted in 94 measurements of 68 YSOs; including 35 low-mass and 33 intermediate mass stars. This forms the target list of the present study. Then we checked the Spitzer archive for 5.2–14.5m low-resolution IRS spectra. We found that such Spitzer spectra were available for 51 of our targets. Table 1 presents the list of our targets and the log of observations.
2.2 ISO data reduction
ISOPHOT-S was a sub-instrument of ISOPHOT on-board the ISO. It produced low-resolution mid-IR spectra of 128 data points covering the 2.5–4.9 (ISOPHOT-SS) and 5.8–11.6m (ISOPHOT-SL) wavelength ranges with a spectral resolution of 100 during the active period of ISO (1995–1998). The aperture was 24′′24′′. For a detailed description of the ISOPHOT-S instrument and its calibration strategies, see Acosta-Pulido & Ábrahám (2003).
Most observations presented here consist of pairs of separate ON/OFF measurements, but chopping between the source and background position(s), as well as small scans/maps were also utilized. Edited Raw Data (ERD), produced by the ISOPHOT Off-Line Processing software (OLP v. 10.0, Laureijs et al. 2003), were downloaded from the ISO Data Archive for all of our targets. Standard processing to Auto Analysis Product Data (AAP) level was performed with the ISOPHOT Interactive Analysis Software Package (PIA v10.0, Gabriel et al. 1997). Further processing was done using self-developed IDL routines consisting of the following steps: improved deglitching, correction for memory effects due to preceding bright source measurements, background subtraction in the lack of dedicated OFF observation, correction for flux loss in off-center pointings (in case the offset was larger than 1′′), and an empirical photometric correction. Several of these algorithms were aimed at correcting artifacts that were discovered after the development of the ISO offline processing software was finished. We found that in a number of cases, the reprocessing significantly improved the data quality. According to our systematic study of 28 normal star spectra, we concluded that the uncertainty of the absolute calibration is 5-10% for bright sources (brighter than a few Jy) and 30100 mJy for fainter sources (1 Jy). Note that these figures are valid for each independently calibrated pixel. A detailed explanation of the correction steps and the error budget can be found in Appendix A.
2.3 Spitzer data reduction
The Infrared Spectrograph (IRS) on-board the Spitzer Space Telescope had two low resolution and two high resolution modules, covering the 5.2–38m wavelength range. Since our aim is to look for mid-IR variability, here we utilize the Short-Low channel that covers the 5.2–14.5m wavelength range, thus has the largest wavelength overlap with ISOPHOT-S. The Short-Low channel has a spectral resolution of 60–127, comparable to that of ISOPHOT-S. The width and length of the IRS Short-Low slit is 36 and 57′′, respectively. According to the IRS instrument handbook (Version 4.0), the uncertainty of the absolute flux calibration is 5-10%, while the repeatability is 2-5%.
We downloaded basic calibrated data (BCD) files from the Spitzer archive, processed with the pipeline version 18.18.0. Measurements were taken either in staring mode (two nod positions), or in spectral mapping mode (small 23 maps). In the latter case, we used the central 2 positions, and considered them as normal staring measurements. We first subtracted the two nod positions from each other. Then we used the Spitzer IRS Custom Extraction software (SPICE) to extract the positive signal from the two-dimensional dispersed images. We extracted the spectra from a wavelength-dependent, tapered aperture around the target, and we averaged the two spectra corresponding to the two nod positions. In case the target was not well-centered in the slit (i.e. offset from the slit center perpendicular to the slit was larger than 0.5′′), we corrected the spectra for flux loss using the measured IRS beam profiles (for details, see Kóspál et al. 2008).
2.4 Comparison of the ISOPHOT-S and Spitzer/IRS calibration
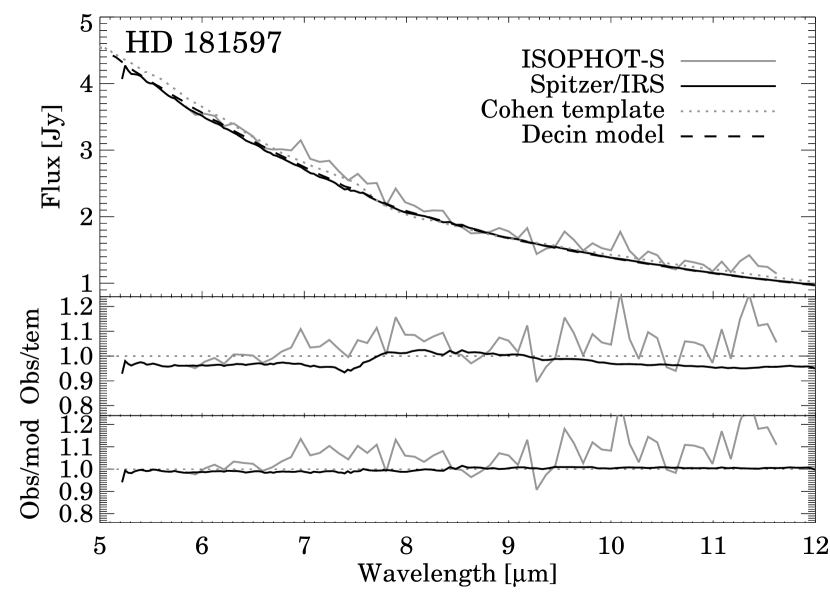
The absolute spectrophotometric calibration of ISOPHOT-S was based both on empirical spectral templates of standard stars derived by Cohen (2003), and on stellar atmosphere models provided by Hammersley & Jourdain de Muizon (2003) using infrared observations. Spitzer/IRS spectra, on the other hand, were calibrated using standard stars for which model atmospheres are available in Decin et al. (2004). Nevertheless, Cohen templates were used to verify the calibration of IRS (Houck et al., 2004). Thus, despite the differences in calibration strategy, we do not expect significant systematic discrepancies between the ISOPHOT-S and the IRS spectra. In order to check this, we reduced the spectra of HD 181597 (HR 7341), a K1 III type star that was used as a primary low resolution standard for Spitzer and was also used in the calibration of ISOPHOT-S. In Fig. 1 we plotted the observations along with the template and model spectra, and we also calculated their ratio. The figure shows that the template and model spectra are close to each other, and the observations are within 10% (for ISOPHOT-S) or 5% (for Spitzer/IRS) of the template/model spectra. We emphasize that no wavelength-dependent trend can be seen in the ratios, suggesting that the calibration uncertainties would not affect the observed colors of the targets. Thus, we conclude that the accuracies of the absolute calibration mentioned in Sec. 2.2 and 2.3 are plausible and there is no need to increase the error bars when comparing spectra obtained with the two different telescopes.
3 Catalog of observations and the spectral atlas
In Table 1 we present the catalog of spectroscopic observations. The table contains the following columns:
Column (1): Name of the target as common in the literature.
Column (2): L – low-mass pre-main sequence stars (T Tauri-type stars and embedded young stellar objects); I – intermediate mass pre-main sequence stars (Herbig Ae/Be stars). B, A, and F stars are considered intermediate mass stars, while G, K, and M stars are considered low-mass stars. Spectral types or stellar masses for sources where SIMBAD does not provide spectral types were taken from Straižys et al. (2002) for IRAS 03260+3111, Myers et al. (1987) for BARN 5 IRS 1, Brinch et al. (2007) for LDN 1489 IRS, Lim & Takakuwa (2006) for LDN 1551 IRS 5, Sandell & Weintraub (2001) for Reipurth 50 N IRS 1, Simon et al. (1995) for WL 16, Bontemps et al. (2001) for WL 6, Hodapp et al. (1996) for OO Ser, and Pontoppidan et al. (2004) for [SVS76] Ser 4.
Column (3): Spectral types from the SIMBAD database.
Column (4)-(5): J2000 coordinates of the source from the 2MASS All-Sky Catalog of Point Sources (Cutri et al., 2003), except where indicated in the table. Since the peak of the optical and IR emission might not coincide, we decided to use coordinates from 2MASS instead of optical positions. These coordinates are precise enough to carry out the offset-correction if the source was off-center in the ISOPHOT-S aperture or in the Spitzer/IRS slit.
Column (6): Unique 8-digit identifier of the on-source ISOPHOT-S observation in the ISO Data Archive (TDT number).
Column (7): Corrections applied to the ISOPHOT-S observations: M – memory correction; B – in the lack of dedicated OFF measurement, zodiacal background was predicted and subtracted; O – position offset correction applied. An exclamation mark signals spectra where the uncertainty of the correction is above 10%, thus they are not used for variability analysis (for details, see Appendices A and B).
Column (8): Date of the ISOPHOT-S observation.
Column (9): Unique identifier of the Spitzer/IRS observation in the Spitzer Data Archive (AOR).
Column (10): Corrections applied to the Spitzer/IRS observations: O – position offset correction applied.
Column (11): Date of the Spitzer/IRS observation.
Column (12)-(14): Inventory of clearly visible spectral features. Si-O – 10m silicate feature; Ices – H2O 3.1m, CO2 4.27m, H2O 6.0m, CH3OH 6.8m, or CH4 7.7m; PAH – 3.3, 6.2, 7.7, 8.6, 11.2, or 12.7m bands of polycyclic aromatic hydrocarbons. em – feature in emission; abs – feature in absorption; …– feature not present.
Column (15): Type of the spectral shape: PAH dom. – the spectrum is dominated by PAH emission features, no 10m silicate feature is discernible; sil. em. – the 10m silicate feature is in emission; sil. abs. – the 10m silicate or ice bands are visible in absorption; …– undecided; (for details, see Sec. 4).
Column (16): Variability: yes – candidate variable source; no – constant source; …– undecided.
The table and the spectra are also available electronically.
4 Results
In Fig. 2 we present the ISOPHOT-S and Spitzer/IRS spectra for each object. Where clearly detected, we marked with vertical dashed lines the wavelengths of molecular ice bands (H2O 3.1m, CO2 4.27m, H2O 6.0m, CH3OH 6.8m, CH4 7.7m); and with vertical dotted lines the wavelengths of PAH features (3.3, 6.2, 7.7, 8.6, 11.2, 12.7m). The figures show both cases where the plotted spectra agree, and sources where the measurements at different epochs seem to differ. Some of the differences can be explained by serious instrumental artifacts or source confusion resulting from the different beam sizes of the ISOPHOT-S and IRS instruments. We studied the literature of each object in order to establish whether it is part of a multiple stellar system and whether there is any indication for extended near or mid-IR emission in the vicinity. These information are presented in Appendix B for the affected objects. Based on this, we could decide whether it is meaningful to compare the different spectra in Fig. 2 to look for temporal variability. For certain objects, Appendix B also contains a non-exhaustive comparison with other mid-IR spectra published in the literature.
In order to explore the significance of the observed flux changes and check their wavelength-dependence, we computed the ratio of spectra taken at different epochs. In Fig. 3 we plotted these flux ratios for sources where spectra at more than one epoch were available and their comparison was meaningful (47 stars). Where several spectra existed, we took the two most extremes. In case the ratio of a Spitzer/IRS and an ISOPHOT-S spectrum is plotted, the former was first resampled to the latter’s wavelength resolution. Error bars plotted in this figure represent the quadratic sum of the errors of each spectrum. Where the ratio of two Spitzer spectra is computed, instead of the 10% absolute calibration uncertainty, we used the 5% uncertainty of the repeatability (BF Ori and HD 98800). We also overplotted with vertical dotted/dashed lines the wavelengths of PAH/ice features for sources where these features are present.
For the purpose of further analyses, we classified our sources into three groups based on the shape of the mid-IR SED and the presence of various spectral features as follows:
-
•
PAH dominated sources: the spectrum is dominated by PAH bands, no apparent 10m silicate emission band is visible (13 objects);
-
•
Silicate emission sources: the spectrum is dominated by the 10m silicate emission band, otherwise it is rather featureless (36 objects). In a few sources, weak PAH emission is present;
-
•
Silicate absorption sources: the spectrum is rising towards longer wavelengths, it displays 10m silicate absorption and/or several ice absorption bands (16 objects).
Our classification is presented in Column (15) of Table 1, as well as in Fig. 2 in parentheses under the name of each source. We could classify all sources except DG Tau, Ced 112 IRS 4, and CK 1, which display an apparent combination of silicate emission and absorption.
4.1 Statistics and wavelength-dependence of mid-IR variability
Inspecting Figs. 2 and 3, we could conclude that the flux ratio in many sources differ from unity at a level of more than 1, for part of or the whole wavelength range. Note that 1 here refers to individual wavelength channels, and averaging the spectrum for a wider wavelength range suppresses the random, channel-to-channel noise. Thus, a 10-15% flux change for a continuous wavelength range is in fact already a strong indication of variability. Out of the full sample of 68 stars, variability could not be decided for 21 objects, for having only one spectrum, or due to problems related to faintness, source confusion, or instrumental artifacts. We found 10 stars (21%) to be constant between 6 and 11.5m. The remaining 37 sources (78%) were classified as variable objects. These are marked in Column 16 of Table 1.
The wavelength-dependence of the observed variability can also be characterized from our data. By looking at Figs. 2 and 3, we conclude that the wavelength-dependence of the flux changes is mostly smooth over the 5–12m spectral range, and radical changes within a few channel distance are not observed. Although changes in the strength of the 10m silicate emission feature are ubiquitous and will be quantified and discussed later (see Sections 4.3 and 5.2), we found no sources where the silicate or any other spectral feature emerged or completely disappeared from one epoch to the other. Neither did we find sources where the shape of the feature changed significantly, implying that alteration of the size distribution or mineralogical composition of the emitting dust grains (cf. the crystallization during the outburst of EX Lup, Ábrahám et al. 2009) is not widespread in our sample.
4.2 Synthetic photometry and variability timescales
The smooth trends of the flux ratio curves in Fig. 3 suggest that the wavelength-dependence of the variability can be fully described, with high signal-to-noise ratio, via integrating the spectra over a few wavelength intervals and looking at the changes of these integrals. Following this idea, we derived synthetic photometry from the spectra. For objects with silicate emission or absorption, we calculated synthetic photometry for each source by averaging the ratio curves in Fig. 3 between 6 and 8m and between 8 and 11.5m, and converting them to magnitude differences. The former wavelength range is representative of the continuum, while the latter one covers the 10m silicate feature and is close to the usual N photometric band. For PAH dominated objects, we defined a “continuum band” by averaging ratios at 6.5–7 and 9.5–10.5m and a “PAH feature band” containing the remaining parts of the spectrum.
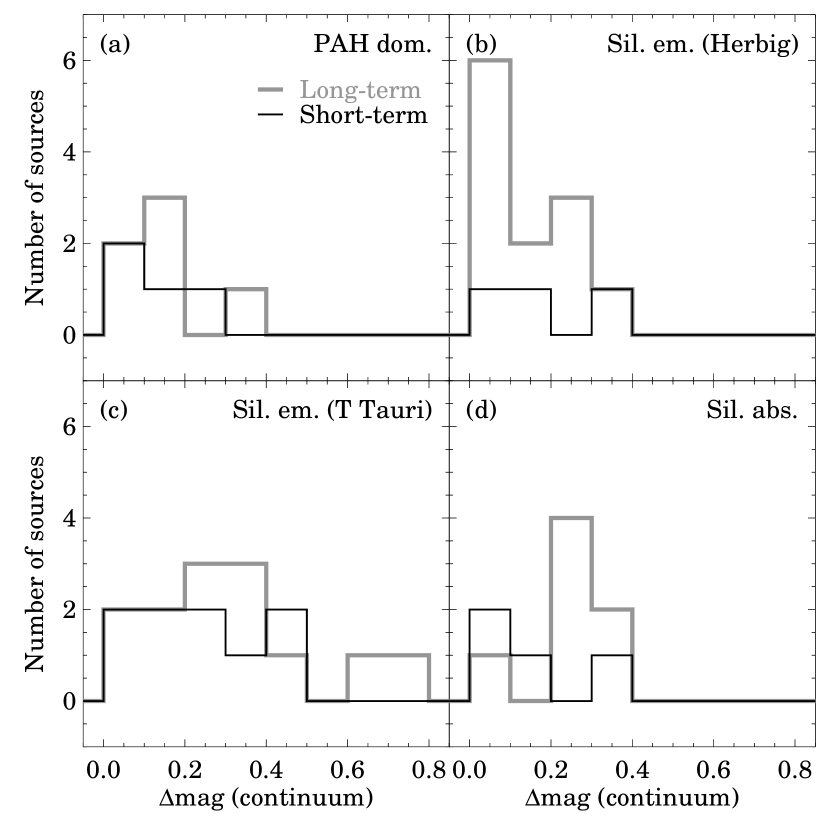
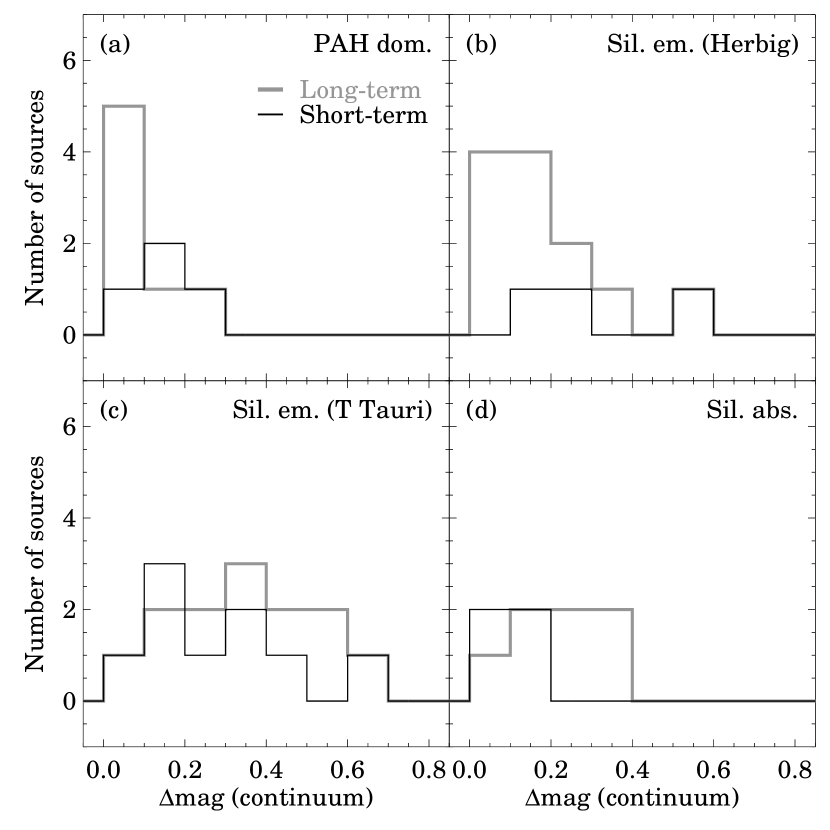
The synthetic magnitudes can be used to assess quantitatively a fundamental question: whether the characteristics (frequency and amplitude) of the variability are the same on annual timescales (ISOPHOT-S vs. ISOPHOT-S or Spitzer vs. Spitzer) and on decadal timescales (ISOPHOT-S vs. Spitzer), or there is a hint for long-term variability trends (higher frequency or larger amplitude) not measurable by ISOPHOT-S alone or Spitzer alone. In Fig. 4 we compared the distribution of magnitude changes in the annual and decadal cases for the three objects types defined above. Histograms are plotted separately for the “continuum” and the “feature” magnitude changes. For PAH dominated objects, no systematic difference can be seen between the short-term and the long-term distributions, either in the continuum or the feature (Fig. 4a, e). For objects with silicate emission, we plotted separately the intermediate mass and the low-mass stars, but even with this separation, no significant differences can be seen between the two timescales (Fig. 4b, c, f, and g). The only weak hint for such long-term trends might be seen for silicate absorption sources, where both in the continuum and the feature, the decadal changes seem to be somewhat more common and exhibit somewhat larger magnitude differences than on annual scale (Fig. 4d, h). Although the number statistics are limited, we can conclude that the characteristic timescales of the mid-IR variability we are observing is less than or equal to a few years, and in the following we do not differentiate between annual and decadal changes when studying the physical reasons of the variability.
4.3 Trends in the mid-IR flux changes
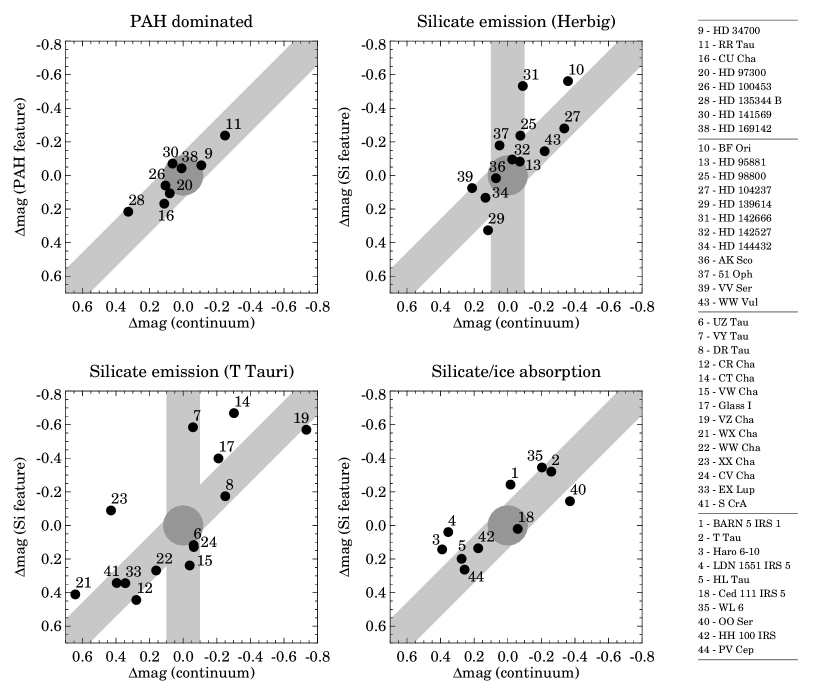
In Fig. 5 we plot the obtained synthetic magnitude changes. As in Fig. 3, we always considered the two most extreme spectra. Sources with constant flux in the whole 6–11.5m wavelength range (Fig. 3) are situated close to the (0,0) point. Most of them fall into an area within 0.1 mag, indicated by a dark gray circle. Moreover, we checked the synthetic photometry for the calibration star HD 181597, which was observed by both ISOPHOT-S and Spitzer/IRS (Fig. 1), and found mag(6–8m)=0.067 mag, mag(8–11.5m)=0.076 mag. For these reasons, we consider the value of 0.1 mag as a practical threshold between variable and constant sources. Objects with a wavelength independent flux change (either brightening or fading) are distributed along the 45 degree diagonal line (for guiding the eye, this line, broadened by a 0.1 mag typical uncertainty, is plotted with light gray). A similar, but vertical stripe is plotted for objects with silicate emission, marking the location of those sources where the continuum part was constant, but the 10m silicate emission feature varied significantly.
Several trends in the distribution of the points can be recognized in Fig. 5.
-
•
Objects whose spectra dominated by PAH emission are plotted in the upper left panel of Fig. 5. Out of these 8 objects, 5 are marked as constant in column 15 of Tab. 1. These are situated within 0.1 mag of the (0,0) point. All the remaining three sources (RR Tau, CU Cha, and HD 135344 B) are distributed along the diagonal stripe with a magnitude difference of 0.2-0.3 mag both in the continuum and in the PAH feature band. We suggest that these objects show real physical variability (RR Tau exhibited flux changes of 0.5 mag also between 2.5–5 m, see Fig. 2). The variability in the 6–11.5 m range seems to be wavelength independent, as indicated by the distribution of points along the diagonal stripe. This means that for each source the variation in the PAH features and in the continuum has similar amplitude.
-
•
Stars with silicate emission are plotted in the upper right (Herbig stars) and lower left (T Tauri stars) panels of Fig. 5. They exhibit the largest diversity in variability patterns within the whole sample. Three Herbig stars (HD 95881, HD 142527, and AK Sco) and no T Tauri stars are constant. 11 stars show wavelength independent flux changes of 0.1 mag, located along the diagonal stripe (Herbig stars: BF Ori, HD 104237, HD 144432, VV Ser, WW Vul; T Tauri stars: DR Tau, VZ Cha, WX Cha, WW Cha, EX Lup, S CrA). The amplitude can be as high as 0.7 mag. Remarkably, another 11 sources change their brightness primarily in the 8–11.5m band (amplitude is 0.6 mag) while at shorter wavelengths, they are less variable or constant (Herbig stars: HD 98800, HD 139614, HD 142666, 51 Oph; T Tauri stars: UZ Tau, VY Tau, CR Cha, CT Cha, VW Cha, Glass I, CV Cha). Interestingly, one T Tauri star does not follow any of the above described trends. XX Cha became brighter at shorter wavelengths and fainter at longer wavelengths, exhibiting an anti-correlation between the two synthetic photometric bands. Although the amplitude of the variability of this source is small, the phenomenon is probably real, since it is the slope of the mid-IR SED that changed, rather than the more uncertain absolute flux level only.
-
•
Stars with silicate and/or ice absorption (lower right panel in Fig. 5) show frequent variability (only one source out of 10, Ced 111 IRS 5, is constant). The observed variations mostly follow the diagonal stripe, indicating wavelength independent flux changes. The amplitude of the variability is at most 0.4 mag. Slight deviations from this trend can be seen in those objects where the 10m silicate absorption feature is very deep, thus, their 8–11.5m flux is close to zero and remains essentially constant (e.g. Haro 6-10, LDN 1551 IRS 5, OO Ser).
There are objects where the detected flux changes are only marginal (0.1 mag), and their association with the above mentioned trends may not be unambiguous. However, for each trend, there are clear examples with magnitude changes 0.3 mag, which proves the existence of these trends. The association of a certain source with a variability trend might depend on which measurements are compared. E.g. in the case of WW Cha, we have one ISOPHOT-S and three Spitzer/IRS spectra. The comparison of the Spitzer spectra indicate wavelength-independent changes, while the ratio of the ISOPHOT-S spectrum and the Spitzer/IRS spectrum obtained on 07-Mar-2006 provides a clear example where the flux variations above and below 9m anti-correlate, similarly to XX Cha. VY Tau, BF Ori, CR Cha, and Glass I are further examples for cases where certain spectral ratios show wavelength independent flux changes while others indicate changes only in the silicate feature or hints for anti-correlation between the continuum and the feature. This suggests that the trend of variability may not be a unique characteristic of a given source, but may change in time.
For 15 sources where two or more ISOPHOT-S spectra were available, we could also study variability in the 2.5–4.9m wavelength range. We found that five sources (UZ Tau, VY Tau, HD 97300, CV Cha, HD 135344 B) are constant between 2.5–4.9m. Out of these, UZ Tau, VY Tau, and CV Cha are slightly variable at longer wavelengths, while HD 98300 and HD 135344 B is constant throughout the whole 2.511.6m domain. The two variable PAH dominated objects in this sample (RR Tau and CU Cha) have larger flux changes at shorter wavelengths than at 5m (0.2–0.5 mag). A number of silicate emission objects show variability amplitudes comparable to those at longer wavelengths (DR Tau, Glass I, HD 104237, and EX Lup). One silicate emission object, however, displays anti-correlation between the shorter and longer wavelength regimes (CR Cha). This behavior is similar to what we observed for WW Cha and XX Cha at longer wavelength, except that the constant pivot point is at somewhat shorter wavelength. The three variable silicate absorption objects (Haro 6-10, HH 100 IRS, and OO Ser) display slightly higher variability amplitude in the 2–5m range than at longer wavelengths.
5 Discussion
In the previous sections we investigated the characteristics of variability for a sample of well-known YSOs. Based on the magnitude changes plotted in Figs. 4 and 5, out of 47 objects where multi-epoch observations were available, we found 37 stars (79%) to vary 0.1 mag and 20 stars (43%) to be variable at 0.3 mag level either in the continuum or the feature. Our results can be compared with those of earlier mid-infrared variability studies carried out on annual (typically 1–4 years) timescales. Barsony et al. (2005) surveyed the Oph cloud and found that at least 20% of the YSOs are variable at 10m on a few years timescale. Based on multi-epoch Spitzer/IRAC photometry, Luhman et al. (2010) reported that 44% of Class 0/I/II sources in the Taurus, and 26% in the Chamaeleon I star forming regions exhibit at least 0.05 mag flux changes. Recently, from the analysis of multi-epoch Spitzer/IRS spectra, Espaillat et al. (2011) concluded that 86% of the transitional and pre-transitional disks in the Taurus and Chamaeleon star forming regions display larger than 10% flux variability in the 5–38m wavelength range. Our results confirm the high incidence rates found in these studies and demonstrate that in our – rather heterogeneous – sample of young objects, annual/decadal mid-IR variability is ubiquitous.
Our data set also offers a possibility to explore the characteristic timescales of the processes responsible for the observed variability. These timescales could place constraints on the nature of the underlying physics. In Section 4.2 and Fig. 4 we statistically proved that the distribution of the variability amplitudes on annual and on decadal timescales do not differ significantly. This new result implies that on decadal timescales we observe the same variability process than on shorter timescales, and no extra long-term physical mechanism is evident from our data. This fact constrains the physical timescale of the variability to less than a few years. There are hints that this characteristic timescale may even be shorter. In our Spitzer/IRAC monitoring program (PID 60167, PI: P. Ábrahám), we obtained 14-day-long light curves at 3.6 and 4.5m of 38 selected low- and intermediate mass YSOs and found that practically all targets were variable with amplitudes from a few tens of millimagnitudes to 0.4 mag. Morales-Calderón et al. (2009) observed 69 YSOs in the IC 1396A dark globule between 3.6–8.0m with Spitzer/IRAC. The obtained 14-day-long light curves indicated that more than half of the observed YSOs show daily variations, with amplitudes ranging from 0.05 mag to 0.2 mag. Finally, the initial results of the Spitzer YSOVAR program (Rebull, 2011; Morales-Calderón et al., 2011), based on the analysis of 40-day-long light curves obtained for sources in the Orion Nebula Cluster and other well-known star-forming regions, indicate that 70% of the YSOs with IR excess are variable with days to weeks timescales and with amplitudes up to higher than 1 mag. These papers suggest that the incidence and the amplitude of flux changes we found on decadal timescale seem to be present already on the much shorter timescale of a few weeks. If confirmed, this result would strongly constrain the characteristic timescale of the physical variability process, possibly pointing to the innermost part of the system as the region of the true cause of variability.
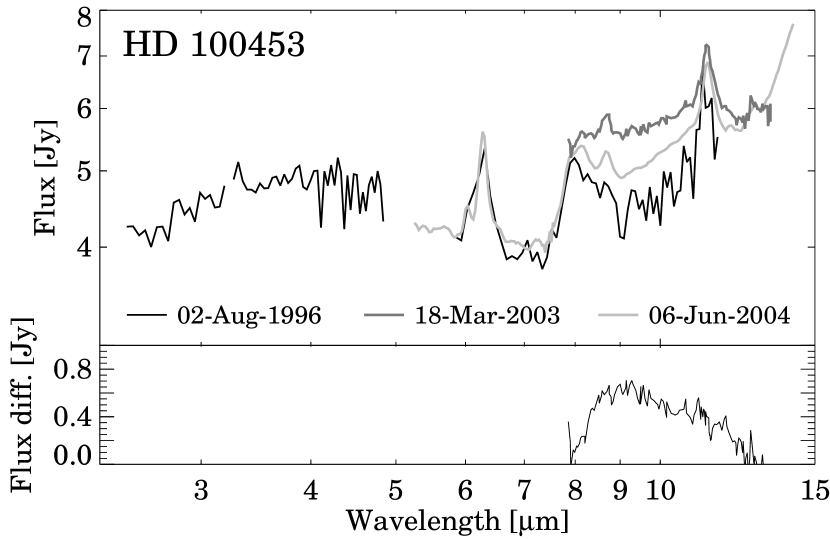
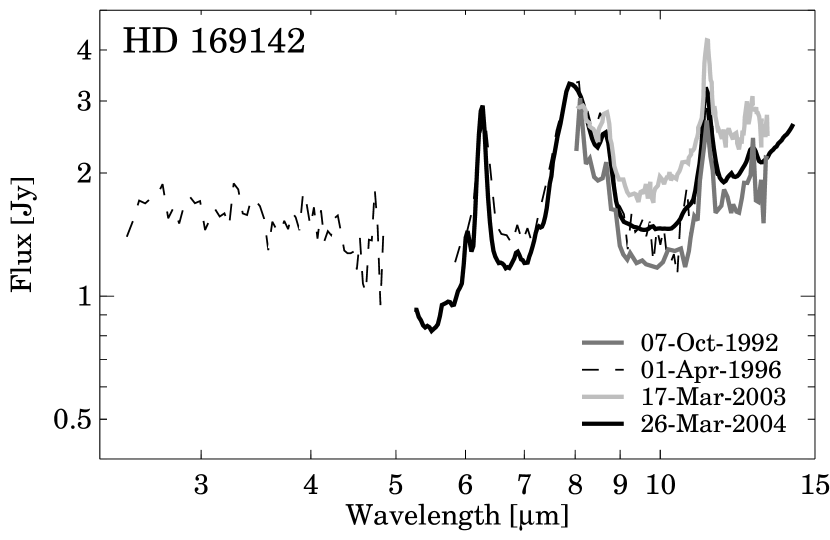
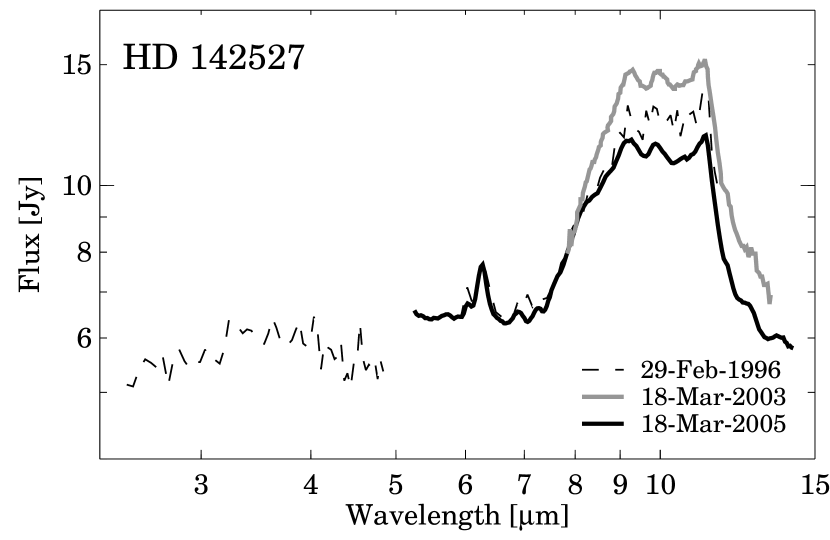
In order to examine flux changes, we integrated our spectra in relatively broad synthetic photometric bands. Consequently, the amplitude of variability within limited wavelength ranges can be even higher. Moreover, since our conclusions are based on the comparison of only two or three different spectra, the incidence numbers are lower limits, and the fraction of mid-IR variable stars may very well be larger. A dedicated mid-IR monitoring program would probably reveal variability for many of those objects that we observed to be constant. The amplitude of variability might also turn out to be larger if more epochs are taken into account. Examples are HD 169142 in Fig. 15, HD 104237 in Fig. 16 and HD 142527 in Fig. 17, where we plotted additional mid-infrared spectra from Sylvester et al. (1996) and van Boekel et al. (2005). Based on these results one might predict that a very high fraction of all low- and intermediate mass young stars are variable at a certain level in the mid-IR wavelength regime. Nevertheless, our data also revealed significant differences in the incidence of variability among objects with different SED types. As an example, Figures 4 and 5 clearly show that the fraction of variable stars is lower among the PAH-dominated objects than among the T Tauri stars. In the following we discuss the possible physical reason of variability for each object type separately.
5.1 PAH dominated objects
In our sample, sources whose spectra are dominated by PAH emission are all intermediate mass stars with spectral types ranging from B0 to F6, except the G0-type T Tauri multiple system HD 34700. This is in accordance with the observation that stars with spectral type later than G8 display no PAH emission (Geers et al., 2006; Furlan et al., 2006). The PAH emission, both spectral features and pseudo-continuum (Désert et al., 1990), originates from molecules transiently heated by the UV photons of the central source. These species can be located at relatively large distances from the star. Habart et al. (2004, 2006) resolved the PAH emission around several Herbig stars (e.g. HD 169142, CU Cha, HD 100453, and HD 100546) and found that PAH emission is originated from the illuminated surfaces of flared disks. The 3.3m feature is the least extended (30 AU), while the 6.2, 7.7, and 11.3m features are emitted by the outer disk region (100 AU). In other cases, the source of PAH emission is an even more extended envelope (e.g. HD 97300, Siebenmorgen et al. 1998; Kóspál et al. 2012), or might be coming from the surrounding cloud material (e.g. IRAS 03260+3111 and MWC 865, Sloan et al. 1999; Boersma et al. 2009).
When explaining the spectral variability of PAH dominated objects, one has to take into account that the spatial location of the regions emitting the mid-IR continuum may differ from that of the PAH emission. The bulk of the continuum emission at mid-IR wavelengths is radiated by warm, large dust grains in thermal equilibrium. Depending on the temperature and luminosity of the central star, these grains are confined to the inner disk, within a few AUs from the star, much closer than the source of the PAH emission. Our spectra do not exhibit any discernible silicate emission around 10m. In a few cases, the PAH emission is so strong that a weak silicate emission might be present but difficult to notice (IRAS 03260+3111, CU Cha, HD 97300, WL 16, MWC 865). In other cases, the underlying continuum can be clearly seen and the silicate emission is apparently absent (HD 34700, RR Tau, HD 100453, HD 135344 B, HD 141569, HD 169142, BD +40 4124, and LkHa 224, see also Juhász et al., 2010). The lack of the silicate emission feature suggests an unusually low density of submicron-sized silicate grains in the surface layer of the disk. One possible reason for this is that the small silicate grains settled to the midplane, do not receive any stellar irradiation, thus became too cold to emit at 10m (Meeus et al., 2002; Dullemond et al., 2007). Alternatively, it may also happen that the silicate grains are too large to emit at 10m due to grain growth (Collins et al., 2009).
Figs. 3 and 5 show that the observed flux changes, if there are any, are within 30% and are mostly wavelength-independent: similar for continuum and PAH band wavelengths. In seeking a physical explanation for the observed variability, first we investigate whether the flux changes could be caused by fluctuating obscuration along the line-of-sight. Such a model is motivated by the fact that one of our targets, RR Tau, is known to be UXor-type star. UXors, named after the prototype UX Ori, show several magnitude deep optical minima due to variable circumstellar obscuration along the line of sight in a nearly edge-on system (Eaton & Herbst, 1994). Theoretically, one could imagine that the observed mid-IR variability is caused by a “super-UXor” event when a circumstellar dust cloud obscures not only the star but the whole mid-IR emitting region. However, the observed magnitude of the mid-IR changes would require very large variations in the visual extinction (the extinction in the V band is 30 times that at 5m), which is not observed at optical wavelengths for our targets. Moreover, the continuum and in particular the PAH emission originate from a very extended circumstellar region (at least several AUs in size), which is unlikely to be completely obscured. Therefore, we conclude that the UXor-phenomenon cannot be the physical origin of the mid-IR variations in PAH dominated objects. Any variability seen in the mid-IR regime should reflect variability in the emission from PAH or dust particles due to the changing illumination from the central source.
Variable dust emission may occur when the stellar irradiation of the disk is modulated by time dependent shadowing effects. Changing the vertical structure of the inner disk can cast a shadow on a significant portion of the disk, decreasing its total stellar irradiation. However, this would only affect the continuum emitted by large grains and not the PAH emission. Since the PAH particles are strongly coupled to the gas and do not settle to the midplane, shadowing them is difficult, because the shadow should extend to a large solid angle (Dullemond et al., 2007).
The only remaining way to change the irradiation of the disk is by varying the stellar luminosity. Herbig stars often show modest optical variability (see long-term optical monitoring programs e.g. in Manfroid et al. 1991; Herbst & Shevchenko 1999), whose amplitude is similar to the mid-IR changes we observed for the PAH dominated objects (Fig. 4). In some cases the optical variability is due to line of sight effects (extinction, long-lived stellar spots), which cannot change the luminosity of the star, consequently the integrated mid-IR emission would stay constant. In a few cases, however, it is possible that the central luminosity actually changes, for instance due to variable accretion. Herbig stars are modest accretors: accretion rates from Br observations are below a few times 10-7 M⊙/yr. However, there are indications that in some sources (e.g. R CrA), the Br equivalent width is variable, pointing to variable accretion rate (Garcia Lopez et al., 2006). The fact that not all intermediate mass stars exhibit luminosity changes is consistent with our finding that mid-IR variability is not widespread among PAH dominated stars (three variables out of eight).
Our results suggest a circumstellar geometry where both the regions of PAH and continuum emission are directly illuminated by the central source. The most straightforward model to reproduce these results is a simple flared disk geometry. In this model, the PAH particles and the large dust grains in the disk surface layer react to the changing illumination almost instantaneously. Even the optically thick disk midplane would react on a few years timescale (Chiang & Goldreich, 1997), which is less than the temporal baseline of our variability survey. No opaque puffed-up inner rim is included in this model because no shadowing effects were revealed by our data. Note that our simple geometrical picture, deduced from the results of the variability measurements, is similar to the scheme proposed by Meeus et al. (2001) for their Group I sources of Herbig stars. The lack of small silicate grains high above the midplane of the disk, indicated by the weak or missing silicate emission feature, may help to keep clear the way for the stellar UV photons to reach the outer flared disk regions and excite the PAH molecules. In summary, varying illumination of a flared disk, possibly caused by variable accretion, is a promising idea to explain the mid-IR variability of PAH dominated objects.
5.2 Objects with silicate emission
The group of young stars exhibiting the 10m silicate feature in emission contains both low- and intermediate mass objects: 20 Herbig Ae/Be and 16 T Tauri stars belong here. Seven Herbig stars show PAH emission as well, but the PAH features do not dominate the spectrum (T Tauri stars show no PAH emission in our sample). It is unclear why PAH emission is weak or absent in our intermediate mass objects with silicate emission. The distribution of spectral types among PAH dominated and silicate emission Herbig stars are similar, thus the reason might be related to e.g. intrinsically low PAH abundance in the disk atmosphere; the destruction of PAHs in the disk atmosphere by strong UV flux; or shadowing or softening the stellar irradiation by the puffed-up inner rim (Keller et al., 2008). Taking into account that the PAH molecules are typically situated in the outer parts of a flared disk (Section 5.1), the last possibility invokes a modestly flared or flat disk geometry, similar to the scheme proposed by Meeus et al. (2001) for their Group II Herbig stars. The fact that in Fig. 5 there is no obvious difference in the distribution of data points of silicate emission Herbig stars with and without PAH emission suggests that variability studies of the silicate feature and continuum are not affected by the presence of PAH emission. This conclusion is supported by the flux ratios in Fig. 3 which suggest that, similarly to PAH dominated objects, for silicate emission Herbig stars the PAH features and the adjacent continuum show identical variability, thus magnitude changes in the 6–8m continuum and the 8–11.5m silicate feature domains are unaffected by the PAH features. Thus in the following we disregard the presence of PAH features in our silicate emission sources and concentrate on the 10m silicate feature only.
According to the standard picture of a two-layer passive disk (Chiang & Goldreich, 1997), the mid-IR continuum emission comes from warm dust grains both in the optically thick disk interior and in the superheated surface layer. The energy source is the central star, which illuminates the disk surface. In case of an actively accreting disk, there is an extra heating by the viscous energy released in the disk midplane, in the accretion columns, and in accretion hot spots on the stellar surface as well. The 10m silicate feature is thought to arise from the superheated silicate grains in the disk atmosphere. The radial extent of the disk atmosphere contributing to the mid-IR flux both in the continuum and in the 10m feature is within 10 AU for a low-mass star. The contribution of the disk interior is confined to within 1 AU. For intermediate mass stars, these dimensions are scaled up, an inner hole may be present, and the inner rim of the disk, directly illuminated by the star, may be puffed-up (Dullemond et al., 2001). The rim may cast a shadow on parts of the disk, strongly affecting the emitting area of the 10m silicate feature. Vinković et al. (2006) and Vinković & Jurkić (2007) argue that many low-luminosity YSOs (both T Tauri and Herbig stars) have compact (10 AU), optically thin, dusty halos around their inner disk regions. The dust temperature in the halo is set by the stellar heating. According to their modeling, the emission of the halo is dominant in the 2–5m regime, but it can also have important contribution at longer wavelengths. In certain cases (e.g. HD 163296), there are claims that the halo alone suffices to explain the observed 10m silicate feature (Vinković et al., 2006).
The distributions of low- and intermediate mass silicate emission stars in Fig. 5 is somewhat different from each other. Most of the Herbig stars show very little variability in the 68m continuum, while the 10m feature can vary as much as 0.6 mag (Fig. 5 upper right panel). On the other hand, T Tauri stars may vary also in the continuum (Fig. 5 lower left panel). The number of T Tauri stars exhibiting wavelength independent flux change (diagonal strip) and showing larger changes in the silicate feature than in the continuum is comparable. The different variability patterns of low- and intermediate mass stars may indicate a difference also in their circumstellar structure. Another possible factor which might affect the variability statistics is the age of the objects: most low-mass stars in our sample are located in young star-forming regions, while the intermediate mass sample includes also isolated, somewhat older, and thus less variable, stars.
First we discuss possible physical reasons for the wavelength independent flux changes. We will basically consider the same scenarios as for the variability of PAH dominated objects. Extinction of the mid-IR emitting region by a passing dust clump in the outer disk or envelope can be excluded because the accompanying optical flux changes would be unreasonably high (up to 20 mag). Wavelength independent flux changes can be the result of varying illumination by the central star, possibly caused by time variable accretion onto the stellar surface. This scenario predicts similar amplitude changes also at shorter wavelengths. In a few cases, it was possible to test this by comparing two ISOPHOT-S spectra over the whole 2.5–11.6m wavelength range. Indeed, we found approximately wavelength independent behavior, for DR Tau, Glass I, HD 104237, and EX Lup. Although simultaneous optical photometry does not exist, based on V-band light curves in the ASAS database (Pojmanski, 1997), the typical amplitude of the optical variability of these stars, which is often considered as a proxy for accretion variations, is similar to the observed 0.6 mag mid-IR variability.
For a surprisingly large number of our sources (including both T Tauri and Herbig stars), the 68m continuum is less variable than the 10m silicate feature. Similar phenomena were observed and reported already in the literature (Hutchinson et al., 1994; Sitko et al., 2008; Muzerolle et al., 2009; Bary et al., 2009). As we concluded in Section 4.1, the variation in the silicate emission is in all cases a change in the strength of the feature, and not a change in the spectral shape.
For Herbig stars, an obvious explanation for the observed flux changes is that the inner rim casts a shadow on parts of the disk. Using a very simple model, Dullemond et al. (2001) investigated the effect of increasing rim height and found that it can cause increasing continuum and decreasing 10m feature, i.e. an anti-correlation between shorter and longer mid-IR wavelengths. Juhász et al. (2007) performed a similar study using a radiative transfer code, and their model predicted a similar anti-correlation between 35m and 8m fluxes (although their target, SV Cep, displayed a constant 10m flux, making it necessary to introduce an inner envelope in the system). Sitko et al. (2008) proposed a slightly different model to explain mid-IR variability of the Herbig stars HD 31648 and HD 163296, suggesting structural changes in the gas disk close to or inside the dust sublimation zone. This gas disk may influence how much illumination reaches the inner rim from the central star. This model also predicts anti-correlation. Physical reasons for changes in the disk include thermal or magnetorotational instabilities and planetary perturbations.
In certain cases, inner dust rims may also exist for T Tauri stars (Muzerolle et al., 2003), and may play a role in the mid-IR variability. Such a picture was discussed for LRLL 31, a T Tauri star where Muzerolle et al. (2009) reported anti-correlation between shorter and longer mid-IR wavelengths, with a constant pivot point at 8.5m. They proposed that, similarly to Herbig stars, the height of the inner rim increases due to rising accretion luminosity, casting a shadow on the outer disk. Another scenario for LRLL 31 is that the shadowing is due to dynamical perturbations by a stellar or planetary companion. These perturbations may induce warps or spiral density waves in the inner disk, causing variable shadowing (Flaherty et al., 2011). CR Cha (anti-correlation between 5m and 8m), as well as WW Cha and XX Cha (anti-correlation between 68m and 8m) are promising candidates where one of these phenomena might take place. Note that spectral variability of CR Cha was also investigated by Espaillat et al. (2011) who found considerable change in the slope of the Spitzer/IRS spectra around 6m.
The high variability amplitudes of the silicate feature of T Tauri stars might also be explained in the framework of a recent model of turbulent disk accretion. Turner et al. (2010) and Hirose & Turner (2011) performed magnetohydrodynamical calculations of a stratified shearing box of the disk, and found that the magnetic activity intermittently lifts clouds of small grains into the disk atmosphere. The photosphere height changes by up to one-third over timescales of a few orbits, resulting also in changes of the mid-infrared surface brightness (see Fig. 18 in Turner et al. 2010). They also suggest that the changing shadows cast by the dust clouds on the outer disk are a cause of the daily to monthly mid-infrared variability found in many young stars. Since the dust clouds are optically thin, they may contribute primarily to the strength of the 10m silicate feature, while they affect less the continuum emission. In the model, significant variations in the 10m emission occur on the orbital timescale (Turner et al., 2010). In a typical T Tauri star, the disk area responsible for the bulk of the silicate emission is within the inner 1–2 AU, where the orbital period is less than a few years. Since our results on the variability also suggest timescales shorter than a few years (Section 4.2), the Turner et al. model may be consistent with our findings concerning the variability timescale of the silicate feature. In order to check whether this mechanism could also account for the amplitudes of the observed variations, we computed the predicted fluctuations in the following way. Hirose & Turner (2011) found that the starlight-absorbing surface moves up and down by a factor of two. The maximum possible 10m variability amplitude will occur if unit starlight optical depth is reached where the temperature is near the 300 K needed to place the peak reprocessed emission at 10m. Under these favorable conditions, the 10m flux could change by a factor two, or 0.75 mag, similar to the mid-IR flux changes we observe in our silicate emission sample. We note that the disk photosphere height changes almost simultaneously at all azimuthal locations in the disk annulus in question, because the differential rotation rapidly shears out any non-axisymmetric structure, implying significant changes in the emission of the system as a whole. Since the Turner et al. model predicts almost independent variability in the mid-infrared continuum and in the silicate feature, with higher amplitudes of the latter one, we suggest it as a promising explanation for our observations.
There might be other effects which change the silicate feature and the adjacent continuum. One possibility is that the system is binary or multiple with multiple disks. The silicate features in each component may be different, and one of them may be variable, resulting in changes in the combined spectrum. Another option is what is happening for DG Tau, a single T Tauri-type star: there is both emission and absorption along the line-of-sight, and one of them is changing (Bary et al., 2009). There is also a possibility that the 10m silicate feature and the continuum changes independently from each other. This might occur if the continuum emission is dominated by viscous heating and the emission feature is dominated by illumination of the disk surface. The accretion in the disk midplane and the accretion onto the stellar surface changes independently, or at least with significant time difference. Finally, the example of CoKu Tau/4 demonstrates that even for non-accreting sources, wavelength-dependent mid-IR variability can occur. This system consists of a close eccentric binary surrounded by a circumbinary disk. As the distance of the orbiting stars from the inner edge of the dust disk continuously changes in time, the irradiation and consequently the mid-IR emission of the inner disk wall also varies (Nagel et al., 2010). Unfortunately, the present dataset does not allow us to decide between these scenarios. Future multi-epoch simultaneous optical/near-IR/mid-IR observations, and detailed modeling of each source would be the key to conclusive results.
5.3 Objects with silicate/ice absorption
Stars with silicate and occasionally with ice absorption bands are all low-mass stars in our sample. The increasing SED and the absorption features indicate that these objects are deeply embedded in a cold, dense, extended envelope. The mid-IR emission is probably coming from a circumstellar disk as well as from the inner warm part of the envelope. The fact that they are mostly distributed along the diagonal stripe in Fig. 5 suggests scenarios that cause wavelength-independent flux changes. The short wavelength (5m) flux changes, where available, support this idea.
In accordance with this result, the concept of shadowing as discussed for disks is not applicable for envelopes. This is not surprising, since the envelope covers a large solid angle, thus the shadowing material within the inner edge of the envelope should cover a large solid angle. In principle, shadowing effects might occur in the disk, but these changes would be tempered by the backwarming of the outer disk by the surrounding envelope (Natta, 1993). Similarly to PAH dominated and silicate emission objects in the diagonal stripe, for silicate absorption objects, the most obvious explanation for the varying central luminosity is variable accretion rate. A good example for this is the well-studied triple system T Tau, where the Sa component is responsible for the 10m silicate absorption and for the mid-infrared variability. van Boekel et al. (2010) show that the short-term (daily-weekly) mid-infrared variability of T Tau Sa can be attributed to variable accretion, while the long-term (yearly) flux changes can be either due to variable accretion, variable foreground extinction, or the combination of these two mechanisms.
6 Summary and conclusions
In this paper we present low-resolution mid-IR spectra of 68 low- and intermediate mass young stars obtained with ISOPHOT-S between 1996 and 1998 and with Spitzer/IRS between 2004 and 2007. Utilizing self-developed software packages, we interactively re-processed the spectra for improved removal of instrumental artifacts. By comparing multi-epoch spectra of each object, we analyzed the statistics and the trends of mid-IR spectral variability and its implications on the geometry of the circumstellar material. Our study has three novel aspects: (1) the spectroscopic observations enable the study of spectral variations in a relatively extended mid-IR wavelength range; (2) instead of focusing on a certain star forming region, individual well-known YSOs were observed; (3) and the timescale of our ISO/Spitzer comparison is longer than previous mid-IR variability studies, covering a full decade. Our main achievements are the following:
-
•
The mid-infrared spectral atlas constructed for this project presents an improved, final data reduction of ISOPHOT-S spectra. The atlas contains all low- and intermediate mass stars ever observed with the ISOPHOT-S instrument, thus, it constitutes the legacy of the ISO.
-
•
Our spectra show that mid-IR variability among low- and intermediate mass YSOs is ubiquitous. We calculated synthetic photometry in the 6–8m and the 8–11.5m wavelength range, and found that 79% of the sources vary more than 0.1 mag, while 43% is variable above the 0.3 mag level. A comparison of the variability characteristics on annual and decadal timescales revealed no significant differences, constraining the physical timescale of the variability to less than a few years.
-
•
For intermediate mass stars with spectra dominated by PAH emission, we found relatively low incidence of variability. Flux changes in this group are mostly wavelength-independent, and can be interpreted in terms of non-steady irradiation of the disk due to fluctuating accretion. We propose a simple flared disk geometry to model these sources.
-
•
Intermediate mass stars exhibiting silicate emission at 10m often show higher variability amplitude in the silicate feature than in the adjacent continuum. Shadowing the disk by vertical variations of a puffed-up inner disk rim is invoked to explain the wavelength-dependence of the flux changes. The deduced geometry is a modestly flared or flat disk.
-
•
T Tauri stars are the most frequent variables in our sample. For those which exhibit more pronounced variability in the 10m silicate feature than in the continuum we propose to consider a new model: strong magnetohydrodynamical turbulence may intermittently lift clouds of small grains into the disk atmosphere resulting in extra silicate emission (Turner et al., 2010). Nevertheless, based on our spectra alone, we cannot exclude that other scenarios may also be applicable.
-
•
Sources exhibiting silicate or ice absorption are objects embedded in a dense envelope. They typically show wavelength independent flux changes, probably due to varying accretion rate.
Our results suggest that mid-IR variability is widespread among YSOs. Interpreting the amplitude, wavelength-dependence, and timescales of these flux changes is a new and promising possibility to explore the structure of the circumstellar disks and their dynamical processes.
Appendix A Interactive post-processing of ISO observations
Though the ISO Legacy Archive contains reliable results for most ISOPHOT-S observations, several instrumental artifacts were discovered after the closure of the Archive in 2001. We have developed an IDL-based processing package aiming at correcting these artifacts. Possible correction algorithms were tested and optimized on a set of 43 normal star measurements, and the same data set was used to estimate typical measurement uncertainties via comparison with photospheric models. The processing scheme consists of the following steps:
Deglitching.
As a preparation, we checked whether PIA had successfully removed all cosmic glitches from the data. Although the PIA built-in deglitching algorithms are quite efficient, we often experience that glitches are still present in observations of very faint sources, producing artificial spikes in the spectra. The reason is that at low signal level the recovery from a cosmic hit takes a relatively long time, and the disturbance following the hit may have a characteristic timescale comparable to the full measurement time (for an example see Fig. 6). In such a situation, the statistical algorithms of PIA – which assume that most of the data points are not affected by glitches – may not work properly. In order to identify the remaining glitches, the signal evolution of each pixel was visually inspected at the intermediate Signal Raw Data (SRD) processing level, and – if necessary – the affected data points were manually discarded using PIA.
Detector temperature.
It was suggested during the ISO mission that when the detector temperature was outside the nominal 2.8–3.1 K range, the transient behavior might have differed from the normal one, leading to systematic photometric errors (Acosta-Pulido & Ábrahám, 2003). We checked all observations presented here, and found that one measurement (HD 142666, TDT: 10402847) had non-nominal detector temperature. In the case of this measurement we computed for every pixel the dispersion of the calibrated flux values derived from the individual observing ramps by the dynamic calibration procedure. We checked whether the dispersion was higher in this affected measurement than in other data sets of similarly bright stars measured in the nominal temperature range. We indeed found a 2–3 increase in the noise, however, it is only 3–4% and 1–2% of the total measured flux in the ISOPHOT-SS and ISOPHOT-SL wavelength range, respectively. Thus, we conclude that non-nominal detector temperature is not a major source of uncertainty in the ISOPHOT-S observation of HD 142666, and we will neglect this effect in the processing.
Orbital phase.
It was suspected that observations obtained either at the very beginning (orbital phase ) or at the very end of the orbit (orbital phase ) might have suffered from reduced accuracy due to a higher dark current and to a higher cosmic glitch rate, respectively. In our sample, 9 measurements were taken during early, and 18 measurement during late orbital phase. In order to check if there is an increase of uncertainty related to the dark current subtraction at early orbital phases, we tested the distribution of dedicated dark current calibration measurements around a fitted curve that represents the orbital variation of the dark current per pixel, and found no higher scatter at early orbital phases (see also Fig. 1 in Acosta-Pulido & Ábrahám, 2003). This means that the subtraction of the orbital dependent dark signal does not introduce a higher noise component at early phases than later in the orbit. Close to the end of the science window of the orbit, the rate of cosmic glitches could somewhat rise, possibly making the data noisier than at earlier orbital phases. However, this noise is probably random in nature, and there is no reason to assume correlated behavior of groups of pixels. Since our analysis is based on synthetic photometry derived from the spectra, our results are unaffected by the increased noise at late orbital phase.
Signal memory from preceding observation.
We found the appearance of artificial spectral features in some spectra due to memory effects from a preceding observation of a bright source (Fig. 7). In order to identify affected spectra, we studied the short (32 s) dark measurements performed before each ISOPHOT-S observation. After reducing the complete sample of these measurements from the mission, we determined their average signal levels and typical measurement uncertainties per pixel (dashed and dotted lines in Fig. 8). If the measured short dark signal of a particular observation exceeded the average level by more than 1 for a continuous section of the spectrum (i.e. for a group of neighboring pixels, for an example, see Fig. 8), then the observation was flagged for memory effect.
From tests on cases where external information on the spectral shape (theoretical models, TIMMI2†††Thermal Infrared Multimode Instrument observations) was available, we concluded that subtracting the excess of the short dark signal from the astronomical observation per pixel can efficiently correct for the memory effect. In order to determine the accuracy of this correction, we analyzed the only standard star observation that was strongly affected by signal memory effect. We found that for pixels where the correction was below 50% of the measured signal, the uncertainty of the corrected signal remained below 8–10%, i.e less than the photometric uncertainty assigned to the measurements in the final step of our processing scheme. In the 50–100% memory excess range, the precision of the corrected fluxes was 20%, and even pixels suffering from very high memory contamination, in the range of 100–300%, could be corrected to have a standard deviation of 33%. In our sample, we performed memory correction on 19 observations of 17 different sources (marked with M in Column (7) of Table 1). In almost all cases the correction was in the 5–20% range, and the associated uncertainly was probably lower than the general photometric accuracy. The two more strongly affected cases (marked with M! in Table 1) are Ced 111 IRS 5 (TDT 62501412), and CK 2 (TDT 10803228). Out of these, the SL part of the spectra of Ced 111 IRS 5 could be used for variability studies, while CK 2 was discarded from our analysis.
Background subtraction.
For 61 observations out of the 94 ISOPHOT-S spectra presented here, no corresponding sky background measurement has been performed. In the wavelength range of ISOPHOT-S the dominant background component is the zodiacal light (apart from localized regions like HII regions, reflection nebulae, or the galactic plane). The zodiacal flux was clearly measurable for ISOPHOT-S in the 5.8–11.7 m regime (Leinert et al., 2002), and its contribution is not negligible for fainter stars (Fig. 9). We created a model which was able to predict the spectrum of the zodiacal background towards a given direction and on a given date. The algorithm used 4.9 and 12 m photometric points from COBE/DIRBE photometry as input, fitted a Planck curve to them, and finally scaled with a wavelength- and exposure time-dependent factor optimized for the 29 high quality ISOPHOT-S spectra of the zodiacal light presented in Leinert et al. (2002). Those 61 measurements where background was predicted in this way are marked with B in Column (7) of Table 1.
We also performed an error analysis of the correction by computing a predicted background spectrum for those 18 staring observations where a background measurement was available, and compare the two spectra pixel-by-pixel. The results demonstrated that the average error bar for the ISOPHOT-SS part is between 0.04 and 0.07 Jy, while for the ISOPHOT-SL domain is between 0.03 and 0.13 Jy, monotonically increasing towards longer wavelengths. For most of our targets, this additional uncertainty is well below the overall 10% precision of the ISOPHOT-S calibration. For the five faintest sources (among those where predicted background was subtracted), however, the uncertainty of the predicted background exceeds 10% of the measured flux. These cases are BARN 5 IRS 1, LDN 1551 IRS 5, Ced 111 IRS 5, [SVS76] Ser 4, and CK 2. For the first three objects, only the ISOPHOT-SS part is affected, while for the latter two, the whole ISOPHOT-S spectrum is uncertain. In Column 7 of Table 1 we mark six measurements of these five objects with an exclamation mark (B!). We conclude that variability can still be discussed for the first three objects using the ISOPHOT-SL part (and Spitzer when available), while for the two latter cases, variability study is not possible.
Special processing of spectral maps.
There are a few measurements which were performed in mapping mode (usually 1D scans). The target is usually situated on the central map position, and the neighboring raster steps can be used to obtain a background spectrum interpolated for the source’s position. The mapping mode has several advantages over the typical ON–OFF staring observations, because it provides a well-measured background, and the subtraction of the interpolated background automatically cancels any memory effect, thus the algorithm described above is not used here. It is a problem, however, that the dynamic response calibration method (Acosta-Pulido & Ábrahám, 2003) was developed for staring observations, and maps are standardly calibrated by means of a static spectral response function. This method, however, cannot cope with the different transient timescales of the different detector pixels, and may produce obvious spectral artifacts. In order to find an alternative solution, we tested a simple algorithm which considers the time sequence of the map as a long staring observation, applies Dynamic response calibration on it, and creates a map from the calibrated flux values. The results were in good agreement with the ISOPHOT photometry and lacked any obvious spectral artifacts. Raster observations of LDN 1489 IRS and OO Ser were processed using this algorithm.
Off-center position of the source in the beam.
The footprints of the ISOPHOT-S pixels were peaked rather than flat-top, therefore observing a compact source outside the optical axis of the pixel could change the measured signal. Since the calibration was set up for the pixel center, off-center observations have to be corrected in order to derive correct flux values. In addition, because the footprint profiles varied with wavelength (there were especially large jumps at 3.7 and 8.8 m) off-center position led to the appearance of spectral artifacts (an example is shown in Fig. 10). In order to correct the flux values and the spectral artifacts, we determined the offset of the source from the center by comparing the accurate position of the object with ISO’s coordinates. The 2-dimensional footprint map (we utilized the ones derived by Leinert et al. 2002) was then sampled at the offset position, and the measured flux was scaled with the ratio between footprint values at the center and at the offset location. This procedure was repeated for each detector pixel independently.
In order to estimate the uncertainty related to the correction, we derived error bars for each point of the footprint map by comparing those two original footprint measurements of the calibration star HR 7924 which were averaged to create the final footprint map. We found that in the majority of the measurements the estimated error was less than 5% of the total flux in the whole ISOPHOT-S wavelength range. Offset correction was applied to 66 ISOPHOT-S spectra of 50 different sources (marked with O in Column (7) of Table 1). There are only two seriously affected (%) data sets: the short wavelength part of one of the two spectra of WW Vul (TDT: 17600465) and the spectrum of MWC 863 (TDT: 28900460). Both measurements are flagged with an exclamation mark (O!) in Table 1, and are discarded from the variability analysis.
Empirical photometric correction.
In order to check for any remaining systematic effects in the final photometry, we queried the ISO Archive, collected all normal star observations, and reduced them in the way described above. Fig. 11 shows a typical result, where the measured spectrum is compared with the expected one. The latter spectrum was taken from the ISO calibration data base which includes a compilation of predicted spectra provided by M. Cohen or P. Hammersley (http://iso.esac.esa.int/users/expl_lib/ISO/wwwcal/). For those objects not included in the data base we took one of the available models of a star of identical spectral type, and scaled the values to the K-band magnitude of our object. In our sample of 43 observations of 28 normal stars, no excess due to hot circumstellar dust is expected (the sample also includes the calibrator stars).
In Fig. 12 we show the measured-to-predicted ratios of 3 representative pixels for the whole normal star sample. For each pixel, the ratios above a brightness threshold (usually 5 Jy) were averaged and their standard deviation was computed. For the faint stars (below 1 Jy), the ratio values became too noisy, and we computed the average and the standard deviation of differences between the measured and predicted fluxes. The averages derived this way represent the typical systematic errors. We decided to correct for these systematic offsets by dividing by the average flux ratio (for bright sources) or by subtracting the average flux difference (for faint sources) from all observations. This empirical photometric correction was the last step of our post-processing sequence.
Error budget.
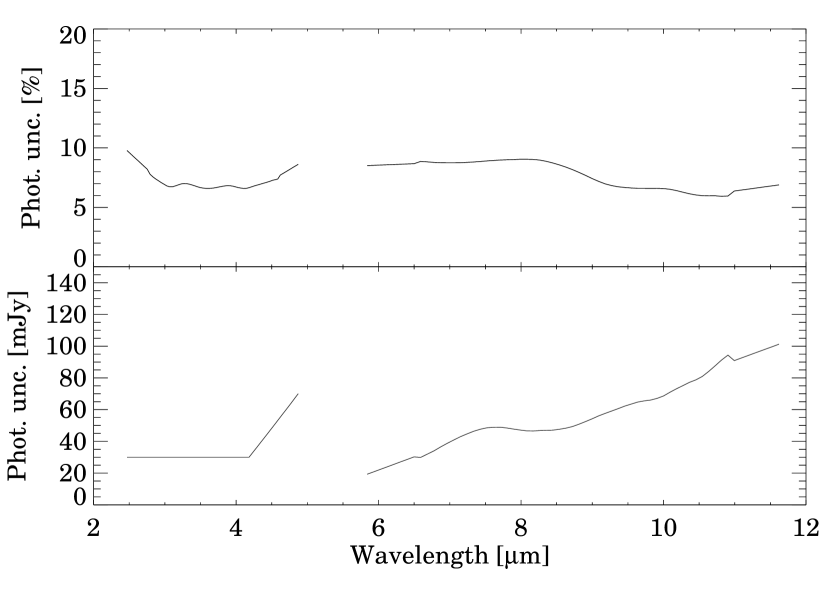
The formal uncertainties provided by the PIA reduction do not contain several important sources of uncertainties, e.g. the ones related to the corrections in the post-processing. The average uncertainties in Fig. 13, on the other hand, do not represent the quality differences among observations (e.g. the effect of a particularly energetic cosmic glitch). As final photometric uncertainties, we decided to adopt the maximum of the two types of error bars. In practice, for most pixels/measurements the average uncertainty values are the higher. Their typical values are 5–10% for bright sources, 30–100 mJy for faint sources.
Appendix B Notes on individual sources
In the following, we collected literature information on some of the sources, in order to help the reader with the understanding and the interpretation of the spectra plotted in Fig. 2. We mostly focused on three points: information on (1) variability in the optical-IR wavelength regime, (2) multiplicity, and (3) extended emission at optical-IR wavelengths. Single sources with no extended emission, and whose observations are unaffected by technical artifacts are not discussed here. Note that here we also included sources where variability could not be investigated.
IRAS 03260+3111
(also known as NGC 1333 SVS 3) is a young Herbig binary illuminating a small reflection nebula (Strom et al., 1976). The binary is composed of a B5 and an F2 star, with a separation of 362 (Straižys et al., 2002). The secondary is 32 times fainter than the primary in the K band and 24 times in the L band. (Haisch et al., 2004). The system appears extended with a fan-shaped nebulosity at 10m (Haisch et al., 2006). There is no evidence of emission from silicate grains in the mid-IR spectrum of IRAS 03260+3111. On the other hand, PAHs emission is observed not only at the position of the Herbig star, but also at various locations in the NGC 1333 nebula. The different PAH features change with changing distance from the central source due to the changing relative populations of ionized and neutral PAHs (Bregman et al., 1993; Roche et al., 1994; Joblin et al., 1996; Sloan et al., 1999). The MIR spectra published in these papers all have different flux levels, and they are also different from our ISOPHOT-S spectrum. These differences are due to the different beam sizes of the instruments and the exact pointing.
BARN 5 IRS 1
is a low-mass embedded young stellar object in the Barnard 5 dark cloud (Beichman et al., 1984). It is surrounded by a very faint reflection nebula detectable at near-infrared wavelengths (Moore & Emerson, 1992). We found no evidence in the literature for extended mid-infrared emission. JHKL photometric monitoring revealed that the source has faded significantly between 1983 and 1993 (Moore & Emerson, 1992, 1994). In the case of the ISOPHOT-S spectrum, predicted background was subtracted, making the short wavelength part more uncertain. However, the SED of the source rises steeply towards longer wavelengths, and the long-wavelength part of the ISOPHOT-S spectrum can be safely compared with the Spitzer/IRS spectrum.
LDN 1489 IRS
is a single embedded YSO (Connelley et al., 2008). The source looks extended in the 2MASS J, H, and K images, as well as in the 3.6m Spitzer/IRAC image. Although it is point-like in the IRAC images at 5.8m, we cannot exclude the possibility of extended emission, which may be the reason for the slight difference between the ISOPHOT-S and the Spitzer/IRS flux levels. Thus, this source is not included in the discussion about variability.
T Tau
is a triple system consisting of T Tau N, T Tau Sa, and T Tau Sb. The largest separation between the components is 07 (Köhler et al., 2008), therefore neither ISO nor Spitzer resolves the system: the observed flux represents the sum of all components. T Tau Sa is a Herbig star, while T Tau Sb and T Tau N are low-mass objects (Duchêne et al., 2006). Skemer et al. (2008) presented photometry at 8.7, 10.55, and 11.86m for each of the three components, while Ratzka et al. (2009) show 8–13m spectra for T Tau S and T Tau N. Based on these results, it seems that only T Tau Sa displays silicate absorption, while T Tau N and T Tau Sb have more-or-less featureless 10m spectra (T Tau N may display slight emission). Beck et al. (2004) resolve T Tau N and T Tau S in the 2–4m range, and claim that T Tau S shows deep, broad H2O ice absorption at 3.1m, while T Tau N is featureless in this wavelength range. Photometric monitoring between 2 and 12m by Beck et al. (2004) and by van Boekel et al. (2010) indicate that T Tau N is constant within the uncertainties, while T Tau S shows significant variability.
DG Tau
is a single classical T Tauri star (Leinert et al., 1991; Connelley et al., 2008). Wooden et al. (2000) report on multi-epoch mid-IR spectra where they found that the 10m silicate feature showed significant variability on time scales of months to years, while the underlying continuum remained relatively constant. They claim that prior to 1996, DG Tau had a featureless 10m spectrum, which then turned into silicate emission, then went into absorption at the end of 1998. Bary et al. (2009) also observed that the silicate feature displayed variability on monthly and yearly timescales. All our ISOPHOT-S and Spitzer spectra are featureless, but they indicate that the continuum is variable.
Haro 6-10
(also known as GV Tau) is a T Tauri binary with a separation of 12, P.A. 355∘ (Leinert & Haas, 1989). Both the ISO and the Spitzer spectra contain the full flux from both components (the Spitzer slit is oriented along the binary). At wavelengths shorter than 4m, the southern component dominates, while most of the emission above 4m comes from the extremely red northern component (Leinert & Haas, 1989). Leinert et al. (2001a) reported J, H, K, L′, and M-band variability, as well as the variation of the 3.1m ice-band absorption. Their resolved observations prove that both components vary significantly on timescales of a few months. Our ISO and Spitzer spectra confirm that the system is variable.
LDN 1551 IRS 5
is a deeply embedded low-mass triple system consisting of a binary with projected separation of 03, and a third component at a distance of 009 of the northern component (Lim & Takakuwa, 2006), each star harboring a small circumstellar disk. The whole system is surrounded by a circumbinary disk and a flattened envelope as well (Osorio et al., 2003). Liu et al. (1996) observed the source at 12m, and by comparing the observed flux with previous 12m and N-band photometry, reported significant mid-IR variability. Although LDN 1551 IRS 5 displays some extended emission at all Spitzer/IRAC images, the larger aperture ISO spectrum has a lower flux than the Spitzer spectrum, indicating real variability. We note that in the case of the ISOPHOT-S spectrum, predicted background was subtracted. The flux of LDN 1551 IRS 5 steeply rises towards longer wavelengths, but below 5m, the source is so faint that the uncertainty of the background subtraction dominates the error budget, and the overall error is above 10%.
HL Tau
is a single classical T Tauri star. At optical wavelengths, the object is a compact reflection nebula with complicated morphology and diameter of 3′′; no point source is visible (Stapelfeldt et al., 1995). In the JHK images of Murakawa et al. (2008), the central source can be seen, but it is still surrounded by extended nebulosity (about 3′′ in extension). According to our knowledge, there is no information on the literature on whether the source is extended at mid-IR wavelengths. The fact that the larger aperture ISO spectrum has a lower flux level than the Spitzer spectrum indicate real variability. The 8–13m UKIRT/CGS3 spectrum obtained in 1993 by Bowey & Adamson (2001) is consistent with the ISOPHOT-S brightness level.
UZ Tau
is a hierarchical quadruple T Tauri system. UZ Tau E is a spectroscopic binary with an orbital period of 19.1 days. At a distance of 38 can be found UZ Tau W, which itself is a 034 binary (Prato et al., 2002, and references therein). Due to periodic accretion from the circumbinary disk, UZ Tau E shows optical variability of about 0.4–1.0 mag in the V, R, and I bands, while UZ Tau W is constant within 0.02 mag (Jensen et al., 2007; Kóspál et al., 2011). UZ Tau E is also variable at millimeter wavelengths, possibly related to non-thermal emission from magnetospheric reconnection events above the binary components’ photospheres (Kóspál et al., 2011). The Spitzer/IRS slit was centered on UZ Tau E, although the W component also has some contribution to the observed flux. The ISOPHOT-S measurements were centered between the E and W components, and essentially measured the sum of the two components’ fluxes. For this reason, the Spitzer/IRS and ISOPHOT-S spectra cannot be compared, but variability can be studied by comparing the two ISOPHOT-S spectra, which indicate some flux changes in the silicate feature around 10m.
VY Tau
is a subarcsecond binary with a separation of 066, P.A. of 317∘, K-band flux ratio of 3.8, and L-band flux ratio of 6.1 (Leinert et al., 1993; McCabe et al., 2006). Richichi et al. (1994) note that the K-band brightness ratio of the two stars is time-variable. VY Tau is an EXor-type object, exhibiting sporadic 1-4 mag optical outbursts, but has been in quiescence at V13.8 mag since about 1972 (Herbig, 1977, 1990; Herbst et al., 1994). The source shows photospheric emission in the JHK bands (Shiba et al., 1993; Sipos et al., 2011), but displays clear excess emission from about 3m and a clear 10m silicate emission feature (Furlan et al., 2006; Sargent et al., 2009; Watson et al., 2009; Sipos et al., 2011). We found no indication in the literature for extended IR emission. Both the ISO and the Spitzer spectra contain the full flux from the binary components, thus they can be compared.
DR Tau
is a highly accreting single classical T Tauri star with a long history of optical and near-IR photometric and spectroscopic variability, which point to magnetospheric accretion with fluctuating accretion rate (e.g. Götz, 1980; Isobe et al., 1988; Hessman & Guenther, 1997; Smith et al., 1999; Alencar et al., 2001). Kenyon et al. (1994) present light curves from the B to the L band, and explain the observed flux variations with the presence of a hot spot (the base of the accretion flow) on the stellar surface. DR Tau is sometimes classified as an EXor, a young star exhibiting short accretion outbursts (Lorenzetti et al., 2009). Our observations indicate that DR Tau is also variable in the whole 2.5–15m wavelength range.
HD 34700
is a quadruple T Tauri system. The primary itself is a double-line spectroscopic binary (HD 34700 Aa and HD 34700 Ab), consisting of two equal-mass G0-type stars (Arellano Ferro & Giridhar, 2003; Torres, 2004). Two faint stars at a distance of 52 (HD 34700 B, spectral type: M1-2, classical T Tauri) and 92 (HD 34700 C, spectral type: M3-4, weak-line T Tauri) are also associated with HD 34700 A (Sterzik et al., 2005). The IRS slit only includes the spectroscopic binary HD 34700 A, while the ISOPHOT-S aperture includes all four components. Although HD 34700 B seems to be actively accreting, due to their faintness and distance from component A, components B and C have negligible contribution to the ISOPHOT-S flux. Thus, both instruments essentially measure HD 34700 A.
RR Tau
is a Herbig Ae star. Grinin et al. (2002) observed a deep optical and near-IR minimum in the light curve of RR Tau in 2000–2001. They found that the UBVRIJH fluxes showed synchronous behavior, and the color changes indicated that the dimming was caused by a circumstellar dust cloud crossing the line of sight. However, the fading in the optical and JH bands were accompanied with a flux increase in the K and L band, suggesting that flux changes at longer wavelength have a different physical mechanism than variable extinction.
Reipurth 50 N IRS 1.
Reipurth 50 was first reported as a nebulous object by Reipurth (1985). Reipurth & Bally (1986) reported the sudden appearance of a highly variable, conical nebula Reipurth 50 N, possibly due to an FU Ori-like eruption. Scarrott & Wolstencroft (1988) identified Reipurth 50 N IRS 1 (a.k.a. HBC 494) as the illuminating source of the Reipurth 50 N reflection nebula. Near-IR imaging, imaging polarimetry, and CVF spectroscopy by Casali (1991) revealed that there is only one single source in the Reipurth 50 N cloud, IRS 1, which is a point source at 3.6m.
SX Cha
is a T Tauri-type binary with a separation of 22, and P.A. of 288∘ (Reipurth & Zinnecker, 1993). The east and west components have spectral types of M0.5 and M3.5, respectively (Muzerolle et al., 2005a). The 2MASS images show that while the west component is brighter in the J band, the east component is brighter in the K band. The Spitzer slit is centered on the east component, and the west component is 12-16 away from the slit centerline. This means that 55-70% of the flux of the west component is also included in the Spitzer measurement. The ISOPHOT-S data, however, contains the total flux of both components. Thus, due to beam confusion, the spectra of the two instruments cannot be directly compared.
HD 95881
is a Herbig Ae star. Based on spectro-astrometric observations, Baines et al. (2006) consider it a possible subarcsecond binary. We found no indication in the literature for extended emission at any wavelength, thus the ISOPHOT-S and Spitzer spectra can be safely compared. The two spectra agree within the measurement uncertainties until about 10m. Between 10 and 11.5m, the ISOPHOT-S spectrum is higher than the Spitzer at a 1 level. The TIMMI2 spectrum published by van Boekel et al. (2005) is even higher than the ISOPHOT-S, indicating possible variability.
CT Cha
is a single T Tauri-type star (Guenther et al., 2007). Recently, Schmidt et al. (2008) found a candidate sub-stellar companion (brown dwarf or planet) by direct imaging, at a projected separation of 267. Since the companion is very faint (K-band flux ratio is 313), it does not affect our spectra, and the ISOPHOT-S and Spitzer/IRS data can be safely compared.
VW Cha
is a triple system. The separation of the A and B components is 066, P.A. 177∘, and their K-band flux ratio is 25.6. The separation of the B and C components is 010, P.A. 233∘, and their K-band flux ratio is 1.34 (Brandeker et al., 2001). There is also an even fainter, fourth component at a distance of 16.78′′ from VW Cha A (Correia et al., 2006). Both our ISO and Spitzer spectra contain the flux from the three brightest components (A, B, and C).
CU Cha
(also known as HD 97048) is a single Herbig star with spectral type of B9.5/A0 (Ghez et al., 1997; Bailey, 1998; Doucet et al., 2007). Based on ISOCAM-CVF data, Siebenmorgen et al. (2000) found that the emission of CU Cha in the PAH bands is extended on scales of about 5-10′′. According to Doucet et al. (2007), this emission comes from transiently heated PAH molecules in an extended envelope around the star-disk system. Lagage et al. (2006) claimed that CU Cha is extended in the 8.6m PAH band, and the brightness profile is well reproduced by emission from the surface layer of a vertically optically thick, inclined, flared disk, extending at least up to 370 AU (or 21). Doucet et al. (2007) found that the object is also extended in the 11.3m PAH band, while van Boekel et al. (2004) could resolve the disk also at continuum wavelengths. While the differences between the ISOPHOT-S and Spitzer/IRS spectra might be due to the different beam sizes, the fact that the three ISOPHOT-S spectra differ by 20-40% points to real variability. Long-term optical monitoring indicates that the amplitude of optical variability of CU Cha is 0.1-0.3 mag (Manfroid et al., 1991; Herbst & Shevchenko, 1999),
Glass I
is a T Tauri-type binary with a separation of 2.67′′, P.A. of 285∘, and K-band flux ratio of 5.9 (Haisch et al., 2004). It is also known as Ced 111 IRS 4 or Cha I T33. The primary is brighter in the optical, but it is a “naked” T Tauri; most of the IR emission comes from the deeply embedded Class I secondary (Feigelson & Kriss, 1989; Prusti et al., 1991). Gürtler et al. (1999) already reported strong mid-IR variability based on two ISO spectra. The Spitzer slit in 2006 was positioned halfway between the two stars, but the slit and the P.A. of the binary is misaligned, leading to some flux loss. We do not attempt to correct for this effect. The slit in 2008 was positioned exactly on the secondary component, which dominates the IR emission. Our variability study for this source is based on the ISOPHOT-S spectra, which contain the total flux of both components.
Ced 111 IRS 5
is a single T Tauri-type star (Haisch et al., 2004). It is extended on an arcminute scale, even at the 8m IRAC image. It is also called Chamaeleon IR nebula. This explains the difference between the ISO and Spitzer spectrum. However, variability can be studied by comparing the long-wavelength parts of the two ISOPHOT-S spectra, which have nearly identical pointings and are not strongly affected by memory effects or uncertainties related to the subtraction of the predicted background.
HD 97300
is a B9-type binary Herbig star (Siebenmorgen et al., 1998). In the HR diagram, it is located close to the ZAMS, and it has no significant IR excess below 24m (Kóspál et al., 2012). The separation of the binary components is 08, and their K-band flux ratio is 17 (Ghez et al., 1997; Lafrenière et al., 2008). Siebenmorgen et al. (1998) noticed that at certain IR wavelengths, two emission peaks can be seen, one coinciding with HD 97300, one being at a distance of about 3′′. They also detected an extended, ring-like structure, whose spectrum is dominated by PAH emission. The size of the ring is about 5033′′. It is not centered on the star, and is probably made of interstellar matter, whose density is enhanced by the interaction of the stellar wind from HD 97300 with the environment (see also Kóspál et al., 2012). The PAH molecules in the ring are transiently heated by HD 97300. This extended emission explains the factor of 3-4 difference we detect between the ISOPHOT-S and IRS spectra (the ISOCAM-CVF spectrum published by Siebenmorgen et al. 2000, representing the total flux of the system, is another factor of 2 higher than the ISOPHOT-S spectrum). The good agreement between the two ISOPHOT-S spectra indicates that the emission of the central source, and consequently that of the PAH molecules heated by it, is constant in time. Indeed, long-term optical and near-IR photometric monitoring indicates that the brightness of HD 97300 is constant within 0.1-0.2 mag (Manfroid et al., 1991; Davies et al., 1990).
Ced 112 IRS 4
(also known as FM Cha) is a single T Tauri-type star with no indication of extended near-IR or mid-IR emission in its immediate vicinity (Haisch et al., 2004, 2006). Alexander et al. (2003) presented an ISOCAM-CVF spectrum of the source and noticed that no ice absorption features are present, while the 10m region indicate the combination of silicate emission and absorption. Since our ISOPHOT-S and Spitzer/IRS spectra are consistent with this finding, we decided not to assign any type to this source. All the ISOCAM-CVF, ISOPHOT-S, and Spitzer spectra indicate significant flux changes and changes in the spectral slope.
WX Cha
is a T Tauri-type binary with a separation of 079 and P.A. of 55∘ (Ghez et al., 1997). Both the ISO and Spitzer spectra contain all the flux from both components, thus, they can be safely compared.
CV Cha
is a single T Tauri-type star (Guenther et al., 2007; Melo, 2003), although it shows variable radial velocity (Reipurth et al., 2002). The Spitzer/IRS slit contained only CV Cha, while the ISOPHOT-S beam included also CW Cha (at a separation of 11′′). Resolved IRAC photometry from Luhman et al. (2008) indicates that the flux ratio of CW Cha to CV Cha is 0.12-0.16 between 3.6 and 8m. This, and the fact that CW Cha falls at the very edge of the ISOPHOT-S beam ensures that CW Cha has negligible contribution to the ISOPHOT-S spectrum. Thus, we conclude that both the ISOPHOT-S and the Spitzer/IRS spectra represent the flux from CV Cha only, thus they can be compared.
HD 98800
(also known as TV Crt) is a quadruple T Tauri system. It consists of a binary with a projected separation of 08 (or 38 AU), P.A. 0∘, and each component is a spectroscopic binary with a separation of about 1 AU (Prato et al., 2001; Boden et al., 2005). Both the ISO aperture and the IRS slit contain all four objects, so they can be compared. The IR excess is attributed to HD 98800 B (Prato et al., 2001). HD 98800 B displays no excess emission below about 5.5m, indicating an inner cleared-out region (Furlan et al., 2007).
HD 100453
is an isolated binary Herbig star. The primary has a spectral type of A9 Ve. The companion, HD 100453 B, is situated at a separation of 106 (or 120 AU), and is 110 times fainter in the Ks band than the primary (Habart et al., 2006). The companion is a M4.0–M4.5V star with no significant excess in the K or L band (Collins et al., 2009), thus it has no contribution to the plotted ISOPHOT-S or Spitzer/IRS spectra. Meeus et al. (2002) explain the lack of the 10m silicate feature with the depletion of small, hot silicate grains in the disk of HD 100453 (a factor of 100-500 depletion compared to AB Aur is needed in their model to be able to consistent with the observed ISO-SWS spectrum). Using higher signal-to-noise ratio TIMMI2 data, van Boekel et al. (2005) confirmed the lack of the 10m silicate emission, and attributed it to grain growth. The comparison of our ISOPHOT-S and IRS spectra reveal some differences in the 8–12m wavelength range, while the flux at m is constant. It is possible that this variability is due to a weak, variable silicate emission feature (Fig. 14). Confirmation of this idea would require a detailed modeling of the IRS spectrum, which has the highest signal-to-noise ratio among the 10m spectra published so far for HD 100453. The star shows no strong accretion activity and is photometrically stable (Collins et al., 2009; Garcia Lopez et al., 2006; Guimarães et al., 2006).
HD 104237
is a spectroscopic binary consisting of a Herbig A4V primary and a K3-type companion (Böhm et al., 2004). Based on X-ray observations, Testa et al. (2008) identified four more low-mass stars in the vicinity, HD 104237 B-E, with separations between 1365 and 1488, while Grady et al. (2004) found five low-mass sources in their optical, near-IR and mid-IR images. In addition to the Herbig Ae star itself, HD 104237-6 (corresponding to the X-ray source HD 104237 E) and HD 104237-2 have IR excesses, but the Herbig star HD 104237 dominates the mid-IR integrated light of the region (Grady et al., 2004). While HD 104237-6 falls outside of both the ISOPHOT-S beam and the Spitzer/IRS slit, HD 104237-2 is included in both. The Spitzer slit is centered between the Herbig star and HD 104237-2. Offset correction was applied using the position of the Herbig star. Although the observed Spitzer/IRS spectrum may contain 75-100% of the flux of HD 104237-2, its contribution to the much brighter primary is negligible, thus we conclude that the ISOPHOT-S and Spitzer/IRS spectra can be compared. Nevertheless, the ISOPHOT-S spectra alone already shows significant variability (see also Fig. 16).
DK Cha
is a deeply embedded active Herbig Ae star. It displays brightness variations of more than 1 mag in the K band (Hughes et al., 1991). The source is redder when fainter, and the amplitude of the brightness fluctuations decreases with increasing wavelength. They explain the observed flux changes with a combination of variable circumstellar extinction and intrinsic variability. Prusti et al. (1994) found no evidence for extended mid-IR emission (with multi-diaphragm observations between 3.8 and 18.6m, meaning that the emitting area is less than 5.4′′). We note that there is a significant discrepancy between the ISOPHOT-S (this work) and the ISO-SWS (Acke & van den Ancker, 2004) spectra of the source, pointing to possible variability. The Spitzer data points are close to saturation and are not very reliable.
HD 135344 B
is an F4 Ve-type Herbig star (van Boekel et al., 2005). Doucet et al. (2006) resolved the source at 20.5m, and modeled the emission with a disk with an outer radius of 200 AU (or 14, which is within both the ISOPHOT-S and the Spitzer/IRS aperture). Grady et al. (2009) observed significant changes between 1–10m, both in flux and in the shape of the SED. At wavelengths shortward of 4.75m, at least 13% variations are present, while at 10m, they found 60% variability.
HD 139614
is an Herbig Ae star (Dunkin et al., 1997). Yudin et al. (1999) detected polarimetric variability on a time-scale of days, which they explain in terms of a model of a pole-on disk with dust clouds or comet-like bodies moving in a circumstellar envelope around the star. We found no evidence in the literature that the source might be extended at mid-IR wavelengths, thus we conclude that the ISOPHOT-S and the Spitzer spectra can be safely compared. The two spectra agree within the measurement uncertainties, moreover, the TIMMI2 spectrum of van Boekel et al. (2005) is also identical with them. Thus, HD 139614 is constant at mid-IR wavelengths (nor does it show any significant variability in the optical, see Meeus et al. 1998).
HD 141569
is a B9.5/A0 Herbig star (Jaschek & Jaschek, 1992; Dunkin et al., 1997). Coronagraphic observations of the scattered light by Augereau et al. (1999), Weinberger et al. (1999), and Mouillet et al. (2001) revealed that its disk is asymmetric, and consists of two rings with a gap between them. Weinberger et al. (2000) claims that the disk is composed of secondary debris material, although it still contains some gas (Zuckerman et al., 1995). HD 141569 has two M-type companions: HD 141569 B (M2V) and HD 141569 C (M4V) at projected distances of 76 (A-B) and 14 (B-C); K-band flux ratios are: 5.3 (A/B) and 11.9 (A/C) (Pirzkal et al., 1997; Weinberger et al., 2000). The Spitzer/IRS slit included only the primary (A), while the ISOPHOT-S aperture included all three components. Due to their faintness and distance from component A, components B and C have negligible contribution to the ISOPHOT-S flux, thus the ISOPHOT-S and Spitzer/IRS fluxes can be compared.
HD 142666
is a Herbig Ae star (van Boekel et al., 2005). Mid-IR spectra of HD 142666 obtained with different instruments are published in Sylvester et al. (1997); Bouwman et al. (2001), and van Boekel et al. (2005). HD 142666 displays large photometric variations (Malfait et al. 1998 give a visual amplitude of about 1.2 mag, while Lecavelier Des Etangs et al. 2005 detected 0.3 mag variability with Stromgren photometry). The star appears redder when fainter, which they interpret as variable dust extinction in a close to edge-on disk with clumpy dust distribution. Since beam effects do not play a role here, we can safely compare the ISOPHOT-S and Spitzer spectra.
HD 142527
is an isolated Fe-type Herbig star (van Boekel et al., 2005, and references therein). Based on spectro-astrometric observations, Baines et al. (2006) consider it a possible subarcsecond binary. The circumstellar environment of the star was resolved at various wavelengths (see e.g. near-IR images in Fukagawa et al. 2006, mid-IR images in Fujiwara et al. 2006, or millimeter images in Verhoeff et al. 2011). Based on these observations, the star is surrounded by an inner disk, an outer disk, and a halo around the inner disk regions. Spatially resolved 18m images in Fujiwara et al. (2006) and in Verhoeff et al. (2011) indicate that the emission is coming from within about 1′′ of the star, which is fully included in both the ISOPHOT-S beam and the Spitzer/IRS slit. Thus, the spectra can be compared, and they indicate significant variability. An additional 8–13m spectrum from van Boekel et al. (2005) also confirms this (Fig. 17).
EX Lup
is the prototype of EXors, a class of young stars showing sporadic optical outburst separated by extended quiescent periods (Herbig, 1977). The outbursts are powered by enhanced accretion from the circumstellar disk onto the star (Herbig et al., 2001). EX Lup itself brightened by 5 mag in 1955-56 and again in 2008, and produced several smaller, 1–3 mag brightenings in-between. EX Lup was extensively studied during its outburst in 2008, and the observations indicate that it brightened in the whole 0.4–100m wavelength range (Juhász et al., 2012). By comparing pre-outburst and outburst Spitzer spectra, Ábrahám et al. (2009) observed a significant change in the shape of the 10m silicate feature: while before the outburst, the feature indicated mostly amorphous silicates, during outburst, several narrow peaks and shoulders appeared, indicating the presence of crystalline silicates. Ábrahám et al. (2009) explain the appearance of the crystalline silicates by annealing in the surface layer of the inner disk by heat from the outburst. In Fig. 2, we plot ISOPHOT-S spectra from 1997 and Spitzer spectra from 2004 and 2005. These are all quiescent spectra, when the visual magnitude of EX Lup was between 12.5 mag and 14 mag.
HD 144432
is a pre-main sequence binary consisting of HD 144432 A, an A9/F0-type Herbig star primary and HD 144432 B, a K0-5-type T Tauri secondary, with a separation of 1.4′′, P.A. 0∘ (Pérez et al., 2004; Stelzer et al., 2009; Fukagawa et al., 2010). The secondary is a factor of 9-14 fainter than the primary in the K and H bands (Pérez et al., 2004; Fukagawa et al., 2010). The secondary displays photospheric emission until K band, and the IR excess is attributed exclusively to the primary (Pérez et al., 2004). Both the ISOPHOT-S aperture and the Spitzer/IRS slit include both components and the observed spectra represent the total flux of the two objects (the Spitzer slit is oriented along the binary, north-south). Keck segment-tilting observations by Monnier et al. (2009) resolved the source at 10.7m, which is 40 mas. There is a 10% difference between the ISOPHOT-S and the Spitzer/IRS spectra plotted in Fig. 2. Several other mid-IR spectra are available on HD 144432 in the literature, see e.g. Sylvester et al. (1996); Leinert et al. (2004); van Boekel et al. (2005). The first of these is consistent with the Spitzer/IRS flux level, the second one is consistent with the ISOPHOT-S flux level, and the third one is lower than the others by another 10%, supporting our finding that the source is variable in the mid-IR regime.
HR 5999
is a binary star consisting of a Herbig Ae primary, and a T Tauri secondary called Rossiter 3930 (Rossiter, 1955). The separation is 14, the P.A. is 111∘, and the K-band flux ratio is between 20-35 (Stecklum et al., 1995; Ghez et al., 1997; Leinert et al., 1997). The primary itself may be a spectroscopic binary (Tjin A Djie et al., 1989), although observations by Corporon & Lagrange (1999) do not confirm this. HR 5999 is a known optical variable, whose “bursts” are attributed to unsteady accretion (Perez et al., 1992). Multi-epoch BVRIJHKLMNQ band photometry by Hutchinson et al. (1994) indicated that the object is indeed variable at optical wavelengths but not much above 4.8m. An ISOCAM CVF spectrum published in Acke & van den Ancker (2004) is consistent with our ISOPHOT-S spectrum until 8.5m, but is lower by about 20% at longer wavelengths, indicating a possibly variable silicate feature. Siebenmorgen et al. (2000) noted that HR 5999 is a point source at these wavelengths. Using VLTI/MIDI, Preibisch et al. (2006) resolved the mid-IR emission from HR 5999 and they give sizes between 5 and 25 mas (1-5 AU), depending on the fitted model.
WL 16
is a single B8-A7 Herbig star (Simon et al., 1995; Ratzka et al., 2005; Luhman & Rieke, 1999). Images at different mid-IR wavelengths between 7.9 and 24.5m (both in the continuum and in the PAH bands) published by Ressler & Barsony (2003) revealed that the central star is surrounded by a bright disk with a size of 735 (corresponding to a disk diameter of 900 AU), viewed at an inclination of 62.2°. Geers et al. (2007) also resolve both the 8–13m continuum and the 8.6, 11.2, and 12.7m PAH features, but give smaller radial extents (50-60 AU, or 04-05) than Ressler & Barsony (2003). In their study, the 3.3m feature is undetected, indicating the dominance of ionized PAHs. Our ISOPHOT-S spectrum of WL 16 in Fig. 1 agrees well with the ISO-SWS spectrum, and the slight differences between these and the 10m spectrum published in Hanner et al. (1992) are probably due to the different beam sizes of the instruments.
MWC 863
is a pre-main sequence binary, consisting of a Herbig Ae primary, HD 150193 A, and an F9-type T Tauri secondary, HD 150193 B (Carmona et al., 2007). Their separation is 11, the P.A. is 227∘ (Reipurth & Zinnecker, 1993), flux ratios are 6-8 and 4-17 in the K and L′ bands, respectively (Zinnecker et al., 1991; Koresko, 2002). The secondary component has no IR excess (Fukagawa et al., 2003, and references therein). Using coronagraphic images, Fukagawa et al. (2003) resolved the disk around HD 150193 A in the H band, and gave a radius of 13 (190 AU). During Keck segment-tilting observations by Monnier et al. (2009) the source remained unresolved at 10.7m, which gives an upper limit of FWHM=35 mas for the emitting region. We note that while the ISO-SWS spectrum published in Acke & van den Ancker (2004) is identical with out ISOPHOT-S spectrum, the UKIRT/CGS3 spectrum taken by Sylvester & Mannings (2000) is significantly different both in shape an in flux level, pointing to possible changes in the composition and size distribution of the silicate dust grains.
AK Sco
is a double-line spectroscopic binary consisting of approximately equal mass F5-type stars with a projected separation of 0.14 AU (1 mas); the two stars are surrounded by a circumbinary disk (Alencar et al., 2003). Both the ISO and Spitzer spectra include both components. Its optical light curve shows a “roughly constant maximum light level being interrupted at irregular intervals by minima about a magnitude deep” (Andersen et al., 1989). Our ISOPHOT-S and Spitzer/IRS spectra agree within the measurement uncertainties, and a TIMMI2 spectrum by Przygodda et al. (2003) also has the same flux level.
MWC 865
(also known as V921 Sco and CD4211721) is a B0IV-type star embedded in a small, thick dark cloud (Boersma et al. 2009 and references therein). It illuminates a reflection nebula (van den Bergh & Herbst, 1975). Its distance is quite uncertain (values between 400 and 2500 pc appear in the literature, e.g. Boersma et al. 2009; Lopes et al. 1992), and there is also some debate about its pre-main sequence nature (Borges Fernandes et al., 2007), although it is generally considered to be a Herbig Be star. Habart et al. (2003) found four IR companions within 13′′ of MWC 865, while Wang & Looney (2007) found about 10 YSO candidates in the vicinity (within about 70′′) of MWC 865 using Spitzer/IRAC images. Boersma et al. (2009) shows Spitzer/IRAC images between 3.6 and 8.0m and TIMMI2 images at 11.9m of MWC 865 and its surroundings. These images reveal two bright peaks, one coinciding with the star, the other one being a close-by patch 43 to the north. There is an arc stretching towards the south-east as well, at a distance of 11′′ from the star. TIMMI2 long-slit spectra indicate that the central star has a featureless spectrum, while the close-by patch and the arc display strong PAH emission. Boersma et al. (2009) combine the spectra of these components and compare it with an ISO-SWS spectrum. They find that the ISO-SWS spectrum shows a similar shape, but has higher flux levels due to the larger aperture of ISO-SWS and the extent of the PAH emission. Our ISOPHOT-S spectrum of MWC 865 also has a very similar shape to the ISO-SWS spectrum, but even higher flux levels. We conclude that these differences are also due to the difference in the apertures and their exact position with respect to the PAH-emitting patches. We note that significant offset correction was applied to the ISOPHOT-S spectrum of MWC 865, introducing extra uncertainty in the absolute flux levels.
51 Oph
is a single Herbig star (Baines et al., 2006), which is photometrically constant (Lecavelier Des Etangs et al., 2005). The source appeared point-like in the 18m images of Jayawardhana et al. (2001), giving an upper limit of 05 (65 AU) for the radius of the emitting region. Leinert et al. (2004) resolved the source at 12.5m with VLTI/MIDI and gave a half-light radius of 7 mas (0.5 AU). Our conclusion is that the ISOPHOT-S and the Spitzer/IRS spectra can be compared and the observed variability is real. We note that ground-based mid-IR spectra published in Sylvester et al. (1996) and Leinert et al. (2004) are consistent with the Spitzer/IRS flux level.
HD 163296
is a well-known single (Corporon & Lagrange, 1999; Pirzkal et al., 1997) Herbig Ae star. Using optical and near-IR coronagraphic images, Fukagawa et al. (2010) and Grady et al. (2000) could detect the disk in scattered light out to a radius of 36 (440 AU). Wisniewski et al. (2008) found that the optical scattered light is variable in time due to variable self-shadowing. During Keck segment-tilting observations by Monnier et al. (2009) the source remained unresolved at 10.7m, which gives an upper limit of FWHM=35 mas for the emitting region. Doucet et al. (2006) resolved the disk thermal emission at 20.5m and derived an outer disk radius of 16 (200 AU). The source was resolved by Leinert et al. (2004) using VLTI/MIDI data, and the half-light radius at 12.5m is 7 mas (0.8 AU). The source appeared point-like in the 18m images of Jayawardhana et al. (2001), giving an upper limit of 05 (60 AU) for the radius of the emitting region. Sitko et al. (2008) conducted a long-term 313m spectroscopic monitoring of HD 163296. Most of their data are consistent with no variability larger than 10%, except at one epoch when the 15m flux significantly increased, accompanied by a slight increase in the flux of the 10m silicate feature. Although no Spitzer/IRS low resolution spectra are available for this source, our ISOPHOT-S spectrum is consistent with an ISO-SWS spectrum (taken on the same day), and also consistent with the TIMMI2 spectrum published in van Boekel et al. (2005), obtained in March 2003, and the MIDI spectrum published in Leinert et al. (2004), obtained in June 2003, while it is 10-40% higher than that obtained by Kessler-Silacci et al. (2005) with the Keck/LWS in August 1999 and in June 2000.
HD 169142
is a Herbig Ae star (Sylvester et al., 1996). High spatial resolution mid-IR observations at 3.3, 10.8, and 18.2m show that the emission comes from a disk with an outer radius of 150 AU (1′′) at most (Habart et al., 2006; Jayawardhana et al., 2001). SED modeling gave disk radii in the range of 100-300 AU (07-2′′) (Dominik et al., 2003; Dent et al., 2006). HD 169142 has a possible companion, 2MASS J182429292946559, located at a distance of 93 (Grady et al., 2007). The 2MASS source is a binary weak-line T Tauri with 130 mas separation, and is 11 times fainter than HD 169142 in the K band. The Spitzer/IRS slit contains only HD 169142, while the ISOPHOT-S beam includes both components. However, the contribution of the 2MASS source at mid-IR wavelengths is probably negligible, thus the Spitzer and the ISO spectra can be compared. The spectra plotted in Fig. 1 agree within the measurement uncertainties, thus we conclude that this source is constant in the 5-11.5m regime. The flux levels of the UKIRT/CGS3 spectrum from Sylvester et al. (1996) and the TIMMI2 spectrum from van Boekel et al. (2005) also agree with our spectra until 9m, while they differ by up to 50% above 9m (Fig. 15). The source is photometrically stable at optical wavelengths (Guimarães et al., 2006).
VV Ser
is a single (Pirzkal et al., 1997; Leinert et al., 1997) Herbig star. It displays UXor-type optical variability (Herbst & Shevchenko, 1999; Rostopchina et al., 2001), i.e. 1-3 mag deep minima in the V band due to variable obscuration by dust clumps in a nearly edge-on circumstellar disk. Habart et al. (2003) found no other source emitting at 10m in the 11′ vicinity of VV Ser. Li et al. (1994) found no extended emission around the source in JHK filters, while Leinert et al. (2001b) found faint extended emission with a FWHM of 0.6′′ in JHK with speckle interferometry. Eisner et al. (2004) resolved the source at 2.2m with the PTI, and determined a size of 1.5-4.5 mas (depending on the model used) for the emitting region. Pontoppidan et al. (2007) discovered nebulous mid-IR emission extending over 4′ centered on VV Ser. The nebulosity is due to transiently heated dust grains. Although we cannot exclude the possibility that this extended emission has different contributions to the ISOPHOT-S and the Spitzer/IRS spectra, the fact that the Spitzer/IRS flux level is higher points to real variability.
OO Ser
is a deeply embedded YSO that produced an outburst in 1995 and became 4.6 mag brighter in the K band (Hodapp et al., 1996), reaching its maximum brightness in 1995 October (Hodapp, 1999). The eruption caused brightening at a wide wavelength range from 2.2m to 100m (Kóspál et al., 2007). After peak brightness the object started a gradual fading. The ISOPHOT-S spectra plotted in Fig. 2 cover a period of 20 months, and the first one was obtained 4 months after the maximum brightness occurred. The gradual fading, which is discussed in detail in Kóspál et al. (2007), is well visible in the figure. The source is surrounded by a small elongated nebula, approximately 15′′ in diameter, best seen in the K band, but also discernible at 3.6, 4.5 and 5.8m (Hodapp et al., 1996; Kóspál et al., 2007).
CK 1
is an embedded protostellar binary with a separation of 15, and P.A. of 10∘ (Eiroa & Leinert, 1987). The southern component is brighter than the northern one, and their flux ratio decreases from 4.2 at 0.9m to 3.3 at 3.5m to 1.1-2.8 between 8–12.9m (Eiroa et al., 1987; Eiroa & Leinert, 1987; Ciardi et al., 2005). Both the ISO and the Spitzer spectra represent the sum of the spectra of CK 1 north and CK 1 south (the Spitzer slit is oriented along the separation of the binary), thus, they can be compared. Ciardi et al. (2005) present resolved 8–13m spectra of the two components, and the sum of the two spectra as well. This sum agrees very well with our ISOPHOT-S and Spitzer/IRS data.
[SVS76] Ser 4
is a small, dense cluster of deeply embedded low- and intermediate mass YSOs (Pontoppidan et al., 2004). Judging from the JHK photometry of Eiroa & Casali (1989) and the Spitzer 3.6–24.0m fluxes from Harvey et al. (2007), most of the flux in the Spitzer slit comes from SVS4/9 and SVS4/10, while in addition to these two sources, SVS4/4, SVS4/8, SVS4/11 and SVS4/5 also contribute to the ISO flux. SVS4/5 is especially bright above 5m (very red source). Source confusion explains the differences between the ISO and Spitzer spectra. We note that in the case of the ISOPHOT-S spectrum, predicted background was subtracted, making the absolute level of the measured flux probably more uncertain than 10%.
CK 2
is an embedded YSO in the Serpens star-forming region. We found no indication of extended mid-IR emission in the literature. The source is close to the sensitivity limit of ISOPHOT-S, resulting in a very low signal-to-noise, especially above 6m. The ISOPHOT-S spectrum also suffers from memory effect, and a predicted background is subtracted, which, considering how faint the source is, introduces additional uncertainties. Thus, we do not analyze the variability of CK 2. Nevertheless, the ISOCAM CVF spectrum of Alexander et al. (2003) is significantly lower than our Spitzer/IRS spectrum, indicating possible variability.
S CrA
is a PMS binary with a separation of 13–15, P.A of 147∘–160∘, K-band flux ratio of 1.9–2.7, and L-band flux ratio of 2.5 (Baier et al., 1985; Zinnecker et al., 1991; Chelli et al., 1995; Prato et al., 2003). Carmona et al. (2007) obtained spatially resolved optical spectra for the two components and determined a spectral type of G5 Ve for the primary (S CrA NW) and K5Ve for the secondary (S CrA SE). S CrA is a well-known optical variable, with V-band variations of up to 2 mag (e.g. Kardopolov & Filipev, 1981). (Graham, 1992) interpreted the photometric and spectroscopic changes of the object as variable accretion onto the star. Both the ISOPHOT-S aperture and the Spitzer/IRS slit included the whole flux of both components, thus, they can be compared.
R CrA, T CrA, and HH 100 IRS
are part of Coronet, a small cluster of YSOs. The two brightest sources, R CrA and T CrA, are Herbig stars, while the remaining dozen (HH 100 IRS among others) are deeply embedded low-mass protostars (Forbrich et al., 2007, and references therein). R CrA illuminates the reflection nebula NGC 6729. Both R CrA and the nebula are highly variable at optical wavelengths (Graham & Phillips, 1987). HH 100 IRS is also highly variable, with amplitudes up to 2.5 mag in the K band (Axon et al., 1982; Reipurth & Wamsteker, 1983). Both R CrA and T CrA are possible spectro-astrometric binaries (Takami et al., 2003). Using speckle interferometry, Dewarf & Dyck (1993) found that R CrA is unresolved at 2.2 and 3.8m. Prusti et al. (1994) found no evidence for extended mid-IR emission larger than 5′′ around R CrA and T CrA. Interestingly R CrA displays the 4.27m feature of solid CO2 ice in absorption and the 10m silicate feature in emission at the same time (Nummelin et al., 2001; Acke & van den Ancker, 2004). No Spitzer spectra are available for R CrA and T CrA, but the comparison of our ISOPHOT-S spectra in Fig. 2 and the ISO-SWS spectra published in Acke & van den Ancker (2004) indicate very similar flux levels. For HH 100 IRS, variability can be studied by comparing the two ISOPHOT-S spectra.
VV CrA
is a T Tauri-type binary with a separation of 210, P.A. of 44∘, and K-band flux ratio of 8.6. The optical secondary becomes brighter around the J band, and dominates the flux at longer wavelengths (Chelli et al., 1995). Ratzka et al. (2008) report that the secondary faded significantly and “it is now fainter than the primary even in the N-band”. They also show 10m MIDI spectra for each component: VV CrA NE shows deep silicate absorption, while VV CrA SW is featureless. Our ISO spectrum contains flux from both components, while the Spitzer/IRS spectrum in centered on the NE component, but contains significant contribution from the SW as well. For this reason, we do not analyze variability for this source.
WW Vul
is an isolated Herbig Ae star, which shows UXor-like fadings at optical wavelengths, although its disk probably has a larger inclination than for other UXors (Pugach, 2004; Kozlova et al., 2006). WW Vul was observed twice with ISOPHOT-S and once with Spitzer. Both ISOPHOT-S spectra are offset-corrected, but the large correction applied for the earlier one (TDT: 17600465) makes this more uncertain than the 10% assigned as a final uncertainty of the ISOPHOT-S spectra. For this reason, this spectrum in not used in our variability analysis, and we base our conclusions on the comparison of the other ISOPHOT-S spectrum (TDT: 51300108) and the Spitzer measurement.
BD +40 4124 and LkHa 224
are members of a cluster of young stars (Henning et al., 1998, and references therein). The brightest members of the cluster are the B2-type BD +40 4124 and the B5-type LkHa 224, but several fainter FGKM stars can be found within a few arcminutes; some of these are included in the ISOPHOT-S aperture. No Spitzer spectrum is obtained for these sources, however an ISO-SWS is available. Comparison of our ISOPHOT-S spectrum with the ISO-SWS reveals no significant differences. BD +40 4124 displays small-scale (0.4 mag) quasi-periodic variability at optical wavelengths (Herbst & Shevchenko, 1999; Strom et al., 1972).
PV Cep
is an embedded YSO surrounded by the cometary reflection nebula RNO 125 (Thé et al., 1994). Both the star and the nebula are strongly variable (e.g. Scarrott et al., 1991; Lorenzetti et al., 2011). Kun et al. (2011) analyzed the brightness changes of PV Cep in the whole optical–infrared regime, and found significant flux variations below 10m. They conclude that the reason for the variability is a combination of changing accretion rate and changing circumstellar extinction. We found no indication in the literature that the object is extended at mid-IR wavelengths. The fact that the Spitzer spectrum has a higher flux than the ISOPHOT-S points to real variability.
SV Cep
is spectro-astrometric binary Herbig star (Wheelwright et al., 2010). Its optical light curve is characteristic of UXor-type variables with irregular, quasi-periodic variations due to inhomogeneities in a nearly edge-on circumstellar disk (e.g. Rostopchina et al., 2000). Juhász et al. (2007) investigated the long-term 0.55–100m variability of SV Cep and found a correlation between the optical and far-IR light curves. In the mid-IR regime, they found lower variability amplitudes (a peak-to-peak variability of 40% at 10m) and a hint for anti-correlation with the optical changes. They interpret the variability using a self-shadowed disk and a puffed-up inner rim with variable inner rim height. Their model also contained an optically thin envelope to account for the constant 25m flux. Our ISOPHOT-S spectrum plotted in Fig. 2 and the ISO-SWS spectrum obtained 9 months previously (Acke & van den Ancker, 2004) are consistent with each other.
References
- Ábrahám et al. (2004) Ábrahám, P., Kóspál, Á., Csizmadia, S., Kun, M., Moór, A., & Prusti, T. 2004, A&A, 428, 89
- Ábrahám et al. (2009) Ábrahám, P., et al. 2009, Nature, 459, 224
- Acke & van den Ancker (2004) Acke, B., & van den Ancker, M. E. 2004, A&A, 426, 151
- Acosta-Pulido & Ábrahám (2003) Acosta-Pulido, J. A., & Ábrahám, P. 2003, in ESA Special Publication, Vol. 481, The Calibration Legacy of the ISO Mission, ed. L. Metcalfe, A. Salama, S. B. Peschke, & M. F. Kessler, 95
- Alencar et al. (2001) Alencar, S. H. P., Johns-Krull, C. M., & Basri, G. 2001, AJ, 122, 3335
- Alencar et al. (2003) Alencar, S. H. P., Melo, C. H. F., Dullemond, C. P., Andersen, J., Batalha, C., Vaz, L. P. R., & Mathieu, R. D. 2003, A&A, 409, 1037
- Alexander et al. (2003) Alexander, R. D., Casali, M. M., André, P., Persi, P., & Eiroa, C. 2003, A&A, 401, 613
- Andersen et al. (1989) Andersen, J., Lindgren, H., Hazen, M. L., & Mayor, M. 1989, A&A, 219, 142
- Arellano Ferro & Giridhar (2003) Arellano Ferro, A., & Giridhar, S. 2003, A&A, 408, L29
- Augereau et al. (1999) Augereau, J. C., Lagrange, A. M., Mouillet, D., & Ménard, F. 1999, A&A, 350, L51
- Axon et al. (1982) Axon, D. J., Allen, D. A., Bailey, J., Hough, J. H., Ward, M. J., & Jameson, R. F. 1982, MNRAS, 200, 239
- Baier et al. (1985) Baier, G., Keller, E., Weigelt, G., Bastian, U., & Mundt, R. 1985, A&A, 153, 278
- Bailey (1998) Bailey, J. 1998, MNRAS, 301, 161
- Baines et al. (2006) Baines, D., Oudmaijer, R. D., Porter, J. M., & Pozzo, M. 2006, MNRAS, 367, 737
- Barsony et al. (2005) Barsony, M., Ressler, M. E., & Marsh, K. A. 2005, ApJ, 630, 381
- Bary et al. (2009) Bary, J. S., Leisenring, J. M., & Skrutskie, M. F. 2009, ApJ, 706, L168
- Beck et al. (2004) Beck, T. L., Schaefer, G. H., Simon, M., Prato, L., Stoesz, J. A., & Howell, R. R. 2004, ApJ, 614, 235
- Beichman et al. (1984) Beichman, C. A., et al. 1984, ApJ, 278, L45
- Boden et al. (2005) Boden, A. F., et al. 2005, ApJ, 635, 442
- Boersma et al. (2009) Boersma, C., Peeters, E., Martín-Hernández, N. L., van der Wolk, G., Verhoeff, A. P., Tielens, A. G. G. M., Waters, L. B. F. M., & Pel, J. W. 2009, A&A, 502, 175
- Böhm et al. (2004) Böhm, T., Catala, C., Balona, L., & Carter, B. 2004, A&A, 427, 907
- Bontemps et al. (2001) Bontemps, S., et al. 2001, A&A, 372, 173
- Borges Fernandes et al. (2007) Borges Fernandes, M., Kraus, M., Lorenz Martins, S., & de Araújo, F. X. 2007, MNRAS, 377, 1343
- Bouwman et al. (2001) Bouwman, J., Meeus, G., de Koter, A., Hony, S., Dominik, C., & Waters, L. B. F. M. 2001, A&A, 375, 950
- Bowey & Adamson (2001) Bowey, J. E., & Adamson, A. J. 2001, MNRAS, 320, 131
- Brandeker et al. (2001) Brandeker, A., Liseau, R., Artymowicz, P., & Jayawardhana, R. 2001, ApJ, 561, L199
- Bregman et al. (1993) Bregman, J., Rank, D., Sandford, S. A., & Temi, P. 1993, ApJ, 410, 668
- Brinch et al. (2007) Brinch, C., Crapsi, A., Hogerheijde, M. R., & Jørgensen, J. K. 2007, A&A, 461, 1037
- Carmona et al. (2007) Carmona, A., van den Ancker, M. E., & Henning, T. 2007, A&A, 464, 687
- Casali (1991) Casali, M. M. 1991, MNRAS, 248, 229
- Chelli et al. (1995) Chelli, A., Cruz-Gonzalez, I., & Reipurth, B. 1995, A&AS, 114, 135
- Chiang & Goldreich (1997) Chiang, E. I., & Goldreich, P. 1997, ApJ, 490, 368
- Ciardi et al. (2005) Ciardi, D. R., Telesco, C. M., Packham, C., Gómez Martin, C., Radomski, J. T., De Buizer, J. M., Phillips, C. J., & Harker, D. E. 2005, ApJ, 629, 897
- Cohen (2003) Cohen, M. 2003, in ESA Special Publication, Vol. 481, The Calibration Legacy of the ISO Mission, ed. L. Metcalfe, A. Salama, S. B. Peschke, & M. F. Kessler, 135
- Collins et al. (2009) Collins, K. A., et al. 2009, ApJ, 697, 557
- Connelley et al. (2008) Connelley, M. S., Reipurth, B., & Tokunaga, A. T. 2008, AJ, 135, 2496
- Corporon & Lagrange (1999) Corporon, P., & Lagrange, A. 1999, A&AS, 136, 429
- Correia et al. (2006) Correia, S., Zinnecker, H., Ratzka, T., & Sterzik, M. F. 2006, A&A, 459, 909
- Cutri et al. (2003) Cutri, R. M., et al. 2003, VizieR Online Data Catalog, 2246, 0
- Davies et al. (1990) Davies, J. K., Evans, A., Bode, M. F., & Whittet, D. C. B. 1990, MNRAS, 247, 517
- Decin et al. (2004) Decin, L., Morris, P. W., Appleton, P. N., Charmandaris, V., Armus, L., & Houck, J. R. 2004, ApJS, 154, 408
- Dent et al. (2006) Dent, W. R. F., Torrelles, J. M., Osorio, M., Calvet, N., & Anglada, G. 2006, MNRAS, 365, 1283
- Désert et al. (1990) Désert, F., Boulanger, F., & Puget, J. L. 1990, A&A, 237, 215
- Dewarf & Dyck (1993) Dewarf, L. E., & Dyck, H. M. 1993, AJ, 105, 2211
- Dominik et al. (2003) Dominik, C., Dullemond, C. P., Waters, L. B. F. M., & Walch, S. 2003, A&A, 398, 607
- Doucet et al. (2007) Doucet, C., Habart, E., Pantin, E., Dullemond, C., Lagage, P. O., Pinte, C., Duchêne, G., & Ménard, F. 2007, A&A, 470, 625
- Doucet et al. (2006) Doucet, C., Pantin, E., Lagage, P. O., & Dullemond, C. P. 2006, A&A, 460, 117
- Duchêne et al. (2006) Duchêne, G., Beust, H., Adjali, F., Konopacky, Q. M., & Ghez, A. M. 2006, A&A, 457, L9
- Dullemond et al. (2001) Dullemond, C. P., Dominik, C., & Natta, A. 2001, ApJ, 560, 957
- Dullemond et al. (2007) Dullemond, C. P., Henning, T., Visser, R., Geers, V. C., van Dishoeck, E. F., & Pontoppidan, K. M. 2007, A&A, 473, 457
- Dunkin et al. (1997) Dunkin, S. K., Barlow, M. J., & Ryan, S. G. 1997, MNRAS, 290, 165
- Eaton & Herbst (1994) Eaton, N. L., & Herbst, W. 1994, in Bulletin of the American Astronomical Society, Vol. 26, American Astronomical Society Meeting Abstracts #184, 933
- Eiroa & Casali (1989) Eiroa, C., & Casali, M. M. 1989, A&A, 223, L17
- Eiroa & Leinert (1987) Eiroa, C., & Leinert, C. 1987, A&A, 188, 46
- Eiroa et al. (1987) Eiroa, C., Lenzen, R., Leinert, C., & Hodapp, K. 1987, A&A, 179, 171
- Eisner et al. (2004) Eisner, J. A., Lane, B. F., Hillenbrand, L. A., Akeson, R. L., & Sargent, A. I. 2004, ApJ, 613, 1049
- Espaillat et al. (2011) Espaillat, C., Furlan, E., D’Alessio, P., Sargent, B., Nagel, E., Calvet, N., Watson, D. M., & Muzerolle, J. 2011, ApJ, 728, 49
- Feigelson & Kriss (1989) Feigelson, E. D., & Kriss, G. A. 1989, ApJ, 338, 262
- Flaherty et al. (2011) Flaherty, K. M., Muzerolle, J., Rieke, G., Gutermuth, R., Balog, Z., Herbst, W., Megeath, S. T., & Kun, M. 2011, ApJ, 732, 83
- Forbrich et al. (2007) Forbrich, J., et al. 2007, A&A, 464, 1003
- Fujiwara et al. (2006) Fujiwara, H., et al. 2006, ApJ, 644, L133
- Fukagawa et al. (2003) Fukagawa, M., Tamura, M., Itoh, Y., Hayashi, S. S., & Oasa, Y. 2003, ApJ, 590, L49
- Fukagawa et al. (2006) Fukagawa, M., Tamura, M., Itoh, Y., Kudo, T., Imaeda, Y., Oasa, Y., Hayashi, S. S., & Hayashi, M. 2006, ApJ, 636, L153
- Fukagawa et al. (2010) Fukagawa, M., et al. 2010, PASJ, 62, 347
- Furlan et al. (2006) Furlan, E., et al. 2006, ApJS, 165, 568
- Furlan et al. (2007) —. 2007, ApJ, 664, 1176
- Gabriel et al. (1997) Gabriel, C., Acosta-Pulido, J., Heinrichsen, I., Morris, H., & Tai, W. 1997, in Astronomical Society of the Pacific Conference Series, Vol. 125, Astronomical Data Analysis Software and Systems VI, ed. G. Hunt & H. Payne, 108–111
- Garcia Lopez et al. (2006) Garcia Lopez, R., Natta, A., Testi, L., & Habart, E. 2006, A&A, 459, 837
- Geers et al. (2007) Geers, V. C., van Dishoeck, E. F., Visser, R., Pontoppidan, K. M., Augereau, J., Habart, E., & Lagrange, A. M. 2007, A&A, 476, 279
- Geers et al. (2006) Geers, V. C., et al. 2006, A&A, 459, 545
- Ghez et al. (1997) Ghez, A. M., McCarthy, D. W., Patience, J. L., & Beck, T. L. 1997, ApJ, 481, 378
- Götz (1980) Götz, W. 1980, Information Bulletin on Variable Stars, 1747, 1
- Grady et al. (2000) Grady, C. A., et al. 2000, ApJ, 544, 895
- Grady et al. (2004) —. 2004, ApJ, 608, 809
- Grady et al. (2007) —. 2007, ApJ, 665, 1391
- Grady et al. (2009) —. 2009, ApJ, 699, 1822
- Graham (1992) Graham, J. A. 1992, PASP, 104, 479
- Graham & Phillips (1987) Graham, J. A., & Phillips, A. C. 1987, PASP, 99, 91
- Grinin et al. (2002) Grinin, V. P., Shakhovskoi, D. N., Shenavrin, V. I., Rostopchina, A. N., & Tambovtseva, L. V. 2002, Astronomy Reports, 46, 646
- Guenther et al. (2007) Guenther, E. W., Esposito, M., Mundt, R., Covino, E., Alcalá, J. M., Cusano, F., & Stecklum, B. 2007, A&A, 467, 1147
- Guimarães et al. (2006) Guimarães, M. M., Alencar, S. H. P., Corradi, W. J. B., & Vieira, S. L. A. 2006, A&A, 457, 581
- Gürtler et al. (1999) Gürtler, J., Schreyer, K., Henning, T., Lemke, D., & Pfau, W. 1999, A&A, 346, 205
- Habart et al. (2004) Habart, E., Natta, A., & Krügel, E. 2004, A&A, 427, 179
- Habart et al. (2006) Habart, E., Natta, A., Testi, L., & Carbillet, M. 2006, A&A, 449, 1067
- Habart et al. (2003) Habart, E., Testi, L., Natta, A., & Vanzi, L. 2003, A&A, 400, 575
- Haisch et al. (2006) Haisch, Jr., K. E., Barsony, M., Ressler, M. E., & Greene, T. P. 2006, AJ, 132, 2675
- Haisch et al. (2004) Haisch, Jr., K. E., Greene, T. P., Barsony, M., & Stahler, S. W. 2004, AJ, 127, 1747
- Hammersley & Jourdain de Muizon (2003) Hammersley, P. L., & Jourdain de Muizon, M. 2003, in ESA Special Publication, Vol. 481, The Calibration Legacy of the ISO Mission, ed. L. Metcalfe, A. Salama, S. B. Peschke, & M. F. Kessler, 129
- Hanner et al. (1992) Hanner, M. S., Tokunaga, A. T., & Geballe, T. R. 1992, ApJ, 395, L111
- Harvey et al. (2007) Harvey, P., Merín, B., Huard, T. L., Rebull, L. M., Chapman, N., Evans, II, N. J., & Myers, P. C. 2007, ApJ, 663, 1149
- Henning (2010) Henning, T. 2010, ARA&A, 48, 21
- Henning et al. (1998) Henning, T., Burkert, A., Launhardt, R., Leinert, C., & Stecklum, B. 1998, A&A, 336, 565
- Herbig (1977) Herbig, G. H. 1977, ApJ, 217, 693
- Herbig (1990) —. 1990, ApJ, 360, 639
- Herbig et al. (2001) Herbig, G. H., Aspin, C., Gilmore, A. C., Imhoff, C. L., & Jones, A. F. 2001, PASP, 113, 1547
- Herbst et al. (1994) Herbst, W., Herbst, D. K., Grossman, E. J., & Weinstein, D. 1994, AJ, 108, 1906
- Herbst & Shevchenko (1999) Herbst, W., & Shevchenko, V. S. 1999, AJ, 118, 1043
- Hessman & Guenther (1997) Hessman, F. V., & Guenther, E. W. 1997, A&A, 321, 497
- Hirose & Turner (2011) Hirose, S., & Turner, N. J. 2011, ApJ, 732, L30
- Hodapp et al. (1996) Hodapp, K., Hora, J. L., Rayner, J. T., Pickles, A. J., & Ladd, E. F. 1996, ApJ, 468, 861
- Hodapp (1999) Hodapp, K. W. 1999, AJ, 118, 1338
- Houck et al. (2004) Houck, J. R., et al. 2004, in Presented at the Society of Photo-Optical Instrumentation Engineers (SPIE) Conference, Vol. 5487, Society of Photo-Optical Instrumentation Engineers (SPIE) Conference Series, ed. J. C. Mather, 62–76
- Hughes et al. (1991) Hughes, J. D., Hartigan, P., Graham, J. A., Emerson, J. P., & Marang, F. 1991, AJ, 101, 1013
- Hutchinson et al. (1994) Hutchinson, M. G., Albinson, J. S., Barrett, P., Davies, J. K., Evans, A., Goldsmith, M. J., & Maddison, R. C. 1994, A&A, 285, 883
- Isobe et al. (1988) Isobe, S., Norimoto, Y., & Kitamura, T. 1988, PASJ, 40, 89
- Jaschek & Jaschek (1992) Jaschek, C., & Jaschek, M. 1992, A&AS, 95, 535
- Jayawardhana et al. (2001) Jayawardhana, R., Fisher, R. S., Telesco, C. M., Piña, R. K., Barrado y Navascués, D., Hartmann, L. W., & Fazio, G. G. 2001, AJ, 122, 2047
- Jensen et al. (2007) Jensen, E. L. N., Dhital, S., Stassun, K. G., Patience, J., Herbst, W., Walter, F. M., Simon, M., & Basri, G. 2007, AJ, 134, 241
- Joblin et al. (1996) Joblin, C., Tielens, A. G. G. M., Geballe, T. R., & Wooden, D. H. 1996, ApJ, 460, L119
- Juhász et al. (2007) Juhász, A., Prusti, T., Ábrahám, P., & Dullemond, C. P. 2007, MNRAS, 374, 1242
- Juhász et al. (2010) Juhász, A., et al. 2010, ApJ, 721, 431
- Juhász et al. (2012) —. 2012, ApJ, 744, 118
- Kardopolov & Filipev (1981) Kardopolov, V. I., & Filipev, G. K. 1981, Soviet Ast., 25, 457
- Keller et al. (2008) Keller, L. D., et al. 2008, ApJ, 684, 411
- Kenyon et al. (1994) Kenyon, S. J., et al. 1994, AJ, 107, 2153
- Kessler-Silacci et al. (2005) Kessler-Silacci, J. E., Hillenbrand, L. A., Blake, G. A., & Meyer, M. R. 2005, ApJ, 622, 404
- Köhler et al. (2008) Köhler, R., Ratzka, T., Herbst, T. M., & Kasper, M. 2008, A&A, 482, 929
- Koresko (2002) Koresko, C. D. 2002, AJ, 124, 1082
- Kóspál et al. (2007) Kóspál, Á., Ábrahám, P., Prusti, T., Acosta-Pulido, J., Hony, S., Moór, A., & Siebenmorgen, R. 2007, A&A, 470, 211
- Kóspál et al. (2011) Kóspál, Á., Salter, D. M., Hogerheijde, M. R., Moór, A., & Blake, G. A. 2011, A&A, 527, A96
- Kóspál et al. (2008) Kóspál, Á., et al. 2008, MNRAS, 383, 1015
- Kóspál et al. (2012) Kóspál, Á.., et al. 2012, A&A
- Kozlova et al. (2006) Kozlova, O. V., Shakhovskoi, D. N., Rostopchina, A. N., & Alekseev, I. Y. 2006, Astrophysics, 49, 151
- Kun et al. (2011) Kun, M., et al. 2011, MNRAS, 413, 2689
- Lafrenière et al. (2008) Lafrenière, D., Jayawardhana, R., Brandeker, A., Ahmic, M., & van Kerkwijk, M. H. 2008, ApJ, 683, 844
- Lagage et al. (2006) Lagage, P., et al. 2006, Science, 314, 621
- Laureijs et al. (2003) Laureijs, R. J., Klaas, U., Richards, P. J., Schulz, B., & Abraham, P. 2003, The ISO Handbook, Volume IV - PHT - The Imaging Photo-Polarimeter, ed. Kessler, M. F., Mueller, T. G., Leech, K., Arviset, C., Garcia-Lario, P., Metcalfe, L., Pollock, A., Prusti, T., & Salama, A.
- Lecavelier Des Etangs et al. (2005) Lecavelier Des Etangs, A., Nitschelm, C., Olsen, E. H., Vidal-Madjar, A., & Ferlet, R. 2005, A&A, 439, 571
- Leinert et al. (2002) Leinert, C., Ábrahám, P., Acosta-Pulido, J., Lemke, D., & Siebenmorgen, R. 2002, A&A, 393, 1073
- Leinert et al. (2001a) Leinert, C., Beck, T. L., Ligori, S., Simon, M., Woitas, J., & Howell, R. R. 2001a, A&A, 369, 215
- Leinert & Haas (1989) Leinert, C., & Haas, M. 1989, ApJ, 342, L39
- Leinert et al. (2001b) Leinert, C., Haas, M., Ábrahám, P., & Richichi, A. 2001b, A&A, 375, 927
- Leinert et al. (1991) Leinert, C., Haas, M., Mundt, R., Richichi, A., & Zinnecker, H. 1991, A&A, 250, 407
- Leinert et al. (1997) Leinert, C., Richichi, A., & Haas, M. 1997, A&A, 318, 472
- Leinert et al. (1993) Leinert, C., Zinnecker, H., Weitzel, N., Christou, J., Ridgway, S. T., Jameson, R., Haas, M., & Lenzen, R. 1993, A&A, 278, 129
- Leinert et al. (2004) Leinert, C., et al. 2004, A&A, 423, 537
- Li et al. (1994) Li, W., Evans, II, N. J., Harvey, P. M., & Colomé, C. 1994, ApJ, 433, 199
- Lim & Takakuwa (2006) Lim, J., & Takakuwa, S. 2006, ApJ, 653, 425
- Liu et al. (1996) Liu, M. C., et al. 1996, ApJ, 461, 334
- Lopes et al. (1992) Lopes, D. F., Damineli Neto, A., & de Freitas Pacheco, J. A. 1992, A&A, 261, 482
- Lorenzetti et al. (2009) Lorenzetti, D., Larionov, V. M., Giannini, T., Arkharov, A. A., Antoniucci, S., Nisini, B., & Di Paola, A. 2009, ApJ, 693, 1056
- Lorenzetti et al. (2011) Lorenzetti, D., et al. 2011, ApJ, 732, 69
- Luhman et al. (2010) Luhman, K. L., Allen, P. R., Espaillat, C., Hartmann, L., & Calvet, N. 2010, ApJS, 186, 111
- Luhman & Rieke (1999) Luhman, K. L., & Rieke, G. H. 1999, ApJ, 525, 440
- Luhman et al. (2008) Luhman, K. L., et al. 2008, ApJ, 675, 1375
- Magakian & Movsesian (2001) Magakian, T. Y., & Movsesian, T. A. 2001, Astrophysics, 44, 419
- Malfait et al. (1998) Malfait, K., Bogaert, E., & Waelkens, C. 1998, A&A, 331, 211
- Manfroid et al. (1991) Manfroid, J., et al. 1991, A&AS, 87, 481
- McCabe et al. (2006) McCabe, C., Ghez, A. M., Prato, L., Duchêne, G., Fisher, R. S., & Telesco, C. 2006, ApJ, 636, 932
- Meeus et al. (2002) Meeus, G., Bouwman, J., Dominik, C., Waters, L. B. F. M., & de Koter, A. 2002, A&A, 392, 1039
- Meeus et al. (1998) Meeus, G., Waelkens, C., & Malfait, K. 1998, A&A, 329, 131
- Meeus et al. (2001) Meeus, G., Waters, L. B. F. M., Bouwman, J., van den Ancker, M. E., Waelkens, C., & Malfait, K. 2001, A&A, 365, 476
- Melo (2003) Melo, C. H. F. 2003, A&A, 410, 269
- Monnier et al. (2009) Monnier, J. D., Tuthill, P. G., Ireland, M., Cohen, R., Tannirkulam, A., & Perrin, M. D. 2009, ApJ, 700, 491
- Moore & Emerson (1992) Moore, T. J. T., & Emerson, J. P. 1992, MNRAS, 259, 381
- Moore & Emerson (1994) —. 1994, MNRAS, 271, 243
- Morales-Calderón et al. (2009) Morales-Calderón, M., et al. 2009, ApJ, 702, 1507
- Morales-Calderón et al. (2011) —. 2011, ApJ, 733, 50
- Mouillet et al. (2001) Mouillet, D., Lagrange, A. M., Augereau, J. C., & Ménard, F. 2001, A&A, 372, L61
- Murakawa et al. (2008) Murakawa, K., Oya, S., Pyo, T., & Ishii, M. 2008, A&A, 492, 731
- Muzerolle et al. (2003) Muzerolle, J., Calvet, N., Hartmann, L., & D’Alessio, P. 2003, ApJ, 597, L149
- Muzerolle et al. (2005a) Muzerolle, J., Luhman, K. L., Briceño, C., Hartmann, L., & Calvet, N. 2005a, ApJ, 625, 906
- Muzerolle et al. (2005b) Muzerolle, J., Megeath, S. T., Flaherty, K. M., Gordon, K. D., Rieke, G. H., Young, E. T., & Lada, C. J. 2005b, ApJ, 620, L107
- Muzerolle et al. (2009) Muzerolle, J., et al. 2009, ApJ, 704, L15
- Myers et al. (1987) Myers, P. C., Fuller, G. A., Mathieu, R. D., Beichman, C. A., Benson, P. J., Schild, R. E., & Emerson, J. P. 1987, ApJ, 319, 340
- Nagel et al. (2010) Nagel, E., D’Alessio, P., Calvet, N., Espaillat, C., Sargent, B., Hernández, J., & Forrest, W. J. 2010, ApJ, 708, 38
- Natta (1993) Natta, A. 1993, ApJ, 412, 761
- Nummelin et al. (2001) Nummelin, A., Whittet, D. C. B., Gibb, E. L., Gerakines, P. A., & Chiar, J. E. 2001, ApJ, 558, 185
- Osorio et al. (2003) Osorio, M., D’Alessio, P., Muzerolle, J., Calvet, N., & Hartmann, L. 2003, ApJ, 586, 1148
- Pérez et al. (2004) Pérez, M. R., van den Ancker, M. E., de Winter, D., & Bopp, B. W. 2004, A&A, 416, 647
- Perez et al. (1992) Perez, M. R., Webb, J. R., & Thé, P. S. 1992, A&A, 257, 209
- Pirzkal et al. (1997) Pirzkal, N., Spillar, E. J., & Dyck, H. M. 1997, ApJ, 481, 392
- Pojmanski (1997) Pojmanski, G. 1997, Acta Astron., 47, 467
- Pontoppidan et al. (2007) Pontoppidan, K. M., Dullemond, C. P., Blake, G. A., Evans, II, N. J., Geers, V. C., Harvey, P. M., & Spiesman, W. 2007, ApJ, 656, 991
- Pontoppidan et al. (2004) Pontoppidan, K. M., van Dishoeck, E. F., & Dartois, E. 2004, A&A, 426, 925
- Prato et al. (2003) Prato, L., Greene, T. P., & Simon, M. 2003, ApJ, 584, 853
- Prato et al. (2002) Prato, L., Simon, M., Mazeh, T., Zucker, S., & McLean, I. S. 2002, ApJ, 579, L99
- Prato et al. (2001) Prato, L., et al. 2001, ApJ, 549, 590
- Preibisch et al. (2006) Preibisch, T., Kraus, S., Driebe, T., van Boekel, R., & Weigelt, G. 2006, A&A, 458, 235
- Prusti et al. (1991) Prusti, T., Clark, F. O., Whittet, D. C. B., Laureijs, R. J., & Zhang, C. Y. 1991, MNRAS, 251, 303
- Prusti et al. (1994) Prusti, T., Natta, A., & Palla, F. 1994, A&A, 292, 593
- Przygodda et al. (2003) Przygodda, F., van Boekel, R., Ábrahám, P., Melnikov, S. Y., Waters, L. B. F. M., & Leinert, C. 2003, A&A, 412, L43
- Pugach (2004) Pugach, A. F. 2004, Astronomy Reports, 48, 470
- Ratzka et al. (2005) Ratzka, T., Köhler, R., & Leinert, C. 2005, A&A, 437, 611
- Ratzka et al. (2008) Ratzka, T., Leinert, C., Przygodda, F., & Wolf, S. 2008, in The Power of Optical/IR Interferometry: Recent Scientific Results and 2nd Generation, ed. A. Richichi, F. Delplancke, F. Paresce, & A. Chelli, 519–522
- Ratzka et al. (2009) Ratzka, T., et al. 2009, A&A, 502, 623
- Rebull (2011) Rebull, L. M. 2011, ArXiv e-prints
- Reipurth (1985) Reipurth, B. 1985, A&AS, 61, 319
- Reipurth & Bally (1986) Reipurth, B., & Bally, J. 1986, Nature, 320, 336
- Reipurth et al. (2002) Reipurth, B., Lindgren, H., Mayor, M., Mermilliod, J., & Cramer, N. 2002, AJ, 124, 2813
- Reipurth & Wamsteker (1983) Reipurth, B., & Wamsteker, W. 1983, A&A, 119, 14
- Reipurth & Zinnecker (1993) Reipurth, B., & Zinnecker, H. 1993, A&A, 278, 81
- Ressler & Barsony (2003) Ressler, M. E., & Barsony, M. 2003, ApJ, 584, 832
- Richichi et al. (1994) Richichi, A., Leinert, C., Jameson, R., & Zinnecker, H. 1994, A&A, 287, 145
- Roche et al. (1994) Roche, P. F., Aitken, D. K., & Smith, C. H. 1994, MNRAS, 269, 649
- Rossiter (1955) Rossiter, R. A. 1955, Publications of Michigan Observatory, 11, 1
- Rostopchina et al. (2001) Rostopchina, A. N., Grinin, V. P., & Shakhovskoi, D. N. 2001, Astronomy Reports, 45, 51
- Rostopchina et al. (2000) Rostopchina, A. N., Grinin, V. P., Shakhovskoi, D. N., Thé, P. S., & Minikulov, N. K. 2000, Astronomy Reports, 44, 365
- Sandell & Weintraub (2001) Sandell, G., & Weintraub, D. A. 2001, ApJS, 134, 115
- Sargent et al. (2009) Sargent, B. A., et al. 2009, ApJS, 182, 477
- Scarrott et al. (1991) Scarrott, S. M., Rolph, C. D., & Tadhunter, C. N. 1991, MNRAS, 249, 131
- Scarrott & Wolstencroft (1988) Scarrott, S. M., & Wolstencroft, R. D. 1988, MNRAS, 231, 1019
- Schmidt et al. (2008) Schmidt, T. O. B., Neuhäuser, R., Seifahrt, A., Vogt, N., Bedalov, A., Helling, C., Witte, S., & Hauschildt, P. H. 2008, A&A, 491, 311
- Shiba et al. (1993) Shiba, H., Sato, S., Yamashita, T., Kobayashi, Y., & Takami, H. 1993, ApJS, 89, 299
- Siebenmorgen et al. (1998) Siebenmorgen, R., Natta, A., Kruegel, E., & Prusti, T. 1998, A&A, 339, 134
- Siebenmorgen et al. (2000) Siebenmorgen, R., Prusti, T., Natta, A., & Müller, T. G. 2000, A&A, 361, 258
- Simon et al. (1995) Simon, M., et al. 1995, ApJ, 443, 625
- Sipos et al. (2011) Sipos, N., Kóspál, Á., Grossman, E. J., & Weinstein, D. 2011, A&A, in prep
- Sitko et al. (2008) Sitko, M. L., et al. 2008, ApJ, 678, 1070
- Skemer et al. (2008) Skemer, A. J., Close, L. M., Hinz, P. M., Hoffmann, W. F., Kenworthy, M. A., & Miller, D. L. 2008, ApJ, 676, 1082
- Sloan et al. (1999) Sloan, G. C., Hayward, T. L., Allamandola, L. J., Bregman, J. D., Devito, B., & Hudgins, D. M. 1999, ApJ, 513, L65
- Smith et al. (1999) Smith, K. W., Lewis, G. F., Bonnell, I. A., Bunclark, P. S., & Emerson, J. P. 1999, MNRAS, 304, 367
- Stapelfeldt et al. (1995) Stapelfeldt, K. R., et al. 1995, ApJ, 449, 888
- Stecklum et al. (1995) Stecklum, B., Eckart, A., Henning, T., & Loewe, M. 1995, A&A, 296, 463
- Stelzer et al. (2009) Stelzer, B., Robrade, J., Schmitt, J. H. M. M., & Bouvier, J. 2009, A&A, 493, 1109
- Sterzik et al. (2005) Sterzik, M. F., Melo, C. H. F., Tokovinin, A. A., & van der Bliek, N. 2005, A&A, 434, 671
- Straižys et al. (2002) Straižys, V., Corbally, C. J., Kazlauskas, A., & Černis, K. 2002, Baltic Astronomy, 11, 261
- Strom et al. (1972) Strom, K. M., Strom, S. E., Breger, M., Brooke, A. L., Yost, J., Grasdalen, G., & Carrasco, L. 1972, ApJ, 173, L65
- Strom et al. (1976) Strom, S. E., Vrba, F. J., & Strom, K. M. 1976, AJ, 81, 314
- Sylvester & Mannings (2000) Sylvester, R. J., & Mannings, V. 2000, MNRAS, 313, 73
- Sylvester et al. (1997) Sylvester, R. J., Skinner, C. J., & Barlow, M. J. 1997, MNRAS, 289, 831
- Sylvester et al. (1996) Sylvester, R. J., Skinner, C. J., Barlow, M. J., & Mannings, V. 1996, MNRAS, 279, 915
- Takami et al. (2003) Takami, M., Bailey, J., & Chrysostomou, A. 2003, A&A, 397, 675
- Testa et al. (2008) Testa, P., Huenemoerder, D. P., Schulz, N. S., & Ishibashi, K. 2008, ApJ, 687, 579
- Thé et al. (1994) Thé, P. S., de Winter, D., & Perez, M. R. 1994, A&AS, 104, 315
- Tielens (2008) Tielens, A. G. G. M. 2008, ARA&A, 46, 289
- Tjin A Djie et al. (1989) Tjin A Djie, H. R. E., Thé, P. S., Andersen, J., Nordstrom, B., Finkenzeller, U., & Jankovics, I. 1989, A&AS, 78, 1
- Torres (2004) Torres, G. 2004, AJ, 127, 1187
- Turner et al. (2010) Turner, N. J., Carballido, A., & Sano, T. 2010, ApJ, 708, 188
- van Boekel et al. (2010) van Boekel, R., Juhász, A., Henning, T., Köhler, R., Ratzka, T., Herbst, T., Bouwman, J., & Kley, W. 2010, A&A, 517, A16
- van Boekel et al. (2005) van Boekel, R., Min, M., Waters, L. B. F. M., de Koter, A., Dominik, C., van den Ancker, M. E., & Bouwman, J. 2005, A&A, 437, 189
- van Boekel et al. (2004) van Boekel, R., Waters, L. B. F. M., Dominik, C., Dullemond, C. P., Tielens, A. G. G. M., & de Koter, A. 2004, A&A, 418, 177
- van den Bergh & Herbst (1975) van den Bergh, S., & Herbst, W. 1975, AJ, 80, 208
- van Dishoeck (2004) van Dishoeck, E. F. 2004, ARA&A, 42, 119
- Verhoeff et al. (2011) Verhoeff, A. P., et al. 2011, A&A, 528, A91
- Vinković et al. (2006) Vinković, D., Ivezić, Ž., Jurkić, T., & Elitzur, M. 2006, ApJ, 636, 348
- Vinković & Jurkić (2007) Vinković, D., & Jurkić, T. 2007, ApJ, 658, 462
- Wang & Looney (2007) Wang, S., & Looney, L. W. 2007, ApJ, 659, 1360
- Watson et al. (2009) Watson, D. M., et al. 2009, ApJS, 180, 84
- Weinberger et al. (1999) Weinberger, A. J., Becklin, E. E., Schneider, G., Smith, B. A., Lowrance, P. J., Silverstone, M. D., Zuckerman, B., & Terrile, R. J. 1999, ApJ, 525, L53
- Weinberger et al. (2000) Weinberger, A. J., Rich, R. M., Becklin, E. E., Zuckerman, B., & Matthews, K. 2000, ApJ, 544, 937
- Wheelwright et al. (2010) Wheelwright, H. E., Oudmaijer, R. D., & Goodwin, S. P. 2010, MNRAS, 401, 1199
- Wisniewski et al. (2008) Wisniewski, J. P., Clampin, M., Grady, C. A., Ardila, D. R., Ford, H. C., Golimowski, D. A., Illingworth, G. D., & Krist, J. E. 2008, ApJ, 682, 548
- Wooden et al. (2000) Wooden, D. H., Bell, K. R., Harker, D. E., & Woodward, C. E. 2000, in Bulletin of the American Astronomical Society, Vol. 32, American Astronomical Society Meeting Abstracts, 1482
- Yudin et al. (1999) Yudin, R. V., Clarke, D., & Smith, R. A. 1999, A&A, 345, 547
- Zinnecker et al. (1991) Zinnecker, H., Christou, J. C., Ridgway, S. T., & Probst, R. G. 1991, in Astronomical Society of the Pacific Conference Series, Vol. 14, Astronomical Society of the Pacific Conference Series, ed. R. Elston, 270–272
- Zuckerman et al. (1995) Zuckerman, B., Forveille, T., & Kastner, J. H. 1995, Nature, 373, 494
| Coordinates | ISO | Spitzer | |||||||||||||||
|---|---|---|---|---|---|---|---|---|---|---|---|---|---|---|---|---|---|
| Name | Mass | Sp.type | RA(2000) | Dec(2000) | TDT | Corr. | Obs. date | AOR | Corr. | Obs. date | Si-O | Ice | PAH | Type | Var. | ||
| (1) | (2) | (3) | (4) | (5) | (6) | (7) | (8) | (9) | (10) | (11) | (12) | (13) | (14) | (15) | (16) | ||
| VX Cas | I | A0 | 00 31 30.69 | 61 58 51.0 | 58704023 | BO | 25-Jul-1997 | em | … | em | sil. em. | … | |||||
| IRAS 03260+3111 | I | B5+F2 | 03 29 10.38 | 31 21 59.2 | 65201755 | BO | 29-Aug-1997 | … | … | em | PAH dom. | … | |||||
| BARN 5 IRS 1 | L | … | 03 47 41.60 | 32 51 43.8 | 63103703 | B!O | 08-Aug-1997 | 5635328 | 03-Feb-2004 | abs | abs | … | sil. abs. | yes | |||
| LDN 1489 IRSa | L | … | 04 04 43.07 | 26 18 56.4 | 81401708 | O | 07-Feb-1998 | 3528960 | 07-Feb-2004 | abs | abs | … | sil. abs. | … | |||
| T Tau | L | G5 | 04 21 59.43 | 19 32 06.4 | 67901255 | O | 25-Sep-1997 | 3530240 | 08-Feb-2004 | abs | abs | … | sil. abs. | yes | |||
| DG Tau | L | G | 04 27 04.70 | 26 06 16.3 | 64501604 | B | 22-Aug-1997 | 3530496 | O | 02-Mar-2004 | … | … | … | … | yes | ||
| 15115520 | 22-Mar-2006 | ||||||||||||||||
| Haro 6-10 | L | K3 | 04 29 23.73 | 24 33 00.3 | 65300605 | B | 30-Aug-1997 | 3531008 | 02-Mar-2004 | abs | abs | … | sil. abs. | yes | |||
| 66901306 | O | 15-Sep-1997 | 25679872 | 14-Oct-2008 | |||||||||||||
| 31618304 | O | 04-Apr-2009 | |||||||||||||||
| LDN 1551 IRS 5 | L | … | 04 31 34.08 | 18 08 04.9 | 64201706 | MB!O | 19-Aug-1997 | 3531776 | 04-Mar-2004 | abs | abs | … | sil. abs. | yes | |||
| HL Tau | L | K9 | 04 31 38.44 | 18 13 57.7 | 65602507 | MB | 02-Sep-1997 | 3531776 | 04-Mar-2004 | abs | abs | … | sil. abs. | yes | |||
| UZ Tau | L | M2 | 04 32 43.04 | 25 52 31.1 | 68401434 | O | 30-Sep-1997 | 3531264 | 28-Feb-2004 | em | … | … | sil. em. | yes | |||
| 83300749 | O | 25-Feb-1998 | 12288000 | 14-Feb-2005 | |||||||||||||
| VY Tau | L | M0 | 04 39 17.41 | 22 47 53.4 | 68101239 | 27-Sep-1997 | 3547904 | 08-Feb-2004 | em | … | … | sil. em. | yes | ||||
| 83300854 | 25-Feb-1998 | 11565824 | O | 18-Feb-2005 | |||||||||||||
| 86100859 | 25-Mar-1998 | ||||||||||||||||
| DR Tau | L | K4 | 04 47 06.21 | 16 58 42.8 | 67901329 | 25-Sep-1997 | 3533568 | 08-Feb-2004 | em | … | … | sil. em. | yes | ||||
| 83300944 | 25-Feb-1998 | 12287744 | 18-Feb-2005 | ||||||||||||||
| UX Ori | I | A3 | 05 04 29.99 | 03 47 14.3 | 85801453 | B | 22-Mar-1998 | em | … | … | sil. em. | … | |||||
| HD 34700 | L | G0 | 05 19 41.40 | 05 38 42.9 | 63602294 | B | 13-Aug-1997 | 3584768 | O | 02-Oct-2004 | … | … | em | PAH dom. | no | ||
| BF Ori | I | A5 | 05 37 13.27 | 06 35 00.5 | 70101958 | B | 17-Oct-1997 | 5638144 | 03-Oct-2004 | em | … | … | sil. em. | yes | |||
| 18835968 | 09-Mar-2007 | ||||||||||||||||
| RR Tau | I | A2 | 05 39 30.52 | 26 22 27.0 | 67000863 | BO | 16-Sep-1997 | 5638400 | 28-Sep-2004 | … | … | em | PAH dom. | yes | |||
| 86603163 | BO | 30-Mar-1998 | |||||||||||||||
| Reipurth 50 N IRS 1 | L | … | 05 40 27.45 | 07 27 30.1 | 69703804 | BO | 13-Oct-1997 | abs | abs | … | sil. abs. | … | |||||
| SX Cha | L | M0.5 | 10 55 59.73 | 77 24 39.9 | 16600204 | O | 01-May-1996 | 12697345 | 26-May-2005 | em | … | … | sil. em. | … | |||
| CR Cha | L | K4 | 10 59 06.99 | 77 01 40.4 | 16600317 | O | 01-May-1996 | 12697345 | 26-May-2005 | em | … | … | sil. em. | yes | |||
| 62501703 | MBO | 02-Aug-1997 | 26143744 | 01-Jun-2008 | |||||||||||||
| 27186944 | 08-Jun-2008 | ||||||||||||||||
| HD 95881 | I | A1/A2 | 11 01 57.64 | 71 30 48.4 | 10400919 | BO | 29-Feb-1996 | 11004928 | 15-Feb-2005 | em | … | em | sil. em. | no | |||
| CT Cha | L | K7 | 11 04 09.09 | 76 27 19.4 | 16600124 | O | 01-May-1996 | 12697345 | 26-May-2005 | em | … | … | sil. em. | yes | |||
| VW Cha | L | K8 | 11 08 01.49 | 77 42 28.9 | 16700234 | O | 02-May-1996 | 12696832 | 12-Jul-2005 | em | … | … | sil. em. | yes | |||
| CU Cha | I | A0 | 11 08 03.30 | 77 39 17.4 | 07900309 | MBO | 04-Feb-1996 | 12697088 | 07-Mar-2006 | … | … | em | PAH dom. | yes | |||
| 14101580 | BO | 06-Apr-1996 | |||||||||||||||
| 62501510 | MBO | 02-Aug-1997 | |||||||||||||||
| Glass I | L | K7 | 11 08 15.10 | 77 33 53.2 | 07900410 | MO | 04-Feb-1996 | 12697088 | 07-Mar-2006 | em | … | … | sil. em. | yes | |||
| 16600138 | BO | 01-May-1996 | 25680640 | 16-Aug-2008 | |||||||||||||
| 58401511 | BO | 22-Jun-1997 | |||||||||||||||
| Ced 111 IRS 5b | L | M5 | 11 08 39.43 | 77 43 52.1 | 07900211 | B!O | 04-Feb-1996 | 12697345 | O! | 26-May-2005 | … | abs | … | sil. abs. | no | ||
| 62501412 | M!B!O | 02-Aug-1997 | |||||||||||||||
| VZ Cha | L | K7 | 11 09 23.79 | 76 23 20.8 | 27101145 | O | 14-Aug-1996 | 12696832 | 12-Jul-2005 | em | … | … | sil. em. | yes | |||
| HD 97300 | I | B9 | 11 09 50.03 | 76 36 47.7 | 07901912 | MBO | 04-Feb-1996 | 12697088 | 07-Mar-2006 | … | … | em | PAH dom. | no | |||
| 62501316 | MBO | 02-Aug-1997 | |||||||||||||||
| Ced 112 IRS 4 | L | K5 | 11 09 53.41 | 76 34 25.5 | 62501217 | MBO | 02-Aug-1997 | 12697088 | 07-Mar-2006 | … | … | … | … | yes | |||
| WX Cha | L | M1.25 | 11 09 58.74 | 77 37 08.9 | 16600749 | O | 01-May-1996 | 12696576 | 10-Jul-2005 | em | … | … | sil. em. | yes | |||
| WW Cha | L | K5 | 11 10 00.11 | 76 34 57.9 | 27101153 | O | 14-Aug-1996 | 12697088 | 07-Mar-2006 | em | … | … | sil. em. | yes | |||
| 26142976 | 01-Jun-2008 | ||||||||||||||||
| 27185408 | O | 08-Jun-2008 | |||||||||||||||
| XX Cha | L | M2 | 11 11 39.66 | 76 20 15.3 | 16600664 | O | 01-May-1996 | 12696576 | 10-Jul-2005 | em | … | … | sil. em. | yes | |||
| CV Cha | L | K0 | 11 12 27.72 | 76 44 22.3 | 58401637 | O | 22-Jun-1997 | 12697088 | 07-Mar-2006 | em | … | … | sil. em. | yes | |||
| 60601421 | BO | 14-Jul-1997 | |||||||||||||||
| HD 98800 | L | K4 | 11 22 05.30 | 24 46 39.4 | 24001017 | B | 14-Jul-1996 | 3571968 | 25-Jun-2004 | em | … | … | sil. em. | yes | |||
| 3571969 | 03-Jan-2005 | ||||||||||||||||
| HD 100453 | I | A9 | 11 33 05.59 | 54 19 28.5 | 26000131 | B | 02-Aug-1996 | 3578880 | 06-Jun-2004 | … | … | em | PAH dom. | no | |||
| HD 100546 | I | B9 | 11 33 25.43 | 70 11 41.3 | 10400537 | BO | 29-Feb-1996 | em | … | em | sil. em. | … | |||||
| HD 104237 | I | A | 12 00 05.12 | 78 11 34.7 | 10400325 | BO | 29-Feb-1996 | 12677632 | O | 30-May-2005 | em | … | … | sil. em. | yes | ||
| 23300625 | BO | 07-Jul-1996 | |||||||||||||||
| 53300118 | MB | 02-May-1997 | |||||||||||||||
| DK Cha | I | F0 | 12 53 17.22 | 77 07 10.6 | 07901717 | BO | 04-Feb-1996 | 12679168 | 26-May-2006 | abs | abs | … | sil. abs. | … | |||
| HD 135344 B | I | F8 | 15 15 48.45 | 37 09 16.0 | 10401742 | B | 29-Feb-1996 | 3580672 | 08-Aug-2004 | … | … | em | PAH dom. | yes | |||
| 10401876 | B | 29-Feb-1996 | |||||||||||||||
| HD 139614 | I | A7 | 15 40 46.39 | 42 29 53.6 | 10402322 | BO | 29-Feb-1996 | 3580928 | 08-Aug-2004 | em | … | em | sil. em. | yes | |||
| HD 141569 | I | A0 | 15 49 57.76 | 03 55 16.2 | 62701662 | B | 04-Aug-1997 | 3560960 | 03-Mar-2004 | … | … | em | PAH dom. | no | |||
| HD 142666 | I | A8 | 15 56 40.02 | 22 01 40.0 | 10402847 | MBO | 29-Feb-1996 | 3586816 | 08-Aug-2004 | em | … | em | sil. em. | yes | |||
| HD 142527 | I | F6 | 15 56 41.89 | 42 19 23.3 | 10402547 | B | 29-Feb-1996 | 11005696 | 18-Mar-2005 | em | … | em | sil. em. | no | |||
| EX Lup | L | M0 | 16 03 05.49 | 40 18 25.4 | 44700104 | 05-Feb-1997 | 5645056 | 30-Aug-2004 | em | … | … | sil. em. | yes | ||||
| 48801209 | 18-Mar-1997 | 11570688 | 18-Mar-2005 | ||||||||||||||
| 64701714 | O | 24-Aug-1997 | |||||||||||||||
| 67403725 | O | 19-Sep-1997 | |||||||||||||||
| HD 144432 | I | A9/F0 | 16 06 57.95 | 27 43 09.4 | 10402662 | BO | 29-Feb-1996 | 3587072 | 08-Aug-2004 | em | … | … | sil. em. | yes | |||
| HR 5999 | I | A7 | 16 08 34.28 | 39 06 18.2 | 28901748 | MB | 01-Sep-1996 | em | … | … | sil. em. | … | |||||
| WL 16 | I | … | 16 27 02.34 | 24 37 27.2 | 08100620 | BO | 06-Feb-1996 | … | … | em | PAH dom. | … | |||||
| WL 6 | L | … | 16 27 21.80 | 24 29 53.4 | 08101921 | BO | 06-Feb-1996 | 12698880 | 16-Apr-2006 | abs | abs | … | sil. abs. | yes | |||
| MWC 863 | I | A1 | 16 40 17.92 | 23 53 45.2 | 64102335 | 18-Aug-1997 | em | … | … | sil. em. | … | ||||||
| AK Sco | I | F5 | 16 54 44.85 | 36 53 18.5 | 64402829 | O | 21-Aug-1997 | 12700160 | 16-Apr-2005 | em | … | … | sil. em. | no | |||
| MWC 865 | I | B | 16 59 06.77 | 42 42 08.4 | 28900460 | BO! | 31-Aug-1996 | … | … | em | PAH dom. | … | |||||
| 51 Oph | I | A0 | 17 31 24.97 | 23 57 45.3 | 10301104 | MBO | 28-Feb-1996 | 3582464 | 24-Mar-2004 | em | … | … | sil. em. | yes | |||
| HD 163296 | I | A1 | 17 56 21.29 | 21 57 21.8 | 32901192 | BO | 10-Oct-1996 | em | … | … | sil. em. | … | |||||
| HD 169142 | I | B9 | 18 24 29.79 | 29 46 49.2 | 13601437 | MBO | 01-Apr-1996 | 3587584 | 26-Mar-2004 | … | … | em | PAH dom. | no | |||
| VV Ser | I | B6 | 18 28 47.86 | 00 08 39.8 | 47800913 | B | 08-Mar-1997 | 5651200 | 01-Sep-2004 | em | … | em | sil. em. | yes | |||
| OO Sera | L | … | 18 29 49.13 | 01 16 20.6 | 29000213 | 01-Sep-1996 | abs | abs | … | sil. abs. | yes | ||||||
| 34300318 | 24-Oct-1996 | ||||||||||||||||
| 47800223 | O | 08-Mar-1997 | |||||||||||||||
| 51301129 | O | 12-Apr-1997 | |||||||||||||||
| 67601734 | 22-Sep-1997 | ||||||||||||||||
| CK 1 | L | M4 | 18 29 57.74 | 01 14 05.7 | 10803126 | MBO | 04-Mar-1996 | 9828352 | 01-Sep-2004 | … | abs | … | … | no | |||
| SVS76 Ser 4c | L | … | 18 29 57.89 | 01 12 46.3 | 10803027 | MB!O | 04-Mar-1996 | 9407232 | 27-Mar-2004 | abs | abs | … | sil. abs. | … | |||
| CK 2 | L | K5-M0 | 18 30 00.62 | 01 15 20.1 | 10803228 | M!B!O | 04-Mar-1996 | 11828224 | 01-Sep-2004 | abs | abs | … | sil. abs. | … | |||
| S CrAd | L | K6 | 19 01 08.70 | 36 57 19.8 | 52301333 | O | 22-Apr-1997 | 11197952 | 20-Apr-2005 | em | … | … | sil. em. | yes | |||
| 14920960 | 20-Oct-2005 | ||||||||||||||||
| HH 100 IRS | L | K7 | 19 01 50.68 | 36 58 09.6 | 11501029 | BO | 11-Mar-1996 | abs | abs | … | sil. abs. | yes | |||||
| 70400629 | BO | 19-Oct-1997 | |||||||||||||||
| R CrA | I | B5 | 19 01 53.68 | 36 57 08.2 | 11501230 | BO | 11-Mar-1996 | em | … | … | sil. em. | … | |||||
| T CrA | I | F0 | 19 01 58.78 | 36 57 49.9 | 14100562 | BO | 06-Apr-1996 | em | … | … | sil. em. | … | |||||
| VV CrA | L | K7 | 19 03 06.75 | 37 12 49.5 | 52301015 | O | 22-Apr-1997 | 25680896 | 17-Nov-2008 | abs | abs | … | sil. abs. | … | |||
| WW Vul | I | A3 | 19 25 58.74 | 21 12 31.4 | 17600465 | MBO! | 11-May-1996 | 16828672 | 20-Jun-2006 | em | … | … | sil. em. | yes | |||
| 51300108 | BO | 12-Apr-1997 | |||||||||||||||
| BD +40 4124 | I | B3 | 20 20 28.25 | 41 21 51.5 | 15900568 | B | 24-Apr-1996 | … | … | em | PAH dom. | … | |||||
| LkHa 224 | I | F9 | 20 20 29.36 | 41 21 28.5 | 14201271 | BO | 07-Apr-1996 | … | … | em | PAH dom. | … | |||||
| PV Cep | L | G0-K0e | 20 45 53.94 | 67 57 38.7 | 14302274 | BO | 08-Apr-1996 | 12287488 | 23-Oct-2004 | abs | abs | … | sil. abs. | yes | |||
| SV Cep | I | A0 | 22 21 33.20 | 73 40 27.1 | 56201203 | B | 31-May-1997 | em | … | … | sil. em. | … | |||||
Note. — For a detailed description of the columns of this table, see Sec. 3.