Fundamental parameters of four massive eclipsing binaries in Westerlund 1
Abstract
Only a small number of high mass stars () have fundamental parameters (i.e. masses and radii) measured with high enough accuracy from eclipsing binaries to constrain formation and evolutionary models of massive stars. This work aims to increase this limited sample, by studying the four massive eclipsing binary candidates discovered by Bonanos in the young massive cluster Westerlund 1. We present new follow-up echelle spectroscopy of these binaries and models of their light and radial velocity curves. We obtain fundamental parameters for the eight component stars, finding masses that span a range of M⊙, and contributing accurate fundamental parameters for one additional very massive star, the 33 M⊙ component of W13. WR77o is found to have a M⊙ companion, which provides a second dynamical constraint on the mass of the progenitor of the magnetar known in the cluster. We also use W13 to estimate the first, direct, eclipsing binary distance to Westerlund 1 and therefore the magnetar and find it to be at kpc. Our results confirm previous evidence for a high mass for the progenitor of the magnetar. In addition, the availability of eclipsing binaries with accurate parameters opens the way for direct, independent, high precision eclipsing binary distance measurements to Westerlund 1.
Key Words.:
stars: fundamental parameters, stars: massive, binaries: eclipsing, stars: early-type, stars: Wolf-Rayet, open clusters and associations: individual (Westerlund 1)1 Introduction
Improving stellar structure, formation and evolution models of massive stars is limited by the accuracy with which their fundamental parameters (masses and radii) are known. Andersen (1991) reviewed the importance of accurate parameters from eclipsing binaries, while Torres et al. (2010) revisited the subject, reviewing the advances made possible by the continuous improvements in observational accuracy. They also compiled a catalog of detached systems with measurements accurate to from the literature, which consists of 95 systems and extends the mass range from to . The earliest-type star in the sample was an O7 star with a mass of . Bonanos (2009) found that the less stringent accuracy criterion of is only fulfilled by 15 eclipsing binaries with masses above , this number having only increased to 17 (with the components of Cyg OB2-17, measured by Stroud et al. 2010) in the last three years. This astounding lack of accurate measurements of the fundamental parameters of the highest mass stars, combined with the large parameter space of metallicity and evolutionary stage that they span, which is further complicated by multiplicity and in particular binary evolution, serves as the motivation for this work.
To improve the situation, a systematic survey of the most massive stars in the Local Group has been undertaken (see Bonanos 2010, for an overview). As part of this broader survey, Bonanos (2007) conducted the first variability survey of the young massive “super star cluster” Westerlund 1 (Clark et al. 2005) in search of massive eclipsing binary candidates, as it is one of the most massive young clusters known in the Local Group, with an age of 4.5-5 Myr (Crowther et al. 2006). Wd 1 is of great interest, as it contains an assortment of rare evolved massive stars, such as blue, yellow and red supergiants, including a rare supergiant B[e] star (Clark et al. 2005; Negueruela et al. 2010), 24 confirmed Wolf-Rayet stars (Crowther et al. 2006), a luminous blue variable (Clark & Negueruela 2004), and a magnetar (Muno et al. 2006), thereby making possible the determination of fundamental parameters of massive stars at different evolutionary stages. The photometric variability search resulted in four massive eclipsing binary candidates (WDEB, W13, W36, and WR77o; Bonanos 2007), which are the subject of this work.
In the following sections, we present follow-up spectroscopy and modeling of these four binaries, and the resulting component parameters. We present the observations in Section 2, the radial velocity measurements in Sect. 3, the models for each eclipsing binary in Sect. 4, the comparison with evolutionary models in Sect. 5, an estimation of the distance in Sect. 6, and a discussion of our results and conclusions in Sect. 7.
2 Observations and data reduction
Multi-epoch spectroscopy of the four eclipsing binaries was obtained during seven nights in 2007-2008 and one night in 2011 using the MIKE spectrograph (Bernstein et al. 2003) at the 6.5 meter Magellan (Clay) telescope at Las Campanas Observatory, Chile. This camera uses a SITe CCD with a pixel size of pixel-1 and a pixel scale of pixel-1. The slit yielded a spectral resolution (12 km s-1; the exact value depending on the binning used) at 7000, as measured from the full width at half maximum of the comparison lamp lines. Additional spectra were obtained over four consecutive nights in 2007 with the Inamori–Magellan Areal Camera & Spectrograph (IMACS) Multi-Object Echelle (MOE) spectrograph (Dressler et al. 2011) on the 6.5 meter Magellan (Baade) telescope. The 0.6 slit yielded a resolving power of (14 km s-1).
The IMACS spectra were reduced and extracted with the Carnegie Observatories System for MultiObject Spectroscopy (COSMOS) pipeline (version 2.15), while the MIKE spectra with the MIKE python pipeline (version 2.5.4), written by D. Kelson (Kelson et al. 2000; Kelson 2003). The extracted orders for each star were averaged, normalized, and merged, yielding a wavelength range 54509400 for the MIKE and 63808750 for the IMACS spectra, since the large amount of reddening toward Westerlund 1 ( mag; Negueruela et al. 2010) limited the signal-to-noise ratio (S/N) at shorter wavelengths. Heliocentric radial velocity corrections for each star were computed with the IRAF111IRAF is distributed by the National Optical Astronomy Observatory, which is operated by the Association of Universities for Research in Astronomy, Inc., under cooperative agreement with the NSF. routine and were taken into account in the subsequent radial velocity determination. The spectra of WDEB and W36 displayed double hydrogen and helium absorption lines consistent with a late-O or early-B spectral type, W13 displayed hydrogen and helium lines, in both absorption and emission, while WR77o displayed strong emission in He II and N IV , consistent with the WN7o spectral type determined by Crowther et al. (2006). Even though the S/N was not sufficient to detect the companion, we proceeded with the analysis of this single lined binary.
| UT Date | Instru- | Resolu- | Disper- | Total Exposure Time (sec) / S/N | |||
|---|---|---|---|---|---|---|---|
| ment | tion | sion | |||||
| () | (pix) | WDEB | W36 | W13 | WR77o | ||
| MIKE | 25500 | 0.05 | … | 1800/14 | 1440/30 | 4800/7 | |
| MIKE | 24200 | 0.10 | 3600/22 | 2700/38 | 1440/50 | 4800/12 | |
| MIKE | 24200 | 0.10 | 3600/20 | … | 1440/55 | 3300/14 | |
| MIKE | 24200 | 0.10 | … | 2700/42 | 1260/49 | 3600/14 | |
| MOE | 21000 | 0.25 | … | … | 1800/31 | … | |
| MOE | 21000 | 0.25 | … | 2400/20 | 2400/35 | … | |
| MOE | 21000 | 0.25 | … | … | 3600/17 | … | |
| MOE | 21000 | 0.25 | … | 2400/35 | … | 2400/7 | |
| MIKE | 24000 | 0.10 | 4800/13 | 900/14 | 1800/28 | 4800/7 | |
| MIKE | 23800 | 0.15 | … | 2700/56 | 1440/81 | 3600/27 | |
| MIKE | 23800 | 0.15 | … | 2700/54 | 1440/80 | 3600/20 | |
| MIKE | 24200 | 0.10 | 3600/32 | … | … | … | |
Table 1 lists the UT dates of the observations, the spectrograph and the corresponding resolution, dispersion and total exposure time and S/N for each target, determined at 7000 . Typically three exposures of each target were obtained with the MIKE spectrograph to enable cosmic ray removal. The empty records indicate spectra with very low S/N, which made the detection of the lines and thus the use of those spectra impossible.
3 Radial velocity analysis
The radial velocities (RVs) were determined with a minimization method, which compares the observed spectrum to a grid of synthetic spectra.
| Binary | HJD | Phase | RV1 | RV2 | ||
| 2450000 | (km s-1) | (km s-1) | (km s-1) | (km s-1) | ||
| WDEB | 4167.87328 | 0.42 | 18835 | 19 | 10511 | 16 |
| 4168.86327 | 0.64 | 9535 | 56 | 16511 | 17 | |
| 4620.60505 | 0.22 | 20535 | 40 | 6311 | 54 | |
| 5805.52158 | 0.66 | 13035 | 75 | 16511 | 6 | |
| W36 | 4160.79354 | 0.90 | 10032 | 27 | 20016 | 16 |
| 4167.79030 | 0.10 | 17032 | 25 | 11016 | 4 | |
| 4168.78891 | 0.41 | 16032 | 33 | 9516 | 10 | |
| 4174.78780 | 0.30 | 20032 | 3 | 17016 | 24 | |
| 4280.76847 | 0.61 | 10032 | 25 | 20016 | ||
| 4282.66772 | 0.21 | 18032 | 19 | 16516 | 34 | |
| 4708.56044 | 0.09 | … | … | 10016 | 0 | |
| 4710.55897 | 0.72 | 10032 | 27 | 27016 | 5 | |
| W13 | 4160.77158 | 0.88 | … | … | 15513 | 7 |
| 4167.76394 | 0.64 | 8523 | 16 | 19013 | 20 | |
| 4168.76923 | 0.74 | 14523 | 2 | 21013 | 1 | |
| 4174.76249 | 0.39 | 18023 | 7 | 1313 | 7 | |
| 4279.61631 | 0.71 | … | … | 23013 | 28 | |
| 4280.58040 | 0.81 | … | … | 18013 | 17 | |
| 4281.62310 | 0.92 | … | … | 12513 | 6 | |
| 4708.48711 | 0.99 | … | … | 9513 | 19 | |
| 4710.48815 | 0.20 | 25023 | 11 | 7513 | 8 | |
| WR77o | 4160.84107 | 0.98 | … | … | 25 30 | 58 |
| 4167.83559 | 0.97 | … | … | 15 30 | 97 | |
| 4168.82036 | 0.25 | … | … | 290 30 | 35 | |
| 4174.82619 | 0.95 | … | … | 35 30 | 108 | |
| 4282.49396 | 0.54 | … | … | 230 30 | 100 | |
| 4620.66407 | 0.61 | … | … | 340 30 | 74 | |
| 4708.52114 | 0.57 | … | … | 250 30 | 61 | |
| 4710.51970 | 0.14 | … | … | 255 30 | 13 |
Each synthetic spectrum was constructed as a sum of two models, each shifted over a range of radial velocities with a velocity step of 5 km s-1. We used TLUSTY models from the OSTAR2002 by Lanz & Hubeny (2003) and BSTAR2006 by Lanz & Hubeny (2007) grids for the components of each OB-type system. The parameters of the synthetic spectra for each system were selected to reproduce the observed spectra and the rotational velocities () were adopted to be 80 km s-1 and 110 km s-1 for the cooler and the hotter star of WDEB, respectively, and 110 km s-1 for the components of W36 and W13. We inverted the TLUSTY model in order to match the emission line component of W13. Whilst this approach might seem somewhat unusual, it turned out to provide more stable results than a two Gaussian fit. The was computed as the quadratic sum of the differences between the observed and the synthetic spectrum for a range of radial velocities. We computed the minimization using 60 centered on each of the two available narrow helium lines (), which yield more accurate radial velocities compared to the broader hydrogen lines. For WR77o, we used a WNE (early type) PoWR model (Gräfener et al. 2002; Hamann & Gräfener 2003, 2004). Each PoWR model depends on two parameters: the stellar temperature T* and the transformed radius (defined by Schmutz et al. 1992) which takes into account the stellar radius, the mass–loss rate and the terminal–wind velocity. We adopted a model with a stellar temperature of T* = K and transformed radius and computed the minimization using 140 Å centered on the N IV line. The resulting velocities and errors for all four systems are given in Table 2. The fit producing the lowest yielded the best fit model of the grid, and therefore the radial velocities for each component. The errors were determined using the values, which were the mean values of the difference between the data and the model radial velocity curves determined in the following section. Figure 1 shows representative examples of the model fit to the observed spectra for each binary system, illustrating the good quality of the fit.
4 Binary modeling
With the radial velocity measurements at hand, we proceeded to fit the and band light curves published by Bonanos (2007) and the radial velocity curves using the PHOEBE interface (Prša & Zwitter 2005) to the Wilson-Devinney code (WD; Wilson & Devinney 1971). For all the binaries, we used the square root limb–darkening law, which works better for hot stars at optical wavelengths. Bolometric and passband limb–darkening coefficients were taken from the in–house computed limb–darkening PHOEBE 2011 tables. We fixed albedos and gravity brightening exponents to unity from theoretical values for stars with radiative envelopes.
The errors for each parameter were determined with the phoebe–scripter, following Bonanos (2009). The script uses the WD differential corrections algorithm to perform the minimization for the input values, adopts the minimizer results by applying the corrections to the parameter table and repeats these steps 1000 times. By calculating the minimization for each iteration we end up with statistics from which the errors for each parameter can be determined.
Below we discuss each system separately and present the resulting orbital and astrophysical parameters of the components.


4.1 WDEB
The Westerlund 1 detached eclipsing binary (WDEB222RA=16:46:58.78, Dec=45:54:31.9, J2000) is a double-lined, eccentric, detached system with a period of 4.4473 d. WDEB is located 4 south of the cluster core, but its colors are similar to those of the other cluster stars, a fact that indicates that this binary is a member of Wd 1. The components of WDEB were the first main sequence stars to be identified in Westerlund 1 (Bonanos 2007) and as such, their parameters can be compared to models of single star evolution and be used to estimate the age of the cluster.
We obtained the first spectra for this system, which reveal an OB spectral type and confirm cluster membership. However, given the wavelength range available, a more accurate determination of their exact spectral types and effective temperatures was not possible. We therefore adopted a temperature of in the analysis below as a starting point for our fitting. The few useful spectra (four) that we could work with, provide us with parameters that suffer from large errors ().
| Parameter | Value |
|---|---|
| Period, | 4.4473 0.0004 |
| Time of primary eclipse, HJD0 | 2453934.741 0.003 |
| Inclination, | 86 2 |
| Eccentricity, | 0.175 0.003 |
| Longitude of periastron, | 252 1 |
| Surface potential, | 5.9 0.1 |
| Surface potential, | 6.50 0.06 |
| Light ratio in , | 0.499 0.005 |
| Light ratio in , | 0.501 0.005 |
| Light ratio in , | 0.505 0.005 |
| Mass ratio, | 0.80 0.07 |
| Systemic velocity, | |
| Semi-major axis, | |
| Semi-amplitude, | |
| Semi-amplitude, | |
| Radius†, | 0.202 0.006 |
| ………… | 0.208 0.007 |
| ………… | 0.203 0.006 |
| ………… | 0.206 0.007 |
| ………… ∗ | 0.204 0.006 |
| Radius†, | 0.154 0.005 |
| ………… | 0.157 0.006 |
| ………… | 0.155 0.006 |
| ………… | 0.157 0.006 |
| ………… ∗ | 0.156 0.006 |
| Notes: | |
| The radii are given in units of a. | |
| Mean radius. |
We ran PHOEBE, using the three light curves and the radial velocity curves, in the detached mode for the following free parameters: the inclination i, eccentricity e, the argument of periastron , the semi-major axis , the radial velocity of the center of mass , the surface potential for each star , the mass ratio q=M2/M1, the effective temperature , the period P, the time of primary eclipse HJD0 and the band pass luminosity for each band. We first fit the light curve to estimate P, HJD0, e, , i, for each star, then fixed these values and fit the radial velocity curve separately to estimate q, and .
For a detached, eccentric system with partial eclipses such as WDEB, the ratio of radii cannot be constrained only by photometry, so we used the spectroscopic light ratio to determine the primary to be the larger and hotter star. Following North et al. (2010), we next ran PHOEBE keeping the surface potential for the secondary component constant and then similarly determined the surface potential for the primary component, while we adopted the value for q that was determined from the radial velocity curve. After the initial fit to the light curves and the radial velocity curve, we iteratively refit the light curves and subsequently the radial velocity curve, until the values converged. The last step was to run PHOEBE for all the free parameters described above, but keeping q and fixed. Table 3 presents the parameters resulting from the analysis with PHOEBE. The light and radial velocity curve fits are shown in Figure 2 and 3, respectively. The primary star, corresponding to the hotter component, was found to have a mass of and radius of while the secondary was found to have and . The values of the two stars were found to be which confirms the main sequence nature of the components. In addition, the systemic velocity of = 40 km s-1, which is similar to that measured for the other three systems, provides further evidence for the membership of WDEB to the cluster. Table 7 presents the physical parameters (mass, radius, , and ) derived for each eclipsing binary.

4.2 W36
W36333RA=16:47:05.08, Dec=45:50:55.1, J2000 is the second brightest of our targets, with no previous spectroscopy available. It is a contact double-lined eclipsing binary in a circular orbit with a period of 3.1811 d. The spectra of this system indicate that the components are of spectral type OB. As was the case for WDEB, the determination of their exact spectral types and thus of their accurate temperatures was not possible.
We ran PHOEBE, using the three light curves and the radial velocity curves, in the contact mode for the following free parameters: the inclination i, the semi-major axis , the radial velocity of the center of mass , the surface potential for the primary star , the mass ratio q, the effective temperature of each star , the period P, the time of primary eclipse HJD0 and the band pass luminosity / for each band. Table 4 presents the parameters resulting from the analysis with PHOEBE. The radial velocity and light curves are shown in Figure 4 and 5, respectively.

The primary star of this system was found to have a mass of 16 M⊙ and radius of 11 R⊙, while the secondary has 11 M⊙ and 9 R⊙ (see Table 7). Since it is a contact system the masses that were determined are not the initial masses, as mass transfer has occurred. Values of found for both stars also testify to the evolved nature of the two stars.
| Parameter | Value |
|---|---|
| Period, | 3.18110 0.00003 |
| Time of primary eclipse, HJD0 | 2453909.8080 0.0005 |
| Inclination, | 73.0 1.7 |
| Surface potential, | 3.29 0.03 |
| Surface potential, | 3.28 (fixed) |
| Light ratio in , | 0.514 0.005 |
| Light ratio in , | 0.507 0.005 |
| Light ratio in , | 0.504 0.005 |
| Mass ratio, | 0.69 0.03 |
| Systemic velocity, | |
| Semi-major axis, | |
| Semi-amplitude, | |
| Semi-amplitude, | |
| Radius†, | 0.378 0.003 |
| ………… | 0.47 0.01 |
| ………… | 0.398 0.003 |
| ………… | 0.423 0.004 |
| ………… ∗ | 0.400 0.004 |
| Radius†, | 0.316 0.003 |
| ………… | 0.40 0.01 |
| ………… | 0.330 0.004 |
| ………… | 0.357 0.005 |
| ………… ∗ | 0.334 0.005 |
| Notes: | |
| The radii are given in units of a. | |
| Mean radius. |
4.3 W13
W13444RA=16:47:06.46, Dec=45:50:26.0, J2000 is our brightest target: a near–contact double–lined eclipsing binary in a circular orbit with a period of 9.266 d. The spectra indicate an emission plus absorption line object, consistent with the spectral types B0.5Ia+/WNVL and O9.5-B0.5I, respectively, reported by the independent study of the system by Ritchie et al. (2010). The known spectral types provide additional constraints to determine the fundamental parameters of each component. In addition, the well determined temperatures of the members of W13 make this system the best available eclipsing binary in Wd 1 for a direct distance determination.
We ran PHOEBE, using only the less noisy -band light curve and the radial velocity curves, in the detached mode, as the components are not filling the Roche lobes, for the following free parameters: i, , , , q, P, HJD0, and . Our radial velocity curves contain both our own RV measurements plus those made by Ritchie et al. (2010). Table 5 presents the parameters resulting from the analysis with PHOEBE.
| Parameter | Value |
|---|---|
| Period, | 9.2665 0.0003 |
| Time of primary eclipse, HJD0 | 2453902.3998 0.0002 |
| Inclination, | 61 2 |
| Surface potential, | 4.6 0.2 |
| Surface potential, | 5.6 0.2 |
| Light ratio in , | 0.822 0.005 |
| Mass ratio, | 1.42 0.04 |
| Systemic velocity, | (fixed) |
| Systemic velocity, | (fixed) |
| Semi-major axis, | |
| Semi-amplitude, | |
| Semi-amplitude, | |
| Radius†, | 0.31 0.01 |
| ………… | 0.37 0.04 |
| ………… | 0.32 0.02 |
| ………… | 0.34 0.02 |
| ………… ∗ | 0.32 0.02 |
| Radius†, | 0.29 0.03 |
| ………… | 0.31 0.03 |
| ………… | 0.30 0.03 |
| ………… | 0.31 0.03 |
| ………… ∗ | 0.30 0.03 |
| Notes: | |
| The radii are given in units of a. | |
| Mean radius. |
The values for the effective temperatures were taken from Ritchie et al. (2010) and correspond to the spectral types they determined. More specifically, was fixed to 25 000 K and we let be a free parameter with a starting value of 25 000 K. The light and radial velocity curves are shown in Figure 6 and 7, respectively.


Moreover, for our analysis we adopted the velocities for each component (em = 48 km s-1, abs = 66 km s-1) as found by Ritchie et al. (2010), and we transferred the whole system to 0 velocity by adjusting the measured velocities according to the values above, since PHOEBE does not provide this option. In massive binaries, stellar winds can cause the measured to differ for each star (Massey & Conti 1977). This fact is highly correlated to outward atmospheric mass motion and given that the components are supergiants, it was important to include this effect.
The component that is responsible for the emission in our spectra was determined to have 23 1 M⊙, 23 2 R⊙ and a filling factor , values that are in agreement, although more precise than the values independently determined by Ritchie et al. (2010): 23.2 M⊙, 22 2 R⊙ and . The component that causes the absorption in our spectra was determined to have 33 2 M⊙, 21 2 R⊙ and , compared to the values found by Ritchie et al. (2010): 35.4 M⊙, 21 2 R⊙ and . The high values of filling factors of the two components, make W13 a near–contact system. It is worth mentioning that our RV measurements alone yielded results very close to those above, with the star that causes the emission having a mass of 23 2 M⊙ and radius of 22 2 R⊙ and the one that causes the absorption having 32 2 M⊙ and 23 2 R⊙. Furthermore we determined an inclination i = 61 2° , which is in good agreement with the value 62 4° that was determined from the binned light curve by Ritchie et al. (2010). The fact that we have almost doubled the number of RV measurements is the main reason that we determined a more accurate, but lower mass ratio q = 1.42 0.04 comparing to that of 1.53 0.1 determined by Ritchie et al. (2010). Finally, we improved the accuracy in the determination of the period to P = 9.2665 0.0003 d compared to = 9.2709 0.0015 d determined by Ritchie et al. (2010).
4.4 WR77o
WR77o555RA=16:47:05.37, Dec=45:51:04.7, J2000 is a single–lined eclipsing binary in a circular orbit with a period of 3.52 d. The star that is visible in our spectra, is a Wolf–Rayet star, reported to have a spectral type WN6-7 (Negueruela & Clark 2005), and later refined to WN7o (Crowther et al. 2006).
For a single-lined spectroscopic binary, one can only determine the mass function of the system:
| (1) |
where K2 is the velocity semi-amplitude of the visible component. We first modelled the light curves with PHOEBE, for an estimation of the parameters and . Having determined these values, we estimated the mass function from and found:
| (2) |
This large value implies a very large mass for the invisible component. If we further assume a mass of the Wolf Rayet star as determined by Crowther et al. (2006) for this system from the mass-luminosity relation of Schaerer & Maeder (1992) for hydrogen–free Wolf–Rayet stars, we end up with a third degree equation, the solution of which gives us the result of for the companion star.
| Parameter | Value |
|---|---|
| Period, | 3.520 0.003 |
| Time of primary eclipse, HJD0 | 2453935.634 0.003 |
| Inclination, | 65 3 |
| Surface potential, | 3.47 0.03 |
| Surface potential, | 2.78 0.03 |
| Light ratio in , | 0.258 0.005 |
| Light ratio in , | 0.250 0.005 |
| Semi-amplitude, | |
| Mass ratio, | 0.37 (fixed) |
| Systemic velocity, | |
| Semi-major axis, | |
| Radius†, | 0.32 0.02 |
| ………… | 0.33 0.03 |
| ………… | 0.32 0.02 |
| ………… | 0.33 0.03 |
| ………… ∗ | 0.32 0.03 |
| Radius†, | 0.24 0.02 |
| ………… | 0.28 0.03 |
| ………… | 0.25 0.01 |
| ………… | 0.27 0.02 |
| ………… ∗ | 0.25 0.02 |
| Notes: | |
| The radii are given in units of a. | |
| Mean radius. |
We can continue with this preliminary analysis to constrain some of the parameters and find a more robust solution using PHOEBE. Using the following values from Crowther (2007): and = 50 000 K for a WN7 spectral type Wolf–Rayet star, we find the radius of the star to be R⊙.
We ran PHOEBE using the and band light curves and the radial velocity curve of the secondary component, in the detached mode, for the following free parameters: i, , , , , P, HJD0 and . The eccentricity was fixed to 0 and the mass ratio q to 0.37, as determined above.
Table 6 presents the parameters resulting from the analysis with PHOEBE, which yielded a stable solution in agreement with our original estimates. The light and radial velocity curves are shown in Figure 8.
The Wolf-Rayet star was found to have 16 M⊙ and 9.7 R⊙ while the primary companion 43 M⊙ and 12.3 R⊙. The of the Wolf-Rayet star was found to be which is quite close to the expected one for its type. Even though the companion is characterized by a higher ( K) and a larger mass and radius, it is not visible in our spectra due to the low S/N, which adversely affects absorption lines. The high values of the filling factors, and , respectively, indicate a post–mass transfer system.
Wolf–Rayet stars are intrinsically variable, therefore part of the observed scatter in the light curve is due to this effect. Modeling, which also takes into account atmospheric effects (e.g. Perrier et al. 2009), would possibly improve the fit and yield more accurate parameters. Furthermore, a more precise determination of the period would likely correct the slight phase shift of the radial velocity curve with respect to the model. We conclude that due to all the assumptions made for WR77o, the estimated parameters should be used with caution.
| Parameter | WDEB | W36 | W13 | WR77o |
|---|---|---|---|---|
| M1 (M⊙) | 14.8 3.5 | 16.3 1.5 | 23.1 1.1 | 43.4 6.8 |
| M2 (M⊙) | 11.9 1.8 | 11.3 1.8 | 32.9 1.9 | 16.1 2.5 |
| R1 (R⊙) | 6.9 2.0 | 11.0 1.2 | 23.0 1.5 | 12.3 2.0 |
| R2 (R⊙) | 5.3 2.0 | 9.2 1.2 | 21.3 1.5 | 9.7 2.0 |
| logg1 | 3.93 0.27 | 3.57 0.10 | 3.08 0.06 | 3.89 0.16 |
| logg2 | 4.07 0.33 | 3.56 0.13 | 3.30 0.05 | 3.67 0.19 |
| 29 000 580 | 30 000 1 500 | 25 000 (fixed) | 64 000 5 000 | |
| 27 000 570 | 25 500 2 900 | 25 000 1 000 | 44 000 4 500 | |
| log | 4.48 0.25 | 5.19 0.13 | 5.27 0.06 | 6.36 0.20 |
| log | 4.13 0.33 | 4.51 0.23 | 5.21 0.09 | 5.50 0.25 |
5 Evolutionary status
For a comparison of our measured parameters with evolutionary models, we used the models of Ekström et al. (2012), for single stars in the range at solar metallicity (Z=0.014), which include rotation. These evolutionary models are not appropriate for post mass-transfer binaries, however we proceed with the comparison, as it provides useful information, while computing binary evolution models is outside the scope of this work. Figure 9 compares the parameters of each binary (masses vs. radii) with evolutionary tracks and isochrones for single rotating stars at solar metallicity, while Figure 10 plots them on an H-R diagram.


The position of the components of W36 on the mass-radius diagram (Figure 9) indicates an age of 10 Myr for the secondary, while the discrepancy is smaller in the H-R diagram. The apparent conflict with previous studies that find an age of 4.5–5 Myr (Crowther et al. 2006) can be resolved by considering that W36 is a contact binary, which has undergone mass transfer. On the other hand, WDEB with its unevolved members of 15 M⊙ and 12 M⊙ is, in principle, ideal for estimating the age of the cluster. Its position on this diagram supports an age that is consistent within errors to previous studies, as detached unevolved systems can be treated as single stars. The position of the secondary of W13 also indicates a similar age for Wd 1. WR77o is not plotted in the diagram since we were unable to detect both stars spectroscopically to determine accurate parameters.
The position of the components of W36 on the H-R diagram (Figure 10) show that both stars appear overluminous for their mass, which provides further evidence that the system has undergone mass transfer. North et al. (2010) have also reported instances of non–detached eclipsing systems whose components appear overluminous or underluminous for their mass when compared with tracks for single stars. The position of WDEB is in good agreement with the single star models although the current error bars do not allow a precise age estimation. Finally, the primary of W13 is in agreement with the models, while the secondary appears underluminous, once again providing evidence for mass transfer.
6 Distance to Westerlund 1
The distance to Westerlund 1 has previously been estimated to be kpc, using a variety of methods, e.g.: WR stars ( kpc; Crowther et al. 2006), H I observations ( kpc; Kothes & Dougherty 2007), OB supergiants ( kpc; Negueruela et al. 2010), and pre-main sequence stars ( kpc; Gennaro et al. 2011). Eclipsing binaries provide powerful tools for measuring independent and accurate distances to stellar clusters (e.g. Rauw et al. 2007) and nearby galaxies (e.g. Bonanos et al. 2006, 2011). The analysis of the four systems described in the previous sections therefore opens the way for direct, independent eclipsing binary distance measurements to Wd 1.
Of the four systems, W13 has the most accurately determined radii and effective temperatures, and so we proceed to compute the distance to Westerlund 1 based on this eclipsing binary. Ritchie et al. (2010) determined accurate spectral types for the components of W13: B0.5 Ia+/WNVL for the emission line component and O9.5B0.5I for the absorption line component, which correspond to a K. We adopted this conservative error for both components for the distance estimation. Using the radii resulting from our analysis, we compute and , and for the combined light: . The absolute magnitude of a star at a certain wavelength is given by:
| (3) |
where mag is the bolometric luminosity of the Sun and the bolometric correction. We used theoretical BC values from Martins et al. (2006), which are based on state-of-the-art CMFGEN model atmospheres (Hillier & Miller 1998). For an O9.5I star, the theoretical BC mag, which yields mag.
The optical out-of-eclipse magnitudes of W13 are , and (Bonanos 2007). Clark et al. (2010) found the band calibration of Bonanos (2007) to be offset to that of Clark et al. (2005), while the and band calibrations were in good agreement, and reported magnitudes for W13 of , corresponding to phase . For the distance estimation, we adopt the higher-quality photometry of Clark et al. (2005), obtained with a larger telescope and a conservative error of 0.04 mag in each band, which corresponds to the difference in the and band measurements.
The distance is estimated from the distance modulus equation:
| (4) |
where is the apparent band magnitude, and is the extinction. From the photometry of Clark et al. (2005) and adopting from Martins et al. (2006), we obtain mag, which yields mag (for ), in agreement with the average value found of mag found by Clark et al. (2005) for OB supergiants. Equation 4 therefore yields kpc, which is a very imprecise estimate due to the large uncertainty in , demonstrating that near–infrared photometry and an accurate determination of the extinction is essential for an accurate distance measurement.
We therefore proceed to use near–infrared photometry, which is less affected by dust extinction. The available 2MASS photometry of W13 (at an unknown phase) is 666The and bands only have upper limits., and we adopt a conservative error of 0.16 mag (the depth of W13 primary eclipse), i.e. mag.
For an O9.5I star, the theoretical BCJ mag, which yields mag. We use the following equation to estimate the distance:
| (5) |
We adopt (Indebetouw et al. 2005) and the average value for mag, determined toward the WR star “R” (or WR77q), a close neighbor of W13 away by Crowther et al. (2006). We note that Star “U” (or WR77s), also nearby, has mag, therefore we adopt a conservative error in of 0.1 mag. We find mag and derive a distance: kpc to W13, which is the first eclipsing binary distance to the cluster. This value with an accuracy of 15% is in good agreement with recent estimates, which is noteworthy as eclipsing binaries are reliable, direct and independent distance indicators. For future determinations of the true distance modulus () with better estimates of the extinction, we also report the value mag. The precision of our measurement can be improved to by: (a) future near–infrared photometry to unambiguously disentangle the extinction and reddening law toward W13, and (b) spectral energy distribution (SED) modeling to improve the temperature determination.
7 Discussion and conclusions
We have presented accurate (better than 15%) fundamental parameters of four massive eclipsing binaries in the young massive cluster Westerlund 1, confirming they are all cluster members and demonstrating once more the success of the survey strategy. The mass range found for the eight component stars is , and three of the systems (W13, W36 and WR77o) seem to be post mass-transfer binaries. Our results for W13 are in agreement with those presented in the independent study by Ritchie et al. (2010). We were able to improve the accuracy of the parameters of W13 and therefore provide confirmation on the dynamical constraint on the high progenitor mass () of the magnetar CSO J164710.2455216 (Muno et al. 2006) reported by Ritchie et al. (2010), which accounted for binary evolution. Such massive stars are believed to form black holes rather than neutron stars, at least in a single star scenario. However, a strong interaction, as that of mass stripping in a binary system, can change the progenitor mass range significantly, without causing any problem in our understanding of stellar evolution (Belczynski & Taam 2008). Our discovery of a massive component for WR77o is also significant as it will serve as a second dynamical constraint on the mass of the progenitor of the magnetar. Future high S/N spectra should reveal the massive component, which, combined with a new, higher quality light curve, will enable an accurate determination of the component masses.
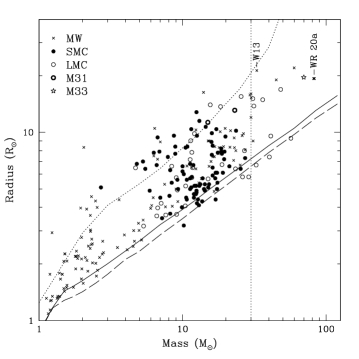
W13 is also noteworthy because the absorption component () fulfills the criteria set forth by Bonanos (2009) and increases the total number of very massive stars () with measurements from eclipsing binaries to 18. Figure 11 shows the updated mass radius diagram with eclipsing binary measurements accurate to 10% and complete . The slow rate of increase of this sample (one star per year) is a reflection of the difficulty of identifying very massive stars and obtaining follow-up observations. The availability of eclipsing binaries with accurate parameters now enables direct, independent eclipsing binary distance determinations to the cluster. We have used our results for W13 to estimate the first eclipsing binary distance to the cluster and therefore the magnetar, finding a value of kpc, in agreement with previous determinations using other methods. Future near-infrared photometry, a better light curve, in addition to careful modelling of the SED has the potential to provide a measurement accurate to , which will be crucial for our comprehension of magnetars.
Lastly, we find , despite its distance from the core of the cluster, to have the same systemic velocity as the other eclipsing systems, indicating it was ejected due south. Future proper motion studies will determine the time of ejection and possible connection with other massive cluster stars located outside the core, such as the magnetar, luminous blue variable, WR77aa (T) and WR77b (N; see Crowther et al. 2006), possibly indicating frequent ejections of stars from the cluster core, as was reported for Westerlund 2 (Roman-Lopes et al. 2011).
In conclusion, we note that young massive clusters remain largely unexplored regarding their binary star content, although binaries are extremely useful tools for providing constraints for models of evolution and formation for single and binary stars, at a range of metallicities. In particular for Wd 1, we have used the four known eclipsing binaries to obtain fundamental parameters for eight massive stars and to derive the first independent distance determination to the cluster.
Acknowledgements.
The authors thank Rodolfo Barba for obtaining the IMACS observations, Jose L. Prieto for obtaining a spectrum of WDEB with Magellan in September 2011. We also thank the referee, Gregor Rauw, for a careful reading of the manuscript and for providing helpful comments and suggestions that improved the paper. AZB acknowledges research and travel support from the Carnegie Institution of Washington through a Vera Rubin Fellowship in 2005-2008. EK and AZB acknowledge research and travel support from the European Commission Framework Program Seven under the Marie Curie International Reintegration Grant PIRG04-GA-2008-239335.References
- Andersen (1991) Andersen, J. 1991, A&A Rev., 3, 91
- Belczynski & Taam (2008) Belczynski, K. & Taam, R. E. 2008, ApJ, 685, 400
- Bernstein et al. (2003) Bernstein, R. et al. 2003, in SPIE, Vol. 4841, pp. 1694-1704, ed. M. Iye & A. F. M. Moorwood
- Bonanos (2007) Bonanos, A. Z. 2007, AJ, 133, 2696
- Bonanos (2009) Bonanos, A. Z. 2009, ApJ, 691, 407
- Bonanos (2010) Bonanos, A. Z. 2010, in ASP Conf. Ser., Vol. 425, Hot and Cool: Bridging Gaps in Massive Star Evolution, ed. C. Leitherer, P. Bennett, P. Morris, & J. van Loon (San Francisco: ASP), 31
- Bonanos et al. (2011) Bonanos, A. Z., Castro, N., Macri, L. M., et al. 2011, ApJ, 729, L9
- Bonanos et al. (2006) Bonanos, A. Z., Stanek, K. Z., Kudritzki, R. P., et al. 2006, ApJ, 652, 313
- Clark & Negueruela (2004) Clark, J. S. & Negueruela, I. 2004, A&A, 413, L15
- Clark et al. (2005) Clark, J. S., Negueruela, I., Crowther, P. A., et al. 2005, A&A, 434, 949
- Clark et al. (2010) Clark, J. S., Ritchie, B. W., & Negueruela, I. 2010, A&A, 514, A87
- Crowther (2007) Crowther, P. A. 2007, ARA&A, 45, 177
- Crowther et al. (2006) Crowther, P. A., Hadfield, L. J., Clark, J. S., et al. 2006, MNRAS, 1067
- Dressler et al. (2011) Dressler, A., Bigelow, B., Hare, T., et al. 2011, PASP, 123, 288
- Ekström et al. (2012) Ekström, S., Georgy, C., Eggenberger, P., et al. 2012, A&A, 537, A146
- Gennaro et al. (2011) Gennaro, M., Brandner, W., Stolte, A., & Henning, T. 2011, MNRAS, 412, 2469
- Gräfener et al. (2002) Gräfener, G., Koesterke, L., & Hamann, W.-R. 2002, A&A, 387, 244
- Hamann & Gräfener (2003) Hamann, W.-R. & Gräfener, G. 2003, A&A, 410, 993
- Hamann & Gräfener (2004) Hamann, W.-R. & Gräfener, G. 2004, A&A, 427, 697
- Hillier & Miller (1998) Hillier, D. J. & Miller, D. L. 1998, ApJ, 496, 407
- Indebetouw et al. (2005) Indebetouw, R., Mathis, J. S., Babler, B. L., et al. 2005, ApJ, 619, 931
- Kelson (2003) Kelson, D. D. 2003, PASP, 115, 688
- Kelson et al. (2000) Kelson, D. D. et al. 2000, ApJ, 531, 159
- Kothes & Dougherty (2007) Kothes, R. & Dougherty, S. M. 2007, A&A, 468, 993
- Lanz & Hubeny (2003) Lanz, T. & Hubeny, I. 2003, ApJS, 146, 417
- Lanz & Hubeny (2007) Lanz, T. & Hubeny, I. 2007, ApJS, 169, 83
- Martins et al. (2006) Martins, F., Trippe, S., Paumard, T., et al. 2006, ApJ, 649, L103
- Massey & Conti (1977) Massey, P. & Conti, P. S. 1977, ApJ, 218, 431
- Muno et al. (2006) Muno, M. P., Clark, J. S., Crowther, P. A., et al. 2006, ApJ, 636, L41
- Negueruela & Clark (2005) Negueruela, I. & Clark, J. S. 2005, A&A, 436, 541
- Negueruela et al. (2010) Negueruela, I., Clark, J. S., & Ritchie, B. W. 2010, A&A, 516, A78
- North et al. (2010) North, P., Gauderon, R., Barblan, F., & Royer, F. 2010, A&A, 520, A74
- Perrier et al. (2009) Perrier, C., Breysacher, J., & Rauw, G. 2009, A&A, 503, 963
- Prša & Zwitter (2005) Prša, A. & Zwitter, T. 2005, ApJ, 628, 426
- Rauw et al. (2007) Rauw, G., Manfroid, J., Gosset, E., et al. 2007, A&A, 463, 981
- Ritchie et al. (2010) Ritchie, B. W., Clark, J. S., Negueruela, I., et al. 2010, A&A, 520, A48
- Roman-Lopes et al. (2011) Roman-Lopes, A., Barba, R. H., & Morrell, N. I. 2011, MNRAS, 416, 501
- Schaerer et al. (1993) Schaerer, D., Charbonnel, C., Meynet, G., Maeder, A., & Schaller, G. 1993, A&AS, 102, 339
- Schaerer & Maeder (1992) Schaerer, D. & Maeder, A. 1992, A&A, 263, 129
- Schaller et al. (1992) Schaller, G., Schaerer, D., Meynet, G., & Maeder, A. 1992, A&AS, 96, 269
- Schmutz et al. (1992) Schmutz, W., Leitherer, C., & Gruenwald, R. 1992, PASP, 104, 1164
- Stroud et al. (2010) Stroud, V. E., Clark, J. S., Negueruela, I., et al. 2010, A&A, 511, A84
- Torres et al. (2010) Torres, G., Andersen, J., & Giménez, A. 2010, A&A Rev., 18, 67
- Wilson & Devinney (1971) Wilson, R. E. & Devinney, E. J. 1971, ApJ, 166, 605