Astrophysical objects observed by the MESSENGER X-ray spectrometer during Mercury flybys
Abstract
The MESSENGER spacecraft conducted its first flyby of Mercury on 14th January 2008, followed by two subsequent encounters on 6th October 2008 and 29th September 2009, prior to Mercury orbit insertion on 18th March 2011. We have reviewed MESSENGER flight telemetry and X-ray Spectrometer observations from the first two encounters, and correlate several prominent features in the data with the presence of astrophysical X-ray sources in the instrument field of view. We find that two X-ray peaks attributed in earlier work to the detection of suprathermal electrons from the Mercury magnetosphere, are likely to contain a significant number of events that are of astrophysical origin. The intensities of these two peaks cannot be explained entirely on the basis of astrophysical sources, and we support the previous suprathermal explanation but suggest that the electron fluxes derived in those studies be revised to correct for a significant astrophysical signal.
keywords:
Mercury , MESSENGER , X-ray spectrometry , X-ray emissions , Astrophysical sources1 Introduction
On March 18th 2011 the MErcury Surface, Space ENvironment, GEochemistry, and Ranging (MESSENGER) spacecraft became the first probe to orbit the planet Mercury. Launched on August 3rd 2004, MESSENGER’s trajectory included six gravity-assist manoeuvres: one flyby of Earth (August 2nd 2005), two of Venus (October 24th 2006 and June 5th 2007), followed by three flybys of Mercury, on January 14th and October 6th 2008, and September 29th 2009. A detailed description of the mission is given by Solomon et al. (2001, 2007). A review of the first Mercury encounter is given by Solomon et al. (2008), and a brief summary of the emerging view of Mercury after the three flybys is presented by Solomon et al. (2010).
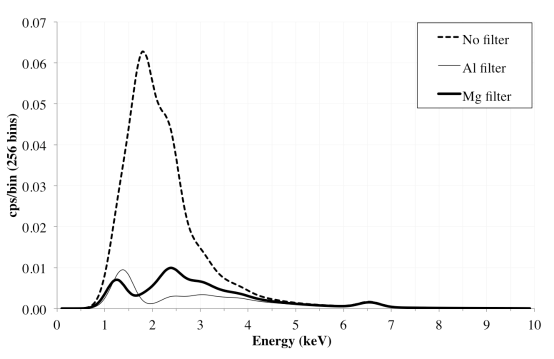
The MESSENGER payload includes an X-ray spectrometer (XRS) for measurement of the planet’s surface elemental composition. Schlemm et al. (2007) provide full details of the instrument, which is based around three separate Gas Proportional Counter (GPC) units filled with a P10 Argon-Methane mixture at 0.15 MPa (1.5 bar). In order to distinguish between characteristic X-ray lines of the major rock forming elements, and allow quantitative analysis of surface elemental abundances, one GPC carries a 4.5m-thick Mg filter, one has a 6.3m Al filter, and the third GPC is unfiltered.
The XRS was active during all three Mercury flybys, and a number of X-ray emission features were observed during the encounters. Ho et al. (2011a) present a detailed analysis of several features of particular interest, attributing some to astrophysical sources, and some to the detection of suprathermal plasma electrons originating in Mercury’s magnetosphere. Schriver et al. (2011) describe simulations and laboratory work on electron transport and acceleration in the Hermean magnetosphere and also interpret several X-ray features in the first and second flybys as the signature of suprathermal electrons. We give the times and durations of features considered by Ho et al. (2011a) (M1-E1, M2-E1, M2-E2 and M3-E1) in Table 1, and define four additional features (M1-B1, M1-B2, M1-B3 and M2-B1) which we have also considered in the present work.
Our analysis concentrates on the sensitivity of the XRS to bright astrophysical X-ray sources, and began as work conducted to support science planning activities for the Mercury Imaging X-ray Spectrometer (MIXS) instrument onboard ESA’s BepiColombo mission to Mercury, with which the authors are affiliated (Fraser et al., 2010). A detailed analysis of MESSENGER spacecraft attitude and XRS instrument pointing during the flybys has been conducted, generating a model of the passage of known bright X-ray sources through the field of view (FOV) as a function of time. Using measured instrument sensitivity data and a simple treatment of the angular variation of the collimator transmission function, the instrument count rates expected from these sources have been calculated and compared with measurements from the XRS. The final column of Table 1 summarises our conclusion for the origin of each feature based on the present work.
| Event | Date | Start Time | Duration | Origin |
|---|---|---|---|---|
| (UTC) | (sec) | |||
| M1-E1 | 14 Jan 08 | 18:59:49 | 180 | Electrons & astrophysical |
| M1-B1 | 14 Jan 08 | 19:20:12 | 300 | Astrophysical |
| M1-B2 | 14 Jan 08 | 19:26:40 | 800 | Astrophysical |
| M1-B3 | 14 Jan 08 | 19:41:00 | 1040 | Astrophysical |
| M2-E1 | 6 Oct 08 | 08:35:08 | 60 | Electrons & astrophysical |
| M2-E2 | 6 Oct 08 | 08:47:08 | 120 | Electrons |
| M2-B1 | 6 Oct 08 | 08:57:10 | 220 | Astrophysical |
| M3-E1 | 29 Sep 09 | 21:45:39 | 60 | Insufficient data, no clear |
| astrophysical source |
In Section 2 we describe the reconstruction of instrument pointing and FOV location. Section 3 summarises the assumptions made in estimating the count rates generated by each object in the field, and in Section 4 we consider the major XRS features from the first two flybys in detail, identifying correlations between observed X-ray peaks and the presence of bright sources in the field of view. In two features (M1-E1 and M2-E1) we find evidence to suggest that significant numbers of astrophysical source photons are contributing to the recorded flux, in addition to the proposed suprathermal electron element which we also support. The available XRS data for Flyby 3 are less detailed due to a safe-hold event which took place during the encounter, and a lower level of analysis has been conducted for that event, which we cover briefly in Section 5.
2 Spacecraft telemetry and field of view direction
The XRS observations considered in this work were obtained as calibrated data records from the Planetary Data System Geosciences Node hosted by Washington University in St. Louis (http://pds-geosciences.wustl.edu/missions/messenger/xrs.htm). Count rates measured by the three GPC channels are provided with 60 second time resolution in the periods around closest approach for each encounter. Full details of the calibrated data file structure are provided by Harshman (2010).
The attitude of MESSENGER was determined using the SPICE system produced by the NASA Navigation and Ancillary Information Facility (NAIF; Acton (1996)), which comprises spacecraft data and planetary ephemerides (both presented in data files referred to as “kernels”) and the SPICE computational toolkit. For each flyby, the direction cosine matrix corresponding to the transformation between MESSENGER spacecraft body axes and J2000 coordinates was generated, for each attitude data point, with a temporal resolution of 0.36 seconds. The results were verified by combining these data with a spacecraft ephemeris in Mercury Solar Orbital coordinates, generated from the same kernels. In each case, the time, distance and location of closest approach agreed with published values (Benna et al., 2010; Slavin et al., 2009). A list of the kernels used in this work can be found in A.
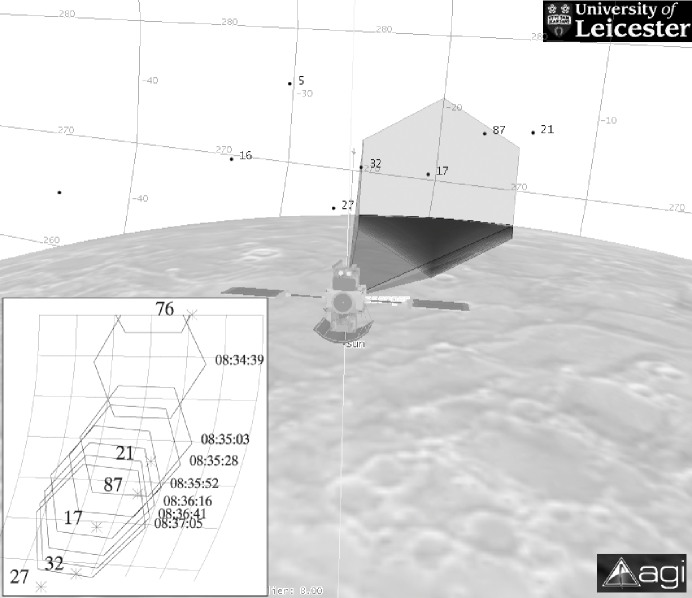
The MESSENGER XRS has a hexagonal FOV with a full-width-zero-maximum (measured from vertex to vertex) of 12∘, and a boresight aligned with the spacecraft +Z axis. The positions of the XRS FOV boresight and 6 perimeter points in the spacecraft frame are provided in the msgr_xrs_v001.ti kernel. These points were transformed into J2000 coordinates for each 0.36 second time interval, enabling precise mapping of the FOV onto the celestial sphere. In addition, spacecraft position and attitude data were imported into Analytical Graphics Inc.’s Satellite Tool Kit (STK)111http://www.stk.com, and a sensor with the hexagonal FOV and orientation of the XRS instrument was reproduced to provide a time-resolved visualisation of the field position. The orientation of the FOV with respect to the planet in our model was found to be consistent with the state of the FOV_STATUS flag in the XRS data. This flag characterises the contents of the FOV, and has five states: (0) no part of the planet in the field; (1) planet filling the field, at least part of footprint in sunlight; (2) planet filling the field, no portion in sunlight; (3) only part of the field includes the planet, at least one part of which is in sunlight, and (4) only part of the field includes the planet, with the imaged portion in darkness. The times at which the FOV made contact with the planet and crossed the dawn/dusk terminator in our simulation were in agreement with the status of this flag.
3 Source population & count rate estimation
3.1 The bright source sample
The astrophysical X-ray sources included in this study were taken from the ROSAT All Sky Survey Bright Source Catalogue (Voges et al., 1999) (hereafter RASSBSC). Using the electronic version of the catalogue hosted by the Leicester Database and Archive Service (LEDAS), the one hundred brightest sources as measured by the ROSAT Position Sensitive Proportional Counter (PSPC) were identified. The right ascension and declination of each object () were extracted from LEDAS and imported as a point source into STK. For a two hour period around the point of closest approach for each flyby, the identity of any of the sources within the FOV was determined, and the angular position of the source with respect to the instrument boresight recorded with 1 second time resolution.
3.2 Source count rates
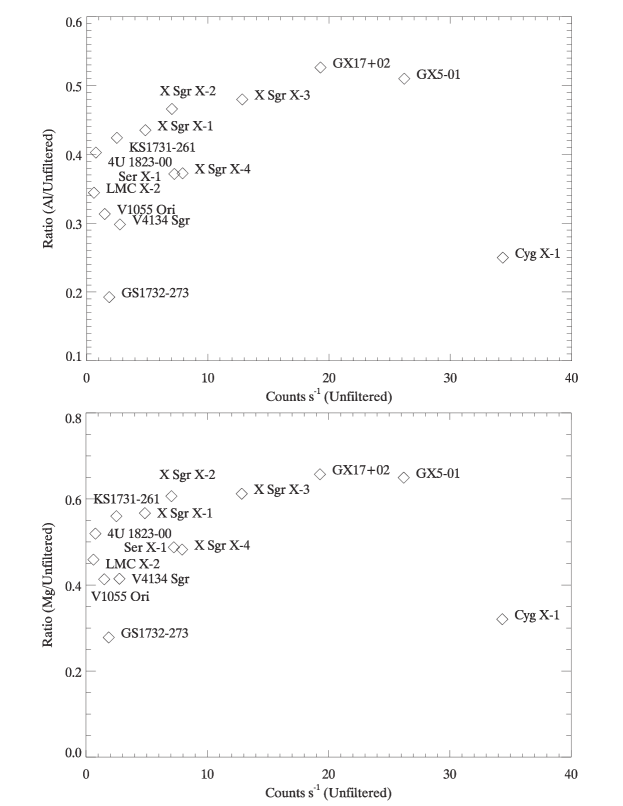
The MESSENGER XRS has a bandpass of 1 - 10 keV (Schlemm et al., 2007), significantly broader, and with a different effective area profile, than the 0.1 - 2.4 keV bandpass of the ROSAT PSPC (Pfeffermann et al., 1987). Given the wide range of source spectra represented in the RASSBSC sample, it is not possible to adopt a constant scaling factor to convert from ROSAT to MESSENGER count rates. We therefore estimated the photon event rates expected in the XRS by modelling source spectra with the XSPEC X-ray spectral analysis package, using best-fit spectral parameters found in the literature. The sources, their type and count rates from RASSBSC and the count rate predicted for the MESSENGER XRS (along with the references from which we obtained spectral parameters) are indicated in Table 2, while the spectral hardness of the sources is indicated by the Al:unfiltered and Mg:unfiltered channel count rate ratios shown in Figure 2.
Ground calibration data providing the effective areas of the Al, Mg and unfiltered XRS channels were available from the PDS222file XRS_GPC_MODELLED_RESPONSE and were used in this work. The variation in the collimator transmission function with angle was approximated as a triangular profile in which the observation efficiency was set to 1.0 at the centre of the field (representing on-axis sources), falling linearly to zero at an angle of 6∘ with respect to the instrument boresight.
Observations of Cas-A have been used to calibrate the instrument during flight, and Schlemm et al. (2007) show a spectrum of the object (Figure 13 in that work). We have modelled the Cas-A source spectrum using the broken power law + emission line model of Allen et al. (1997), and we find very close agreement between the predicted XRS observation (Figure 1) and the data of Schlemm et al..
4 Astrophysical sources in XRS data
Table 2 lists the sources found to enter the XRS FOV in the time periods of interest. Fifteen of the sources appear during the two hour time windows around each of the first two flybys which we consider in detail in this paper; one further source (Cyg X-1) is relevant to the discussion of Flyby 3 in Section 5.
| BSC | 1RXS-J Number | Name | Type | PSPC | XRS | ||
|---|---|---|---|---|---|---|---|
| Un | Al | Mg | |||||
| 5[1] | 182340.5-302137 | X Sgr X-4 | LMXB | 127.0 | 7.92 | 2.95 | 3.82 |
| 8[1] | 183956.9+050203 | Ser X-1 | LMXB | 69.62 | 7.24 | 2.69 | 3.53 |
| 11[6] | 195821.9+351156 | Cyg X-1 | HMXB | 61.25 | 34.33 | 8.58 | 11.00 |
| 13[1] | 061707.4+090812 | V1055 Ori | LMXB | 48.66 | 1.50 | 0.47 | 0.62 |
| 16[1] | 175840.1-334828 | V4134 Sgr | LMXB | 31.08 | 2.75 | 0.82 | 1.14 |
| 17[1] | 180132.3-203132 | X Sgr X-3 | LMXB | 30.92 | 12.84 | 6.16 | 7.86 |
| 18[2] | 173602.0-272541 | GS1732-273 | LMXB | 29.79 | 1.87 | 0.36 | 0.52 |
| 21[1] | 181601.2-140213 | GX17+02 | LMXB | 24.82 | 19.29 | 10.15 | 12.68 |
| 27[1] | 174755.8-263352 | X Sgr X-1 | LMXB | 19.2 | 4.85 | 2.11 | 2.75 |
| 32[1] | 180108.7-250444 | GX5-01 | LMXB | 17.78 | 26.20 | 13.36 | 17.02 |
| 35[3] | 173413.0-260527 | KS1731-261 | LMXB | 14.09 | 2.50 | 1.06 | 1.40 |
| 36[4] | 064509.3-164241 | Sirius B | WD | 12.73 | N/A | N/A | N/A |
| 37[1] | 052027.6-715755 | LMC X-2 | LMXB | 12.17 | 0.61 | 0.21 | 0.28 |
| 75[5] | 162909.4+780439 | WD1631+78 | WD | 5.66 | N/A | N/A | N/A |
| 76[1] | 182522.1-000038 | 4U 1823-00 | LMXB | 5.66 | 0.77 | 0.31 | 0.40 |
| 87[1] | 181431.6-170917 | X Sgr X-2 | LMXB | 4.88 | 7.04 | 3.28 | 4.27 |
The majority of the sources are low mass X-ray binary (LMXB) systems. White et al. (1985) describe a function of the form
| (1) |
which represents the unsaturated Comptonised spectrum of cool photons upscattered on hot photons, and which has been found to provide a good approximation to LMXB spectra. A survey of bright LMXBs observed with the Einstein observatory was conducted by Christian and Swank (1997) who present spectral parameters of this form for 49 LMXBs, including 11 of the objects of interest in the current work. We have used these parameters to model the LMXB spectra as observed by MESSENGER.
Two of the objects in our list (Sirius B and WD1631+78) are white dwarf stars. As a class of object, white dwarfs can exhibit a range of complex spectra due to heavy elements suspended in the atmosphere through the effects of radiation pressure. However, for the purposes of this study, it is sufficient to approximate the white dwarf spectrum as a blackbody with effective temperature . Holberg et al. (1998b) give K for Sirius B, and K for WD1631+78. Both objects are therefore capable of generating X-ray photons above the 0.1 keV lower limit of the RASSBSC bandpass, but are not significant sources of X-rays with energies above the 1.0 keV lower limit of the MESSENGER XRS. Spectra for Sirius B presented in e.g. Pease et al. (2000) and Beuermann et al. (2006) support this conclusion. O’Dwyer et al. (2003) list WD1631+78 as a source of “hard” ( keV) X-rays, probably from its unresolved dM4e companion star. Again, the indicated flux levels are extremely low in the MESSENGER XRS bandpass, and hence we ignore these objects in the model.
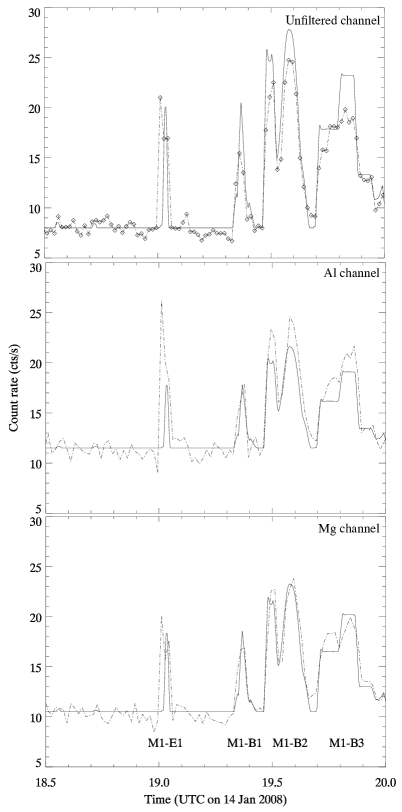
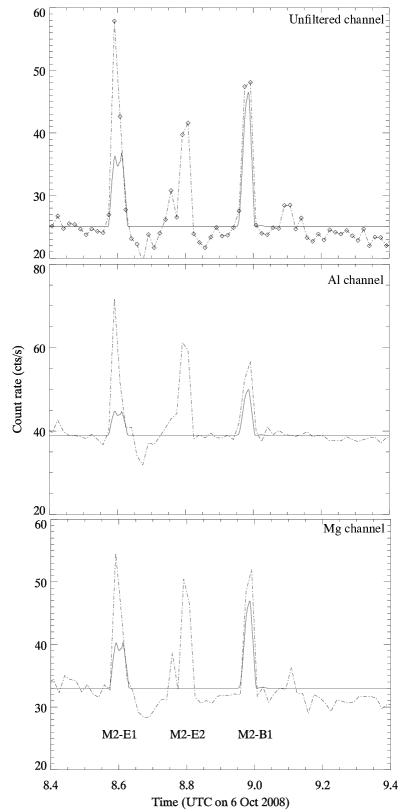
Table 2 shows the count rates expected in the XRS from each source. These values, combined with instrument response data, can be used to predict the XRS event rates due to astrophysical sources. Figures 3 and 4 show the count rate recorded in the three XRS channels (dotted lines) as a function of time as the FOV moves across the sky, compared with the count rates predicted by our model (solid line) for the first two flybys. The model has been smoothed to match the 60 second time resolution of the observational data. An offset of +50 seconds has been added to the XRS data for flyby 1, and +20 seconds for flyby 2. This correction is necessary to provide the optimum temporal correlation between observation and the model and is justified as it is smaller than the temporal resolution of the observed data. The magnitude of the correction was determined using the times of observed features that are of purely astrophysical origin. Instrument background levels were estimated from the average XRS count rate in each channel, evaluated over a three hour period immediately prior to each flyby (15:47:49 UTC to 18:45:49 UTC on 14th January 2008 for flyby 1, 05:25:08 UTC to 08:24:08 UTC on 6th October 2008 for flyby 2). The resulting background values were 8.2, 11.5 and 10.6 cts s-1 for the unfiltered, Al and Mg channels during flyby 1, and 25.9, 40.6 and 34.1 cts s-1, for the unfiltered, Al and Mg channels during flyby 2, respectively.
| Event | Star | Peak count rate | Total (%) | ||||||||
| (UTC) | (UTC) | (UTC) | (∘) | ||||||||
| M1-E1 | GX17+02 | 19:01:38 | 19:02:28 | 19:02:00 | 0.14 | 18.83 | 9.91 | 12.38 | 35.25 | 18.17 | 33.75 |
| X Sgr X-2 | 19:01:48 | 19:02:23 | 19:02:06 | 2.75 | 3.83 | 1.78 | 2.32 | 5.44 | 2.49 | 4.81 | |
| Ser X-1 | 19:01:02 | 19:01:09 | 19:01:05 | 4.94 | 1.30 | 0.48 | 0.63 | 0.52 | 0.19 | 0.37 | |
| 4U1823-00 | 19:01:06 | 19:01:28 | 19:01:17 | 1.62 | 0.56 | 0.23 | 0.29 | 0.46 | 0.18 | 0.35 | |
| M1-B1 | GX5-01 | 19:21:33 | 19:23:26 | 19:21:33 | 2.93 | 13.45 | 6.86 | 8.74 | 105.50 | 66.77 | 62.63 |
| X Sgr X-1 | 19:20:25 | 19:22:23 | 19:20:30 | 1.75 | 3.44 | 1.50 | 1.95 | 23.16 | 12.50 | 12.00 | |
| X Sgr X-4 | 19:23:42 | 19:25:29 | 19:23:42 | 3.60 | 3.18 | 1.19 | 1.54 | 20.46 | 9.46 | 9.02 | |
| GS1732-273 | 19:20:13 | 19:21:23 | 19:20:30 | 3.45 | 0.80 | 0.15 | 0.22 | 3.24 | 0.77 | 0.82 | |
| KS1731-261 | 19:20:17 | 19:20:51 | 19:20:30 | 4.32 | 0.71 | 0.30 | 0.40 | 1.89 | 1.00 | 0.97 | |
| M1-B2 | GX17+02 | 19:30:45 | 19:37:30 | 19:34:11 | 1.07 | 15.86 | 8.35 | 10.43 | 55.33 | 36.40 | 43.62 |
| GX5-01 | 19:28:13 | 19:30:41 | 19:30:11 | 2.78 | 14.10 | 7.19 | 9.62 | 26.84 | 17.11 | 20.91 | |
| X Sgr X-2 | 19:30:34 | 19:39:45 | 19:35:56 | 0.38 | 6.60 | 3.08 | 4.00 | 22.92 | 13.35 | 16.67 | |
| X Sgr X-3 | 19:28:21 | 19:39:38 | 19:30:41 | 1.25 | 10.19 | 4.89 | 6.24 | 18.31 | 10.99 | 13.44 | |
| M1-B3 | GX5-01 | 19:47:51 | 19:52:36 | 19:48:25 | 2.77 | 14.16 | 7.22 | 9.20 | 47.80 | 34.34 | 40.61 |
| X Sgr X-3 | 19:42:12 | 19:48:33 | 19:42:36 | 2.83 | 6.80 | 3.26 | 4.16 | 30.21 | 20.42 | 24.18 | |
| X Sgr X-4 | 19:41:44 | 19:58:20 | 19:52:35 | 2.53 | 4.59 | 1.71 | 2.22 | 20.57 | 10.80 | 12.98 | |
| X Sgr X-2 | 19:42:11 | 19:48:11 | 19:42:36 | 2.17 | 4.50 | 2.10 | 2.73 | 17.21 | 11.30 | 13.65 | |
| V4134 Sgr | 19:52:28 | 19:58:20 | 19:57:01 | 1.35 | 2.14 | 0.64 | 0.89 | 6.12 | 2.57 | 3.32 | |
| X Sgr X-1 | 19:52:14 | 19:52:22 | 19:52:20 | 5.59 | 0.35 | 0.15 | 0.20 | 0.04 | 0.02 | 0.03 | |
| M2-E1 | X Sgr X-3 | 08:35:43 | 08:37:14 | 08:37:14 | 0.97 | 10.77 | 5.17 | 6.59 | 22.24 | 13.20 | 23.07 |
| GX17+02 | 08:34:52 | 08:36:06 | 08:35:17 | 2.32 | 11.85 | 6.24 | 7.79 | 18.00 | 11.72 | 20.06 | |
| X Sgr X-2 | 08:35:03 | 08:37:29 | 08:36:01 | 3.83 | 2.57 | 1.20 | 1.56 | 9.08 | 5.23 | 9.34 | |
| GX5-01 | 08:37:02 | 08:37:16 | 08:37:16 | 4.87 | 5.03 | 2.57 | 3.27 | 1.99 | 1.26 | 2.19 | |
| 4U 1823-00 | 08:34:16 | 08:34:34 | 08:34:25 | 4.18 | 0.24 | 0.09 | 0.12 | 0.12 | 0.06 | 0.10 | |
| M2-B1 | GX5-01 | 08:57:53 | 08:59:47 | 08:59:31 | 0.44 | 24.3 | 12.39 | 15.79 | 74.21 | 58.73 | 77.95 |
| X Sgr X-4 | 08:57:35 | 08:58:28 | 08:57:53 | 3.97 | 2.70 | 1.01 | 1.30 | 3.95 | 2.29 | 3.08 | |
| KS1731-261 | 08:59:11 | 08:59:24 | 08:59:20 | 5.35 | 0.28 | 0.12 | 0.16 | 0.12 | 0.08 | 0.11 | |
| 4U1823-00 | 09:00:38 | 09:01:00 | 09:01:00 | 4.54 | 0.19 | 0.08 | 0.10 | 0.11 | 0.07 | 0.09 | |
For any given feature, the model rates in the Al and Mg channels depicted in Figures 3 and 4 are significantly lower than those in the unfiltered channel at the same instant, as expected on the basis of the filter transmission properties. However, for those features which are unambiguously attributed to astrophysical sources, we find that the difference between the observed rates in the unfiltered channel and those in the Al and Mg channels, after background subtraction, is smaller than predicted by the model. For example, the second (higher) peak in M1-B2 has background-subtracted observed count rates of approximately 16.8, 13.5 and 13.4 cts s-1 in the unfiltered, Al and Mg channels respectively, while the model count rates are approximately 19.8, 10.5 and 12.4 cts s-1, so that in the model, the unfiltered peak has almost twice the intensity of the filtered peaks. We suggest that this larger-than-observed difference between unfiltered and filtered channel rates in our model is due to the fact that the model excludes the generation of X-ray fluorescence photons in the filters. We find that the number of fluorescence photons predicted for a signal of the strength of M1-B2 is which, when added to the directly detected events in the model, is of the correct order to reduce the difference between filtered and unfiltered rates, making their ratios more similar to those of the three channels in the observed signal. Note, however, that fluorescence photons cannot explain the much more significant under-prediction of flux in the modelled M1-E1 and M2-E1 features, or the fact that the observed Al count rates exceed the unfiltered values in those features. A more detailed discussion of the production of fluorescence photons in the filters is provided in Section 6.2, in the context of the under-prediction of count rates for M2-E1.
The results of our model reveal significant correlations with observed features. We identify the contributing sources in Table 3, and discuss the events and sources below. Note that while the quoted value of in Table 3 corresponds to the count rate evaluated for the one-second time bin centred on , the plotted model data in Figures 3 and 4 have been smoothed to match the 60 second time resolution of the observations, which reduces the peak height and broadens the feature in the plots. We find that the model levels in the unfiltered channel for M1-E1 appear to be 20% higher than observed (as reflected in Figure 3 and Table 3) possibly due to over-estimation of, or change in, the background level at this time, but the agreement in Al and Mg channels is considerably better, and the similarity between XRS observations and the model is observed in all three channels during Flybys 1 and 2.
Unless otherwise stated, count rates quoted for objects in the following sections refer to those measured in the unfiltered channel.
4.1 M1-E1
This feature comprises at least two peaks, producing the stepped profile visible in Figure 3. Our model shows a significant astrophysical component for seconds starting near 19:00:50 UTC. The principal source is the LMXB GX17+02 contributing a maximum of 18.8 cts s-1, with additional flux from Sgr X-2 and minor contributions from Ser X-1 and 4U 1823-00. We discuss this event in detail in Section 6.1
4.2 M1-B1
The dominant source is GX5-01 ( cts s-1) followed by Sgr X-1 and Sgr X-4, each generating cts s-1. GS1732-273 also appeared in the field at this time, generating cts s-1. The sharp, stepped shape of this feature contrasts to other observations and is due to the fact that the sources were observed emerging from occultation behind the limb of Mercury following closest approach, so that the source is first observed near the centre of the FOV rather than entering from the field edge as would be the case for an unobstructed slew manoeuver.
4.3 M1-B2
At this time in the encounter, the XRS FOV was passing over a number of bright sources. The principal contributions in the first peak of this feature come from Sgr X-3 (2.1 cts s-1), GX17+02 (3.0 cts s-1), GX5-01 (5.3 cts s-1) and Sgr X-2 (1.4 cts s-1). The second peak is a revisit of these sources, except for GX5-01 which is not observed again.
4.4 M1-B3
The dominant sources in this feature are GX5-01 (peak count rate 5.0 cts s-1), Sgr X-3 (2.4 cts s-1), Sgr X-4 (1.7 cts s-1) and Sgr X-2 (1.6 cts s-1). Minor contributions come from V4134 Sgr (0.8 cts s-1) and Sgr X-1 (0.1 cts s-1). The XRS field scanned this area over an extended period of time, explaining the broad shape of this feature.
4.5 M2-E1
We find that this feature coincides very closely with the presence of two bright sources and two fainter objects in the FOV. The feature begins at 08:34:52 with the entry of GX17+02 into the field, producing a maximum of 4.2 cts s-1 at 08:35:17 UTC. 4U1823-00 and Sgr X-2 are minor contributors to the peak, at and cts s-1 respectively. At 08:35:43, as GX17+02 left the field, Sgr X-3 entered; the changing sum of fluxes from these two bright objects produces the local minimum in the centre of the modelled feature. GX5-01 entered the field at 08:37:02, generating a maximum of 1.8 cts s-1.
At this time, the slew rate of the field in the J2000 frame was very low. Sgr X-3 entered the field at an angular rate of less than 0.1∘ s-1. 90 seconds later, the object was within 1∘ of the FOV centre generating cts s-1, and the slew rate was less than 0.01∘ s-1. This feature occured immediately before the XRS FOV passed onto the planet, and the astrophysical sources were lost as they were occulted by the planet’s limb. Sgr X-3 was occulted at 08:37:14, and GX5-01 was lost two seconds later. We discuss this event in detail in Section 6.1
4.6 M2-E2
Our attitude data show that at the time of the M2-E2 event, the XRS FOV was entirely filled with a region of the planet near the terminator, in agreement with the FOV_STATUS flag in the telemetry files. Therefore there can be no astrophysical contributions to the events contained within this feature.
4.7 M2-B1
This feature is dominated by the presence of GX5-01 which contributes a maximum of 8.6 cts s-1, and Sgr X-3 (4.3 cts s-1). Weaker contributions come from Sgr X-1 and Sgr X-4, each at approximately 1.0 ct s-1 when closest to the FOV centre. Very low count rates ( cts s-1) are contributed by 4U1823-00 and KS1731-261.
5 Flyby 3 data
Our study has concentrated on the first and second MESSENGER flybys of Mercury. During the third flyby on 29th September 2009, the spacecraft experienced a safe-hold event immediately before the time of closest approach. Observations of significant scientific value were obtained during the inbound phase of the encounter (e.g. Slavin et al. (2010); Baker et al. (2011)), but the XRS data are relatively featureless until the appearance of an event referred to as M3-E1 by Ho et al. (2011a), beginning at 21:45:39 UTC and lasting for 60 seconds. Inspection of calibrated and experiment XRS data records for this flyby shows that the final data point in those files covers precisely the same period of time.
Our data show that at 21:48:33 UTC, Cyg X-1 entered the field of view and remained there for 55 seconds, but this time shift is too large to be permitted on the basis of the temporal resolution of the XRS data. The angular separation between XRS boresight and Cyg X-1 was of order at the time of the peak, and so no flux from the object can have leaked through the collimator. Thus, no astrophysical source can be identified to match the appearance of M3-E1; the nature of the observational data make more detailed analysis difficult to achieve.
6 Discussion
The majority of the XRS features considered in this work are clearly generated by astrophysical sources in the FOV; they are not considered by Ho et al. (2011a) for this reason, and we have included them here for completeness only. Of greater interest are the results for M1-E1 and M2-E1. Both are discussed by Ho et al. (2011a) who propose suprathermal electrons from the Hermean magnetosphere as their origin. We find that there is a significant correlation between these events and the count rate behaviour expected on the basis of our source modelling.
The spectra shown in this section were extracted from the PDS-sourced files using custom-written IDL code. The data, supplied as counts per bin per integration period, were converted to counts per 60 seconds as a function of energy using telemetry along with calibration data supplied at the PDS Geosciences Node. The plots were smoothed using a boxcar filter with a smoothing window of 23 channels, equivalent to the quotient of the energy resolution of XRS at 5.9 keV (880 eV; Schlemm et al. (2007)) and the energy width of the spectral bins (37.9 eV). We note that this filter is too wide at low energy, but is adequate for the current analysis.
6.1 M1-E1
This feature has an unusual shape consisting of two closely-spaced components, leading to a peak followed by a plateau of slightly lower count rate. The feature occurred while the spacecraft was executing a large slew near the time of closest approach. The FOV made contact with the planet’s limb at approximately 19:02:35 UTC, and was completely filled with the planet by 19:03:20 UTC. The time of closest approach was 19:04:13 UTC.
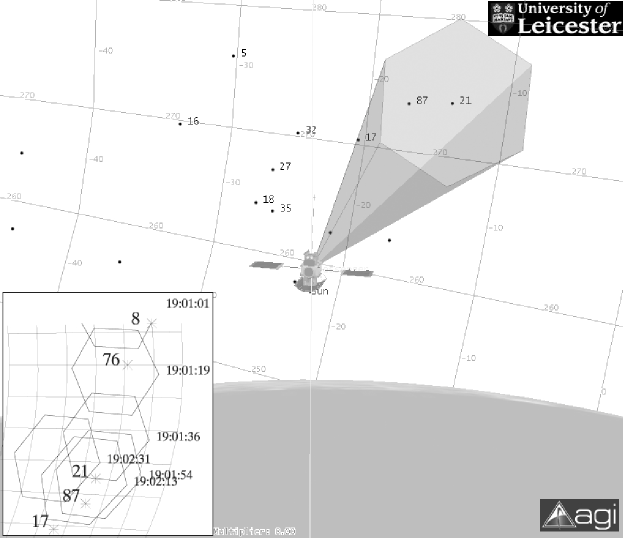
Ho et al. (2011a) define M1-E1 as an event of 180 s duration beginning at 18:59:49 UTC. GX17+02 is responsible for the major peak predicted by our model; it entered the field at 19:01:38 UTC and exited at 19:02:28 UTC, entirely within the period covered by M1-E1. Our model indicates a peak count rate of 6.6 cts s-1 at 19:02:00 UTC, so that a significant number of events recorded by the XRS within the 180 sec period of M1-E1 are from this source. We note that Ho et al. (2011a) refer to an astrophysical source event of undetermined origin following the M1 closest approach, but since GX17+02 appears within the 180 sec timeframe of M1-E1, we assume that this is not the event they refer to (conversely, M1-B1, B2 and B3 are astrophysical sources observed following closest approach).
Our model fails to reproduce the first component of M1-E1 (the initial rise from background, through to the primary peak). Any astrophysical source proposed to explain this feature must be of substantial X-ray brightness, and no other sufficiently bright objects exist in the RASSBSC at this location; a search of the SIMBAD database333http://simbad.u-strasbg.fr/simbad/ also provides no additional candidates. We have examined the next 200 brightest objects in the RASSBSC for sources at appropriate positions to explain this feature, but all other sources in the area are too faint to explain the intensity of the feature, and no combination of count rates from these sources allows us to replicate the shape of M1-E1.
A search of the WGACAT catalogue (White et al., 1994) was conducted to locate any notable sources present in the first 1 minute of the event. WGACAT is a point source catalogue generated from all ROSAT PSPC pointed observations, and hence count rates can differ significantly between the RASSBSC and WGACAT entries for a specific object if, for example, pointed observations were made of a target during an episode of increased activity. The cataclysmic variable AM Her (1RXS J181613.8+495203) was targeted in a pointed observation between 12th - 13th April 1991 when it was found to be in a high state; the recorded count rate of 41.6 cts s-1 (compared to 0.13 cts s-1 in the RASSBC) makes it the eighth brightest WGACAT source. We find that AM Her entered the field of view of the MESSENGER XRS on January 14th 2008 at 18:59:16 UTC, 33 seconds before the onset of M1-E1. It was closest to the field centre () at 18:59:27 UTC, and remained in the field for sec, exiting at 18:59:38 UTC.
Based on optical monitoring data from the American Association of Variable Star Observers (AAVSO), AM Her was in a high state during the first Mercury flyby (the data suggest that by the time of the second flyby, the object was in a low state). Although we have been unable to identify X-ray observations of the object made during the time around the first flyby, Schwope et al. (2006) discuss XMM Newton observations of AM Her in July 2005 when the object was in an intermediate (close to high) state, as reflected by the AAVSO data for this period. The spectrum presented by Schwope et al. (Figure 2 in that work) shows that a flux of counts s-1 keV-1 at 1 keV, falling to counts s-1 keV-1 at 10 keV, was recorded by the instrument. Using effective area curves for the EPIC pn camera provided in Figure 30 of the XMM-Newton Users Handbook (ESA XMM-Newton Science Operations Centre Team, 2011) (indicating an effective area up to orders of magnitude higher than that of the MESSENGER XRS), we estimate that AM Her would produce a count rate of no more than 0.1 cts s-1 in the XRS. This conclusion is supported by an independent calculation using spectral models based on GINGA observations of AM Her discussed by Beardmore et al. (1995), which we find to give a count rate of 0.08, 0.03 and 0.04 cts s-1 in the unfiltered, Al and Mg channels respectively. Hence, although AM Her is sufficiently bright to generate a signal in the XRS, it is unlikely to explain the first component of M1-E1 including the first peak.
We further note that no other features in any of the flybys are explicable with WGACAT sources.
Three spectra are available for the time covered by M1-E1; we show two of these in Figure 6. The top panel of the figure is the spectrum for the first minute of the event, corresponding to observations starting at 18:59:49 (the beginning of the three minute event window defined by Ho et al. (2011a)). The spectrum for the second minute is very similar in form, and together these data cover the period which we cannot explain on the basis of astrophysical sources. However, the final minute of the event, beginning at 19:01:49 UTC, shows a different spectral form (lower panel of Figure 6) with a broad peak near 3 keV consistent with the spectral shape predicted for the LMXB sources described in Section 4.1. This covers the period in which we find the XRS count rate profile well reproduced by the presence of the source GX17+02. We also draw attention to the very significant changes in the spectra recorded by the Al- and Mg-filtered channels of the XRS in the same time windows (Figure 7).
In both channels, the initial minute of the event (Figure 7, top row) shows clear evidence of fluorescence peaks from the Kα lines of Mg (1.254 keV) and Al (1.487 keV) as discussed by Ho et al. (2011a) In the final minute of the event, the spectral form in both channels undergoes a substantial change: the strength of the fluorescence lines is significantly reduced, and there is evidence of a steepening in the spectral slope towards higher energies.
Thus, the XRS spectra and astrophysical source model are consistent with the suggestion that M1-E1 is an event comprising two phases: an initial count rate enhancement with no astrophysical origin, produced by excitation of sufficient intensity and at an appropriate energy to generate substantial fluorescence in the detector, supporting the electron explanation of Ho et al. (2011a), followed by a 20% - 40% contribution (based on the Al and Mg channel data in Table 3) in the final minute of the event, comprising photons which do not excite fluorescence in the filters, supporting the astrophysical source argument.
6.2 M2-E1 and the LMXB GX17+02
Our work shows extremely close agreement between the timing of M2-E1 and the presence of three bright sources in the FOV. Two of these, GX5-01 and Sgr X-3, also dominate M2-B1 and reproduce the shape and magnitude of that peak in all three channels. This suggests that our flux estimates for the objects are reasonable, and since they appear in the FOV during the period of M2-E1, a significant fraction of the events in this feature must be astrophysical in origin. However our model does not reproduce the magnitude of M2-E1 well, producing a peak count rate which is approximately one third of the observed value.
The third bright source in M2-E1 is GX17+02, which also contributes to M1-E1 and M1-B2 - neither of which shows a substantially under-estimated count rate (the height of M1-B2 in particular is reproduced very well). However, GX17+02 is a neutron star LMXB which exhibits X-ray burst behaviour and is well documented in the literature (e.g. Kahn and Grindlay (1984); Kuulkers et al. (2002); Di Salvo et al. (2000); Migliari et al. (2007); Farinelli et al. (2005)). If the calculated flux is a good match to features in flyby 1 but not in the later encounter, this may indicate that the object was in different states at these times.
Kuulkers et al. (2002) present a study of GX17+02 and review previous research on this object. Burst durations from a few seconds to 25 minutes have been observed. Our spectral model for GX17+02 was based on the high-state parameters given by Christian and Swank (1997), and produces a flux of erg cm-2 s-1 in the 1-20 keV band ( erg cm-2 s-1 in the 1-10 keV MESSENGER XRS band). Kahn and Grindlay (1984) report a burst with a peak flux of erg cm-2 s-1, lying on top of a steady emission component of erg cm-2 s-1 (1-20 keV), observed with the Monitor Proportional Counter instrument onboard the Einstein observatory. Scaling our GX17+02 spectrum to match the intensity of this burst results in excellent agreement between the predicted and observed peak count rate, and also the time of this peak. However, there are significant differences in the slope of the trailing edge produced by this model compared to the observed profile. Further, the burst flux reported by Kahn and Grindlay is much higher than observed for the other bursts in their study, and it is highly improbable that GX17+02 was undergoing a repeat of this extraordinarily large event in the few minutes that the MESSENGER XRS field contained the object. We therefore rule out an intense outburst in GX17+02 as the explanation for M2-E1 in its entirety.
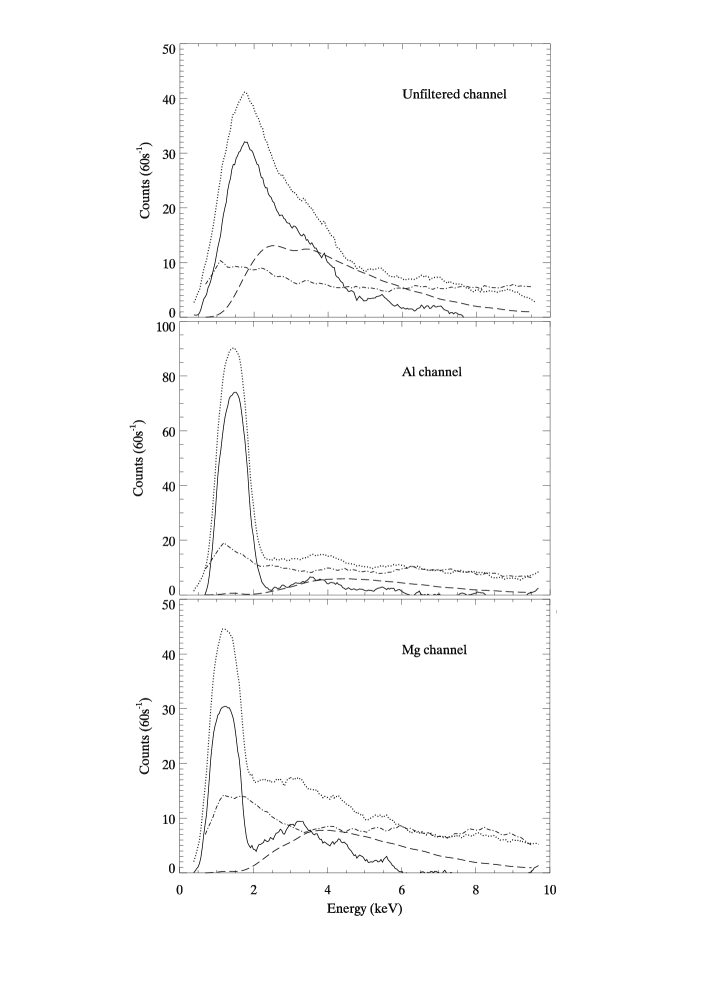
The three channel spectra acquired around the peak of the M2-E1 event are shown as the dotted histograms in Figure 9. For each channel, we have estimated the background level present in the data using XRS measurements from a 60 second interval around 08:27:08 UTC on 6 Oct 2008, a time for which our model predicts no bright sources to be in the field of view (dot-dashed histogram). The resulting background-subtracted observations are shown as the solid histogram. We note that in each channel, the applied background level is marginally higher (1 - 2 counts per bin) than the rates observed at the M2-E1 peak, in some regions above 6 keV; however, the signal levels at these energies are low, and the associated uncertainties such that this feature is not regarded as significant in the context of the current discussion, which is primarily concerned with the general form of the spectrum at energies lower than 6 keV.
LMXB sources are known to exhibit spectral softening in the hard state (e.g. Kuulkers et al. (2002); Mainardi et al. (2010)). Migliari et al. (2007) consider the spectrum of GX17+02 when in the horizontal branch (HB), normal branch (NB) and flaring branch (FB), each a distinct state of activity with its own X-ray emission characteristics. We have used the HB model given in Table 2 of Migliari et al. to generate a more detailed, multi-component spectrum for this object, producing a total flux which is similar to that generated by the Christian and Swank model, but in a spectral form which includes a 0.46 keV blackbody emission component that softens the spectral peak by approximately 0.5 keV. The dashed histogram in each of the three channels in Figure 9 shows the profile expected from the combination of sources which pass through the field during this period, weighted by the off-axis angle of each source as a function of time.
The large fluorescence peaks in the Al and Mg channel observations are absent in the simulations, as is the broader peak around 1.9 keV in the unfiltered channel. Our model does not account for the fraction of X-rays absorbed in the Al and Mg foils which go on to produce fluorescence photons that enter the detector, but these can be approximated on the basis of the photoelectric escape fraction following the method of Reed and Ware (1972). Assuming that the front and rear surfaces of the foil are equivalent,
| (2) |
where is the K-shell fluorescence yield ( for Mg or Al), is the K-edge jump ratio of the linear absorption coefficient ( for Mg or Al), and is the ratio of the mass attenuation coefficients for the incident and fluorescent photon. We find , so that approximately 1% of the flux absorbed in the Al and Mg foils with energies equal to or greater than the K-edge of the material can be expected to generate a fluorescent photon event in the detector. Using the integral model flux between these limits, we find that fluorescent photons are expected from the Mg foil, and from the Al foil, in a 60 second time integration. Thus, while the astrophysical source spectrum in M2-E1 is expected to generate a fluorescence signal, its strength must be substantially lower than the intense fluorescence peaks which span several bins in the observed spectra. We note also that these spectra provide further evidence against the intense LMXB outburst explanation, which would produce a substantial enhancement of the 3 - 6 keV flux and which is not observed in the XRS spectra. Nevertheless, we highlight some correlations between the background-subtracted XRS observations for M2-E1 and the model spectra: for example, the similarity in the model and observed spectral slopes in the 2-4 keV band of the Al and Mg channels, and the broad general agreement between modelled and observed signal levels beyond 2 keV. We also note that the decay of the unfiltered spectrum above 4 keV broadly follows the trend predicted by the model. Thus, while there are clear differences between observation and prediction, we find that the comparisons are sufficiently close that the astrophysical explanation for part of M2-E1 remains viable.
The fact that sources implicated in M2-E1 are also found to generate strong features such as M1-B2 and M2-B1 suggests that a significant number of events in M2-E1 must come from astrophysical sources, and as summarised in Table 3, the identified sources contribute between 30% - 50% of the total events in this feature depending on the XRS channel being used as the basis of the estimate. But the inability of our model to explain the intensity of the feature, and presence of strong fluorescence peaks in the Al and Mg data, supports the suprathermal electron interpretation of Ho et al. (2011a), although a modification to the electron model spectrum which they propose should be considered owing to the presence of an astrophysical background signal. It is highly unlikely that the electron event began and ended at precisely the same time that the sources were in the field, but this issue can be resolved by recognising that only data points describe this event in the XRS data (as indicated in the top panel of Figure 3). The start and end times of the event are well matched by our model, but the peak data point (corresponding to the second time bin in the event) and the point one minute later, suggest that a burst of electrons arrived near the end of the period covered by the first time bin, continued through the second time bin, and was decaying in the period of the third. The duration of such an event would be similar to that seen in M1-E1.
7 Conclusions
We have used spacecraft telemetry to reconstruct the position of the MESSENGER XRS field of view as a function of time during the Mercury flybys of 14th January and 6th October 2008, and 29th September 2009. The appearance within the FOV of any of the 100 brightest sources in the ROSAT bright source catalogue has been recorded. The count rates expected from these sources as a function of time have been calculated, and the results compared to XRS observations from these encounters. In the case of the first two flybys where comprehensive data are available, our model leads to a predicted XRS count rate time series which is in very good general agreement with the observations in all three instrument channels.
Feature M2-E2 cannot be explained by our model since the instrument footprint is entirely located on the planet at this time. The spectrum of this event is different to that observed at other times in the data, and our results support the work of Ho et al. (2011a) who find that this feature is produced by suprathermal electrons entering the instrument from the Hermean magnetosphere.
Our model shows significant astrophysical contributions to features M1-E1 and M2-E1, also attributed to suprathermal electrons by Ho et al. (2011a). In each case we support the general suprathermal electron explanation of Ho et al. (2011a), and acknowledge that the presence of the energetic electron population discussed in that work is confirmed in research presented by Ho et al. (2011b). We suggest, however, that the derived electron fluxes should be reassessed to account for the astrophysical events present in the data. In the case of M1-E1, we find that the first two minutes of the event are characterised by suprathermal electrons, but the final minute is dominated by astrophysical contributions, so the electron flux calculations should be based on the first two minutes of data only.
We find that the onset and end times of M2-E1 are very well reproduced by the appearance of three bright sources in the FOV, and that the end of the event corresponds to the occultation of sources by the planet’s limb. Two of the sources contribute to other features of entirely astrophysical origin, lending support to our claim that a significant fraction of the counts in this event are of an astrophysical nature. However, the predicted intensity of the feature is approximately 30% of the observed value in the Al channel (% in the Mg channel) and strong fluorescence signals appear in the Al and Mg channels at the peak of the event that cannot be explained by our model. Flaring of the LMXB GX17+02 is ruled out as an explanation, but we propose that the count rate and fluorescence peaks can be explained if the astrophysical photon spectrum is augmented by an excess of suprathermal electron origin, beginning near the end of the first minute that the sources are in the field and has a duration similar to that seen in M1-E1. Therefore in the case of M2-E1, suprathermal electrons still offer a plausible explanation for a substantial part of this feature, but electron flux calculations based on this feature should include a correction for the significant signal contribution received from the astrophysical sources which we have identified.
Our study highlights two more general points. First, that the analysis of XRS data from MESSENGER, and by inference other planetary missions with similar instrumentation and observation characteristics (such as the MIXS instrument on BepiColombo, to which the authors are affiliated), is sensitive to the presence of “light pollution” from background sources in the FOV. A detailed consideration of the relationship between the FOV and the position of bright astrophysical sources, as described here, should be included as part of the routine data reduction pipeline whenever instrument fields of view contain background sky.
Finally, the presence of astrophysical sources in XRS data has been presented here as a form of contamination to be accounted for in the analysis of planetary science observations. However, these signals are also “free” data obtained as a byproduct of the primary observations, and may contain information on source activity, as well enabling other useful studies such as occultation measurements which can improve knowledge of source locations and terrain profiles. MESSENGER is not unique in this respect - many other missions generate observational data that include signals which are of little interest to the core mission teams but which would be useful in other areas of planetary science and astronomy. The means of source identification are readily available through resources such as SPICE, and combined with instrument performance data, which in the case of the MESSENGER mission have been provided via the PDS, these serendipitous observations could form a significant source of data for researchers in different parts of the science community.
8 Acknowledgements
The authors thank J. Pye, S. Vaughan, R. Willingale and G. Wynn of the Department of Physics & Astronomy, University of Leicester, for useful discussions during the preparation of this paper. We are grateful to Richard Starr, MESSENGER XRS Instrument Scientist, for providing information on the performance of the XRS and helpful comments offered on the draft manuscript. We also thank the referees for their constructive comments and suggestions which have improved this work. This research has made use of the Leicester Database and Archive Service (LEDAS) at the Department of Physics and Astronomy, University of Leicester, UK; the Planetary Data System (PDS) Geosciences Node hosted by Washington University in St. Louis, USA; the PDS data archive hosted by the NAIF group at JPL; the SIMBAD database operated at CDS, Strasbourg, France, and NASA’s Astrophysics Data System. Finally, we acknowledge with thanks the American Association of Variable Star Observers for the optical data on AM Herculis activity collected by observers worldwide and used in this research.
References
- Acton (1996) Acton, C.H., 1996. Ancillary data services of NASA’s Navigation and Ancillary Information Facility. Planet. Space Sci. 44, 65–70.
- Allen et al. (1997) Allen, G.E., Keohane, J.W., Gotthelf, E.V., Petre, R., Jahoda, K., Rothschild, R.E., Lingenfelter, R.E., Heindl, W.A., Marsden, D., Gruber, D.E., Pelling, M.R., Blanco, P.R., 1997. Evidence of X-Ray Synchrotron Emission from Electrons Accelerated to 40 TeV in the Supernova Remnant Cassiopeia A. ApJ 487, L97+. arXiv:astro-ph/9707110.
- Baker et al. (2011) Baker, D.N., Odstrcil, D., Anderson, B.J., Arge, C.N., Benna, M., Gloeckler, G., Korth, H., Mayer, L.R., Raines, J.M., Schriver, D., Slavin, J.A., Solomon, S.C., Tr vn cek, P.M., Zurbuchen, T.H., 2011. The space environment of mercury at the times of the second and third messenger flybys. Planet. Space Sci. In Press, Corrected Proof, –.
- Barret et al. (1998) Barret, D., Motch, C., Predehl, P., 1998. ROSAT and follow-up infrared observations of the X-ray burster KS 1731-260. A&A 329, 965–970.
- Beardmore et al. (1995) Beardmore, A.P., Done, C., Osborne, J.P., Ishida, M., 1995. The GINGA hard X-ray spectrum of AM Herculis. MNRAS 272, 749–762.
- Benna et al. (2010) Benna, M., Anderson, B.J., Baker, D.N., Boardsen, S.A., Gloeckler, G., Gold, R.E., Ho, G.C., Killen, R.M., Korth, H., Krimigis, S.M., Purucker, M.E., McNutt, R.L., Raines, J.M., McClintock, W.E., Sarantos, M., Slavin, J.A., Solomon, S.C., Zurbuchen, T.H., 2010. Modeling of the magnetosphere of Mercury at the time of the first MESSENGER flyby. Icarus 209, 3–10.
- Beuermann et al. (2006) Beuermann, K., Burwitz, V., Rauch, T., 2006. Establishing HZ43, Sirius B and RX J185635-3754 as soft X-ray standards: a cross-calibration between the Chandra LETG+HRC-S, the EUVE spectrometer, and the ROSAT PSPC. A&A 458, 541–552. arXiv:astro-ph/0608592.
- Christian and Swank (1997) Christian, D.J., Swank, J.H., 1997. The Survey of Low-Mass X-Ray Binaries with the Einstein Observatory Solid-State Spectrometer and Monitor Proportional Counter. ApJS 109, 177–+.
- Di Salvo et al. (2000) Di Salvo, T., Stella, L., Robba, N.R., van der Klis, M., Burderi, L., Israel, G.L., Homan, J., Campana, S., Frontera, F., Parmar, A.N., 2000. The Discovery of a State-Dependent Hard Tail in the X-Ray Spectrum of the Luminous Z Source GX 17+2. ApJ 544, L119–L122. arXiv:astro-ph/0009434.
- ESA XMM-Newton Science Operations Centre Team (2011) ESA XMM-Newton Science Operations Centre Team, 2011. XMM-Newton Users Handbook. ESA. http://xmm.esac.esa.int%****␣xrsfeatures.bbl␣Line␣125␣****/external/xmm_user_support/documentation/uhb/XMM_UHB.pdf.
- Farinelli et al. (2005) Farinelli, R., Frontera, F., Zdziarski, A.A., Stella, L., Zhang, S.N., van der Klis, M., Masetti, N., Amati, L., 2005. The transient hard X-ray tail of GX 17+2: New BeppoSAX results. A&A 434, 25–34.
- Fraser et al. (2010) Fraser, G.W., Carpenter, J.D., Rothery, D.A., Pearson, J.F., Martindale, A., Huovelin, J., Treis, J., Anand, M., Anttila, M., Ashcroft, M., Benkoff, J., Bland, P., Bowyer, A., Bradley, A., Bridges, J., Brown, C., Bulloch, C., Bunce, E.J., Christensen, U., Evans, M., Fairbend, R., Feasey, M., Giannini, F., Hermann, S., Hesse, M., Hilchenbach, M., Jorden, T., Joy, K., Kaipiainen, M., Kitchingman, I., Lechner, P., Lutz, G., Malkki, A., Muinonen, K., Näränen, J., Portin, P., Prydderch, M., Juan, J.S., Sclater, E., Schyns, E., Stevenson, T.J., Strüder, L., Syrjasuo, M., Talboys, D., Thomas, P., Whitford, C., Whitehead, S., 2010. The mercury imaging X-ray spectrometer (MIXS) on BepiColombo. Planet. Space Sci. 58, 79–95.
- Harshman (2010) Harshman, K., 2010. MESSENGER X-Ray Spectrometer Calibrated Data Record Software Interface Specification. Technical Report. University of Arizona. Accessed 11 April 2011.
- Ho et al. (2011b) Ho, G.C., Krimigis, S.M., Gold, R.E., Baker, D.N., Slavin, J.A., Anderson, B.J., Korth, H., Starr, R.D., Lawrence, D.J., McNutt, R.L., Solomon, S.C., 2011b. MESSENGER Observations of Transient Bursts of Energetic Electrons in Mercury’s Magnetosphere. Science 333, 1865–.
- Ho et al. (2011a) Ho, G.C., Starr, R.D., Gold, R.E., Krimigis, S.M., Slavin, J.A., Baker, D.N., Anderson, B.J., McNutt, R.L., Nittler, L.R., Solomon, S.C., 2011a. Observations of suprathermal electrons in Mercury’s magnetosphere during the three MESSENGER flybys. Planet. Space Sci. 59, 2016–2025.
- Holberg et al. (1998a) Holberg, J.B., Barstow, M.A., Bruhweiler, F.C., Cruise, A.M., Penny, A.J., 1998a. Sirius B: A New, More Accurate View. ApJ 497, 935–+.
- Holberg et al. (1998b) Holberg, J.B., Barstow, M.A., Sion, E.M., 1998b. A High-Dispersion Spectroscopic Survey of the Hot White Dwarfs: The IUE NEWSIPS SWP Echelle Data Set. ApJS 119, 207–238.
- Kahn and Grindlay (1984) Kahn, S.M., Grindlay, J.E., 1984. Evidence for weak X-ray burst emission from Cygnus X-2 and GX 17 + 2. ApJ 281, 826–829.
- Kuulkers et al. (2002) Kuulkers, E., Homan, J., van der Klis, M., Lewin, W.H.G., Méndez, M., 2002. X-ray bursts at extreme mass accretion rates from GX 17+2. A&A 382, 947–973. arXiv:astro-ph/0105386.
- Mainardi et al. (2010) Mainardi, L.I., Paizis, A., Farinelli, R., Kuulkers, E., Rodriguez, J., Hannikainen, D., Savolainen, P., Piraino, S., Bazzano, A., Santangelo, A., 2010. Spectral evolution of bright NS LMXBs with INTEGRAL: an application of the thermal plus bulk Comptonization model. A&A 512, A57+. 0912.2707.
- Migliari et al. (2007) Migliari, S., Miller-Jones, J.C.A., Fender, R.P., Homan, J., Di Salvo, T., Rothschild, R.E., Rupen, M.P., Tomsick, J.A., Wijnands, R., van der Klis, M., 2007. Linking Jet Emission, X-Ray States, and Hard X-Ray Tails in the Neutron Star X-Ray Binary GX 17+2. ApJ 671, 706–712. 0708.2296.
- O’Dwyer et al. (2003) O’Dwyer, I.J., Chu, Y., Gruendl, R.A., Guerrero, M.A., Webbink, R.F., 2003. Hard X-Ray Emission Associated with White Dwarfs. AJ 125, 2239–2254. arXiv:astro-ph/0301275.
- Pease et al. (2000) Pease, D.O., Drake, J.J., Johnson, C.O., Kashyap, V., Kraft, R.P., Ratzlaff, P.W., Wargelin, B.J., Brinkman, B.C., Kaastra, J.S., van der Meer, R., Paerels, F.B., Burwitz, V., Predehl, P., Marshall, H.L., Barstow, M.A., Finley, D.S., Dupuis, J., 2000. Low-energy effective area of the Chandra low-energy transmission grating spectrometer, in: J. E. Truemper & B. Aschenbach (Ed.), Society of Photo-Optical Instrumentation Engineers (SPIE) Conference Series, pp. 700–711.
- Pfeffermann et al. (1987) Pfeffermann, E., Briel, U.G., Hippmann, H., Kettenring, G., Metzner, G., Predehl, P., Reger, G., Stephan, K., Zombeck, M.V., Chappell, J., 1987. The focal plane instrumentation of the ROSAT telescope, in: Society of Photo-Optical Instrumentation Engineers (SPIE) Conference Series, pp. 519–+.
- Reed and Ware (1972) Reed, S.J.B., Ware, N.G., 1972. Escape peaks and internal fluorescence in X-ray spectra recorded with lithium drifted silicon detectors. Journal of Physics E Scientific Instruments 5, 582–583.
- Schlemm et al. (2007) Schlemm, C.E., Starr, R.D., Ho, G.C., Bechtold, K.E., Hamilton, S.A., Boldt, J.D., Boynton, W.V., Bradley, W., Fraeman, M.E., Gold, R.E., Goldsten, J.O., Hayes, J.R., Jaskulek, S.E., Rossano, E., Rumpf, R.A., Schaefer, E.D., Strohbehn, K., Shelton, R.G., Thompson, R.E., Trombka, J.I., Williams, B.D., 2007. The X-Ray Spectrometer on the MESSENGER Spacecraft. Space Sci. Rev. 131, 393–415.
- Schriver et al. (2011) Schriver, D., Trávníček, P., Ashour-Abdalla, M., Richard, R.L., Hellinger, P., Slavin, J.A., Anderson, B.J., Baker, D.N., Benna, M., Boardsen, S.A., Gold, R.E., Ho, G.C., Korth, H., Krimigis, S.M., McClintock, W.E., McLain, J.L., Orlando, T.M., Sarantos, M., Sprague, A.L., Starr, R.D., 2011. Electron transport and precipitation at Mercury during the MESSENGER flybys: Implications for electron-stimulated desorption. Planet. Space Sci. 59, 2026–2036.
- Schwope et al. (2006) Schwope, A., Schwarz, R., Gänsicke, B., Burwitz, V., Reinsch, K., 2006. AM Her - Caught in the Act with XMM-Newton!, in: A. Wilson (Ed.), The X-ray Universe 2005, p. 297.
- Slavin et al. (2009) Slavin, J.A., Acuña, M.H., Anderson, B.J., Baker, D.N., Benna, M., Boardsen, S.A., Gloeckler, G., Gold, R.E., Ho, G.C., Korth, H., Krimigis, S.M., McNutt, R.L., Raines, J.M., Sarantos, M., Schriver, D., Solomon, S.C., Trávníček, P., Zurbuchen, T.H., 2009. MESSENGER Observations of Magnetic Reconnection in Mercury’s Magnetosphere. Science 324, 606–.
- Slavin et al. (2010) Slavin, J.A., Anderson, B.J., Baker, D.N., Benna, M., Boardsen, S.A., Gloeckler, G., Gold, R.E., Ho, G.C., Korth, H., Krimigis, S.M., McNutt, R.L., Nittler, L.R., Raines, J.M., Sarantos, M., Schriver, D., Solomon, S.C., Starr, R.D., Trávníček, P.M., Zurbuchen, T.H., 2010. MESSENGER Observations of Extreme Loading and Unloading of Mercury’s Magnetic Tail. Science 329, 665–.
- Solomon et al. (2010) Solomon, S.C., McNutt, R.L., Anderson, B.J., Blewett, D.T., Evans, L.G., Gold, R.E., Krimigis, S.M., Murchie, S.L., Nittler, L.R., Phillips, R.J., Prockter, L.M., Slavin, J.A., Zuber, M.T., MESSENGER Team, 2010. MESSENGER’s Three Flybys of Mercury: An Emerging View of the Innermost Planet, in: Lunar and Planetary Institute Science Conference Abstracts, pp. 1343–+.
- Solomon et al. (2001) Solomon, S.C., McNutt, R.L., Gold, R.E., Acuña, M.H., Baker, D.N., Boynton, W.V., Chapman, C.R., Cheng, A.F., Gloeckler, G., Head, III, J.W., Krimigis, S.M., McClintock, W.E., Murchie, S.L., Peale, S.J., Phillips, R.J., Robinson, M.S., Slavin, J.A., Smith, D.E., Strom, R.G., Trombka, J.I., Zuber, M.T., 2001. The MESSENGER mission to Mercury: scientific objectives and implementation. Planet. Space Sci. 49, 1445–1465.
- Solomon et al. (2007) Solomon, S.C., McNutt, R.L., Gold, R.E., Domingue, D.L., 2007. MESSENGER Mission Overview. Space Sci. Rev. 131, 3–39.
- Solomon et al. (2008) Solomon, S.C., McNutt, R.L., Watters, T.R., Lawrence, D.J., Feldman, W.C., Head, J.W., Krimigis, S.M., Murchie, S.L., Phillips, R.J., Slavin, J.A., Zuber, M.T., 2008. Return to mercury: A global perspective on messenger’s first mercury flyby. Science 321, 59–62. http://www.sciencemag.org/content/321/5885/59.full.pdf.
- Voges et al. (1999) Voges, W., Aschenbach, B., Boller, T., Bräuninger, H., Briel, U., Burkert, W., Dennerl, K., Englhauser, J., Gruber, R., Haberl, F., Hartner, G., Hasinger, G., Kürster, M., Pfeffermann, E., Pietsch, W., Predehl, P., Rosso, C., Schmitt, J.H.M.M., Trümper, J., Zimmermann, H.U., 1999. The ROSAT all-sky survey bright source catalogue. A&A 349, 389–405. arXiv:astro-ph/9909315.
- White et al. (1994) White, N.E., Giommi, P., Angelini, L., 1994. The WGA Catalog of ROSAT Point Sources, in: American Astronomical Society Meeting Abstracts, p. 1372.
- White and Marshall (1984) White, N.E., Marshall, F.E., 1984. The unusually soft X-ray spectrum of LMC X-3. ApJ 281, 354–359.
- White et al. (1985) White, N.E., Peacock, A., Taylor, B.G., 1985. EXOSAT observations of broad iron K line emission from Scorpius X-1. ApJ 296, 475–480.
- Yamauchi and Nakamura (2004) Yamauchi, S., Nakamura, E., 2004. An Ultrasoft Transient X-Ray Source near the Galactic Bulge Region. PASJ 56, 803–808.
Appendix A Spacecraft coordinate data sources
The MESSENGER spacecraft trajectory and attitude data used in this work were obtained in the form of SPICE “kernels” (data files) for the spacecraft, sourced from the Planetary Data System archive (http://naif.jpl.nasa.gov/ naif/data_archived). Table 4 summarises the kernels used in the analysis, including data common to the entire time period (left column) and the three flyby-specific data sets (right column).
| Common | Flyby-Specific |
|---|---|
| lsk/naif0009.tls | ck/msgr_0801_v02.bc |
| pck/pck00008.tpc | (Flyby 1) |
| pck/pck00008_msgr.tpc | |
| sclk/messenger_0766.tsc | ck/msgr_0810_v01.bc |
| fk/msgr_dyn_v600.tf | (Flyby 2) |
| fk/msgr_v200.tf | |
| ik/msgr_xrs_v001.ti | ck/msgr_0909_v01.bc |
| spk/de405.bsp | (Flyby 3) |
| spk/msgr_040803_091031_120401.bsp |