Predictions of the Maximum Amplitude, Time of Occurrence, and Total Length of Solar Cycle 24
Abstract
In this work we predict the maximum amplitude, its time of occurrence, and the total length of Solar Cycle 24 by linear regression to the curvature (second derivative) at the preceding minimum of a smoothed version of the sunspots time series. We characterise the predictive power of the proposed methodology in a causal manner by an incremental incorporation of past solar cycles to the available data base. In regressing maximum cycle intensity to curvature at the leading minimum we obtain a correlation coefficient R 0.91 and for the upcoming Cycle 24 a forecast of 78 (90% confidence interval: 56 – 106). Ascent time also appears to be highly correlated to the second derivative at the starting minimum (R -0.77), predicting maximum solar activity for October 2013 (90% confidence interval: January 2013 to September 2014). Solar Cycle 24 should come to an end by February 2020 (90% confidence interval: January 2019 to July 2021), although in this case correlational evidence is weaker (R -0.56).
keywords:
Solar Cycle 24; maximum activity prediction; ascent time; total cycle length1 Introduction
s:introduction
The main features of solar magnetic activity, as measured by the solar (or Wolf) sunspots number (SSN), are successfully explained by dynamo theory [Ossendrijver (2003)]. A short cycle was first discovered by Schwabe and later reported by Wolf, who estimated its period to be approximately 11 years. This cycle is not periodic, with variations in amplitude and length, and also phases of inactivity such as the Maunder minimum. Longer-scale structures known as Gleissberg cycles have also been identified, but their analysis is complicated by the limited time-span of observations. The existence of multiple-scale dynamics, or non-stationarity, adds a layer of complexity to the important problem of solar-activity forecasting. This problem is technologically relevant as it affects the estimation of orbital drag and other space-weather effects such as the rate of solar flares, coronal mass ejections, and cosmic rays.
Different methods have been proposed in the literature to predict the maximum amplitude of Solar Cycle 24 (for a good review see Pesnell, 2008). Following \inlinecitePesnell2008, existing techniques can be broadly classified as climatological, precursor, dynamo model, spectral, and neural network:
-
•
Climatological forecasts assume that amplitude variations around the mean are random and therefore predict a forthcoming cycle of mean intensity, where the average can be computed over the full historical record or a more recent past Wang et al. (2002); Horstman (2005); Kim, Wilson, and Cucinotta (2006); Lantos (2006); Clilverd et al. (2006).
-
•
Precursor methods have recourse to leading indicators of solar activity. Two important examples of this type of signals are the intensity of solar polar magnetic fields and geomagnetic activity at the declining phase or cycle minimum Schatten (2005); Svalgaard, Cliver, and Kamide (2005); Hathaway and Wilson (2006); Jain (2006); Hamid and Galal (2006); Kane (2007).
-
•
Dynamo models, on the other hand, attempt to explain solar dynamics from first principles by integrating conservation equations. Examples of this type of approach include \inlineciteDikpati2006 and \inlineciteChoudhuri2007.
-
•
Spectral methods search for regularities or predictable patterns in the spectral content of the SSN time series. Autoregressive forecasts are also classified as spectral. Representative examples are given by \inlineciteKane1999, \inlineciteDuhau2003, \inlinecitedeMeyer2003, \inlineciteClilverd2006, and \inlineciteHiremath2008.
-
•
Finally, neural networks attempt to capture nonlinear relationships between a set of input features and future solar activity. Examples in this category are given by \inlineciteCalvo1995, \inlineciteVerdes2004, and \inlineciteMaris2006.
The proposed method is statistical in nature and falls into the climatological class. More precisely, we apply and extend a previously developed methodology for maximum solar-activity prediction Verdes et al. (2000). Based on the curvature of the SSN time series at a solar-cycle minimum, we forecast the main features of the following cycle, namely maximum amplitude, time to maximum, and total length. In \inlineciteVerdes2000 we proposed a restricted version of this approach only for the prediction of maximum amplitude and applied it to the case of Solar Cycle 23. The contributions of the present work are: i) the application of the previously proposed technique to predict the maximum intensity of Solar Cycle 24, and ii) its extension to forecast other cycle features such as ascent time and total length. The rationale behind the proposed method can be ultimately summarised as follows: fast-rising cycles will reach higher levels than slower-rising ones, with shorter ascent times and total cycle lengths. This is known as the Waldmeier effect Waldmeier (1955) and has been further documented by \inlineciteHathaway1994, \inlineciteHathaway2002, and \inlineciteDikpati2008. As a proxy for rising speed we use the curvature (second derivative) at the minima of the SSN time series, and effectively find that it determines the main characteristics of the unfolding cycle. We report details on these studies below.
2 Data Preparation and Predictor Signal Construction
s:data
We used the monthly averages of sunspot counts published by the Solar Influences Data Analysis Center (SIDC), which is the Solar Physics research department of the Royal Observatory of Belgium (try http://sidc.oma.be/DATA/ monthssn.dat).
In \inlineciteVerdes2000 we smoothed the raw data with a nonlinear technique known as local projective noise reduction Grassberger et al. (1993). Since the proposed methodology is independent of the specific smoothing procedure, here we followed a simpler approach and used a Savitzky–Golay filter Savitzky and Golay (1964) fitting parabolas in windows of 61 months (30 months to each side of the point being smoothed). The Savitzky–Golay filter allows us to estimate a smooth curve interpolating the sunspot data and its second derivative everywhere. In the following we call these time series and , respectively. Finally, we construct our predictor signal by searching for the 24 minima of and evaluating at these points. This process is illustrated in Figure \ireffig:data.

3 Predicting the Main Shape Parameters of Solar Cycles
s:prediction
3.1 Maximum Amplitude
ss:maximumAmplitudePrediction
To predict the maximum amplitude of a solar cycle, we chose as a target variable the yearly averages of sunspot numbers also published by the Solar Influences Data Analysis Center (SIDC, http://sidc.oma.be/DATA/yearssn.dat). More precisely, we focus on the last 23 maxima of this time series.
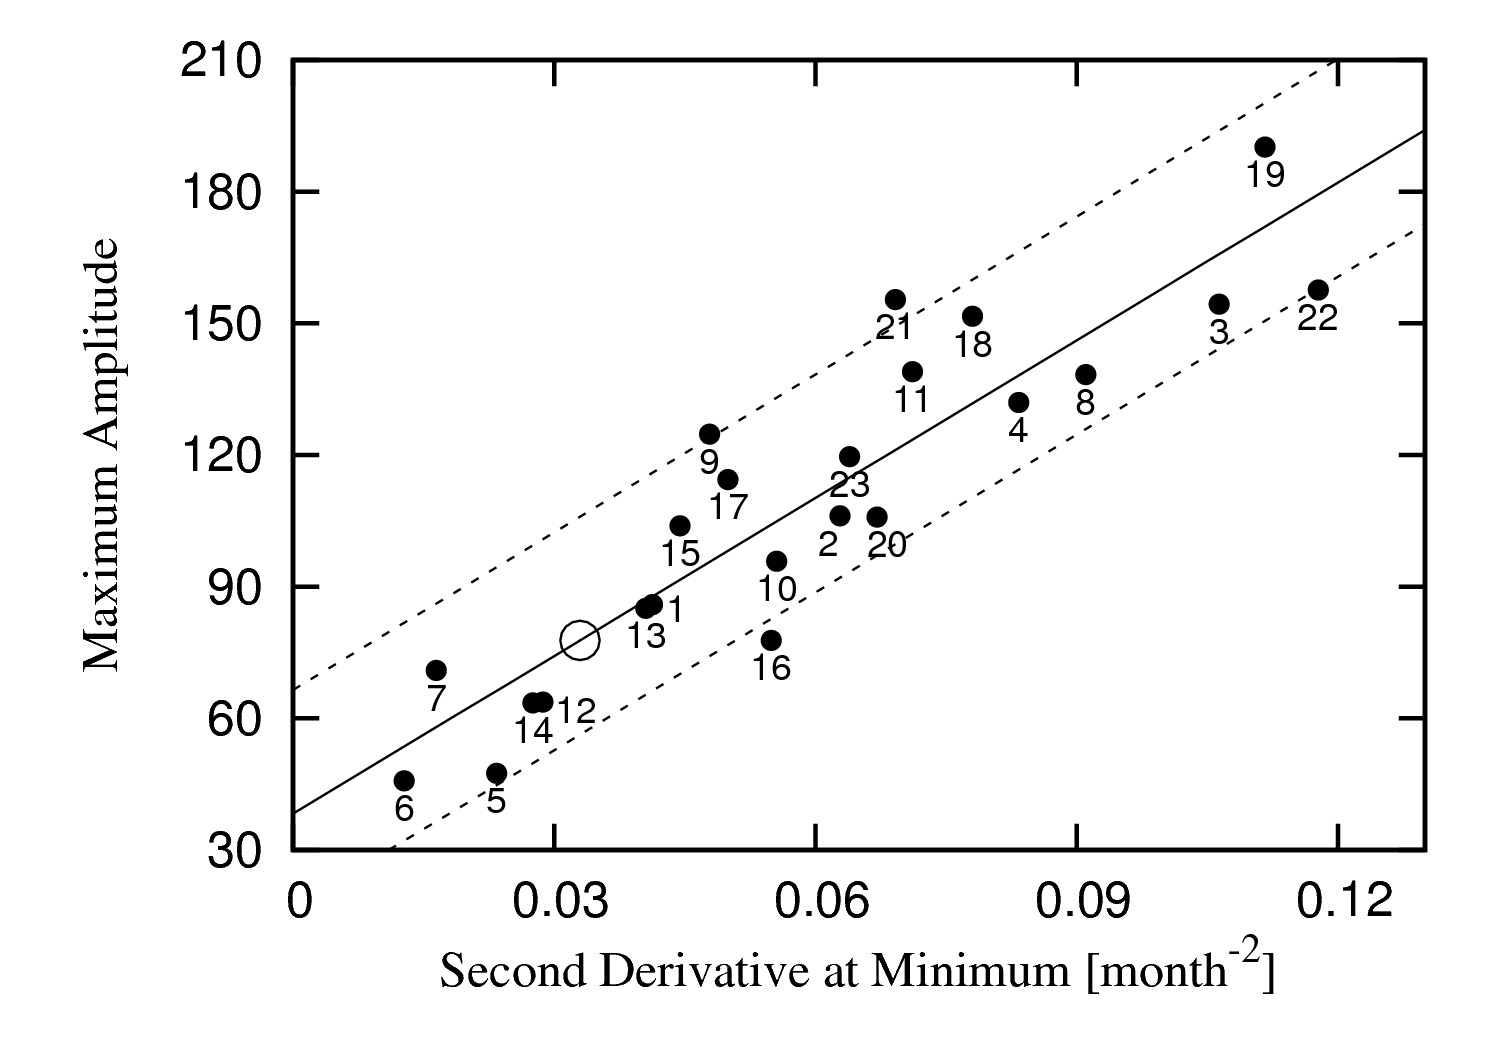
In Figure \ireffig:linearFitMaximumAmplitude we show a scatter plot of solar-cycle maxima as a function of the second derivative at the leading minima. With solid and dashed lines, we plot a fitted linear model and the 5 and 95 quantiles of its residues, respectively. We employed a robust fitting procedure that minimises the median absolute deviation (MAD) Huber (1981). We obtain a correlation coefficient R 0.91, and for the upcoming Cycle 24 a forecast of 78 (shown with an open circle) and a 90% confidence interval of 56 – 106 (dashed lines). The standard error (sample standard deviation of residuals) is 16.
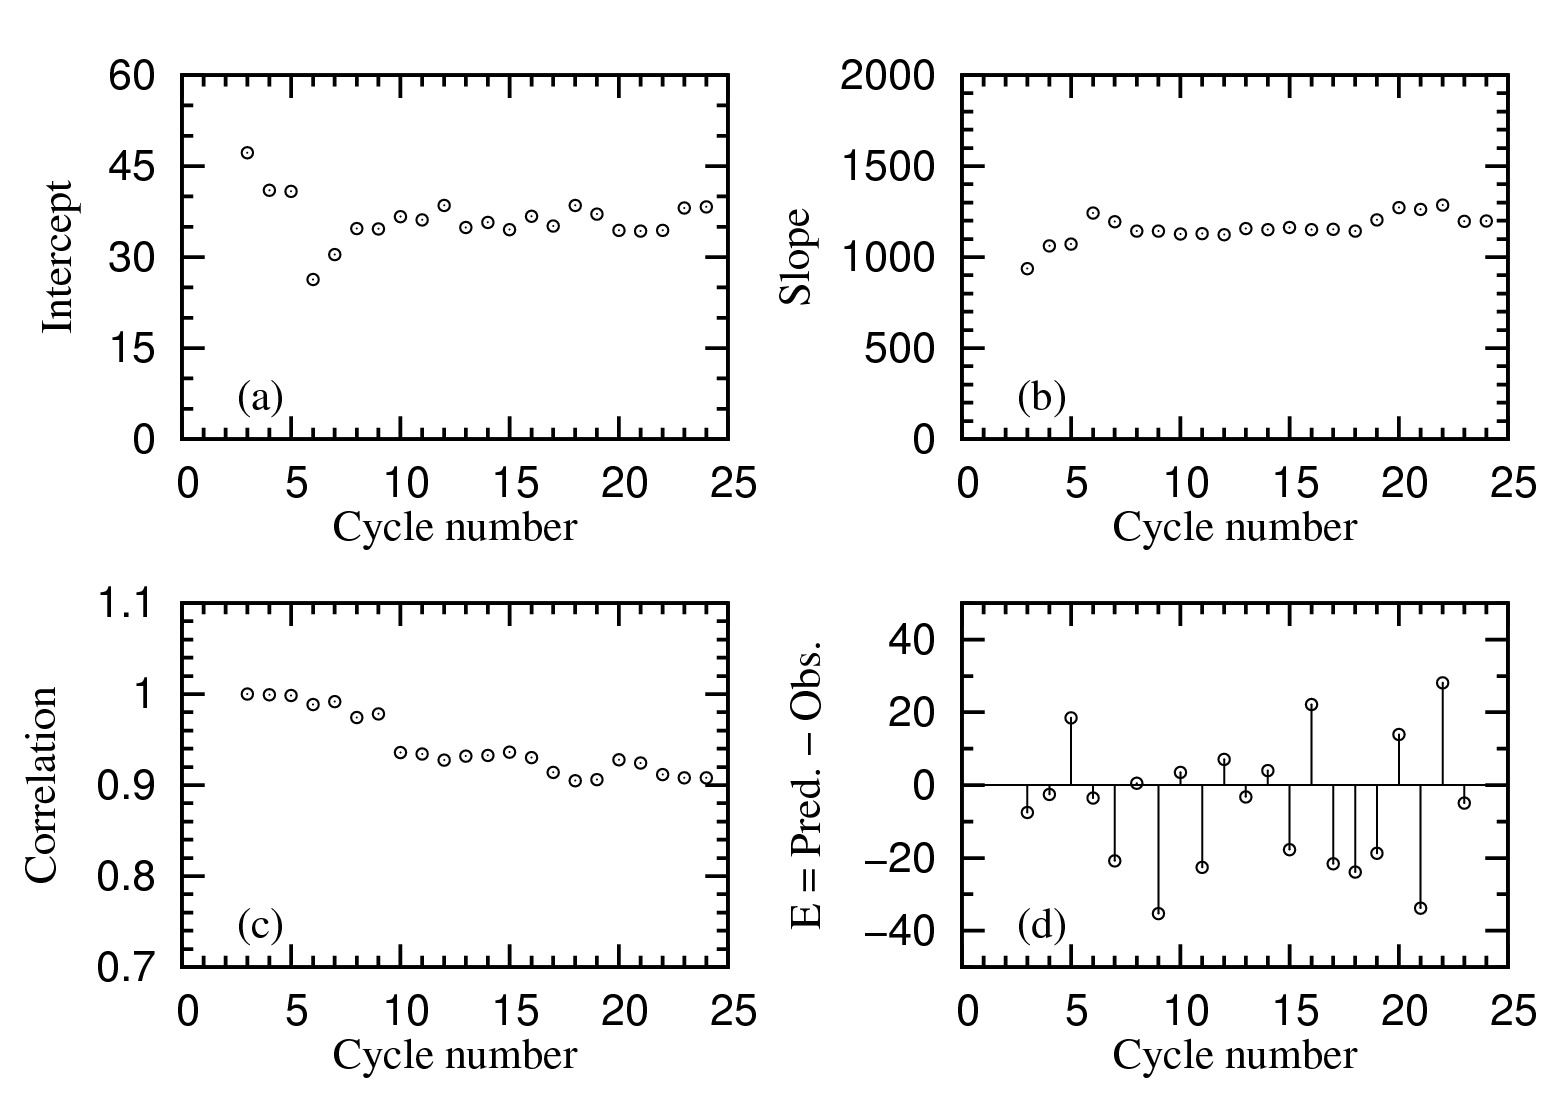
We now characterise the behaviour of the proposed methodology in a causal manner, i.e. by incremental incorporation of past solar cycles to the available data base. Is the obtained linear relationship stable over time (in the sense of the stability of its coefficients) as new cycles become available? We start from the earliest possible application of the proposed approach, namely predicting Cycle 3 with a linear response fitted to data from Cycles 1 and 2. We then incorporate the actual data from Cycle 3 to the available data base and fit a linear model which we use to forecast the maximum amplitude of Cycle 4. This exercise is repeated incrementally, always in a causal manner: to issue a prediction for a given solar cycle we only use information from previous cycles. In this way we obtain the results presented in Figure \ireffig:causalMaximumAmplitude. Panels (a) and (b) show the linear regression coefficients profile as a function of the predicted solar cycle number. In panel (c) we plot the linear correlation coefficient and in (d) the signed prediction error (predicted minus observed maximum). We observe that as new cycles are incorporated into the data base the proposed method quickly stabilises, and only small fluctuations are apparent after the tenth cycle.
In \inlineciteVerdes2000 we proposed the second-derivative prediction method and used it to issue a forecast for the maximum amplitude of Solar Cycle 23. The predicted maximum level was , a value which was consistent with the climatological mean of historical data. As mentioned in Section \irefs:data, in that work we used a more involved smoothing approach, while here we adopted a simple Savitzky–Golay scheme. However, the different smoothing procedure employed in this work had no effect on the issued prediction. Indeed, the forecast would be again 115, with a 90% confidence interval of 94 – 143. Cycle 23 finally showed a peak sunspot number of , in remarkable agreement with the prediction, a coincidence which can be considered as exceptional rather than the rule. Notice from Figure \ireffig:linearFitMaximumAmplitude that, together with Cycle 13, Solar Cycle 23 happened to be amongst the closest to the regression line – for Cycle 1 no model was yet available.
3.2 Time of Occurrence
ss:timeOfMaximumPrediction In order to predict when maximum solar activity will be observed, we measure the elapsed time between consecutive minima and maxima of . Notice that we do not base the ascent time definition on the yearly averages time series, but prefer the finer resolution (monthly as opposed to yearly) of instead. We regress the so-obtained ascent times to the curvature () at the corresponding minima. In Figure \ireffig:linearFitAscentTime we show a scatter plot of these variables. We find that the second derivative at the minimum has a good explanatory power of ascent time. More precisely, they are inversely related, with a linear correlation coefficient of -0.77. This inverse relationship is consistent with the rationale of the proposed approach: the larger at the minimum is, the faster the cycle rises and therefore the shorter the ascent time.
As Figure \ireffig:linearFitAscentTime shows, for Solar Cycle 24 we obtain a prediction of 5.0 years for the ascent time (shown with an open circle). This interval is to be counted from the last minimum of our time series (October 2008), which brings the predicted sunspot number maximum of 78 to October 2013 (90% confidence interval: January 2013 to September 2014). The standard error of this prediction (sample standard deviation of residuals) is six months.
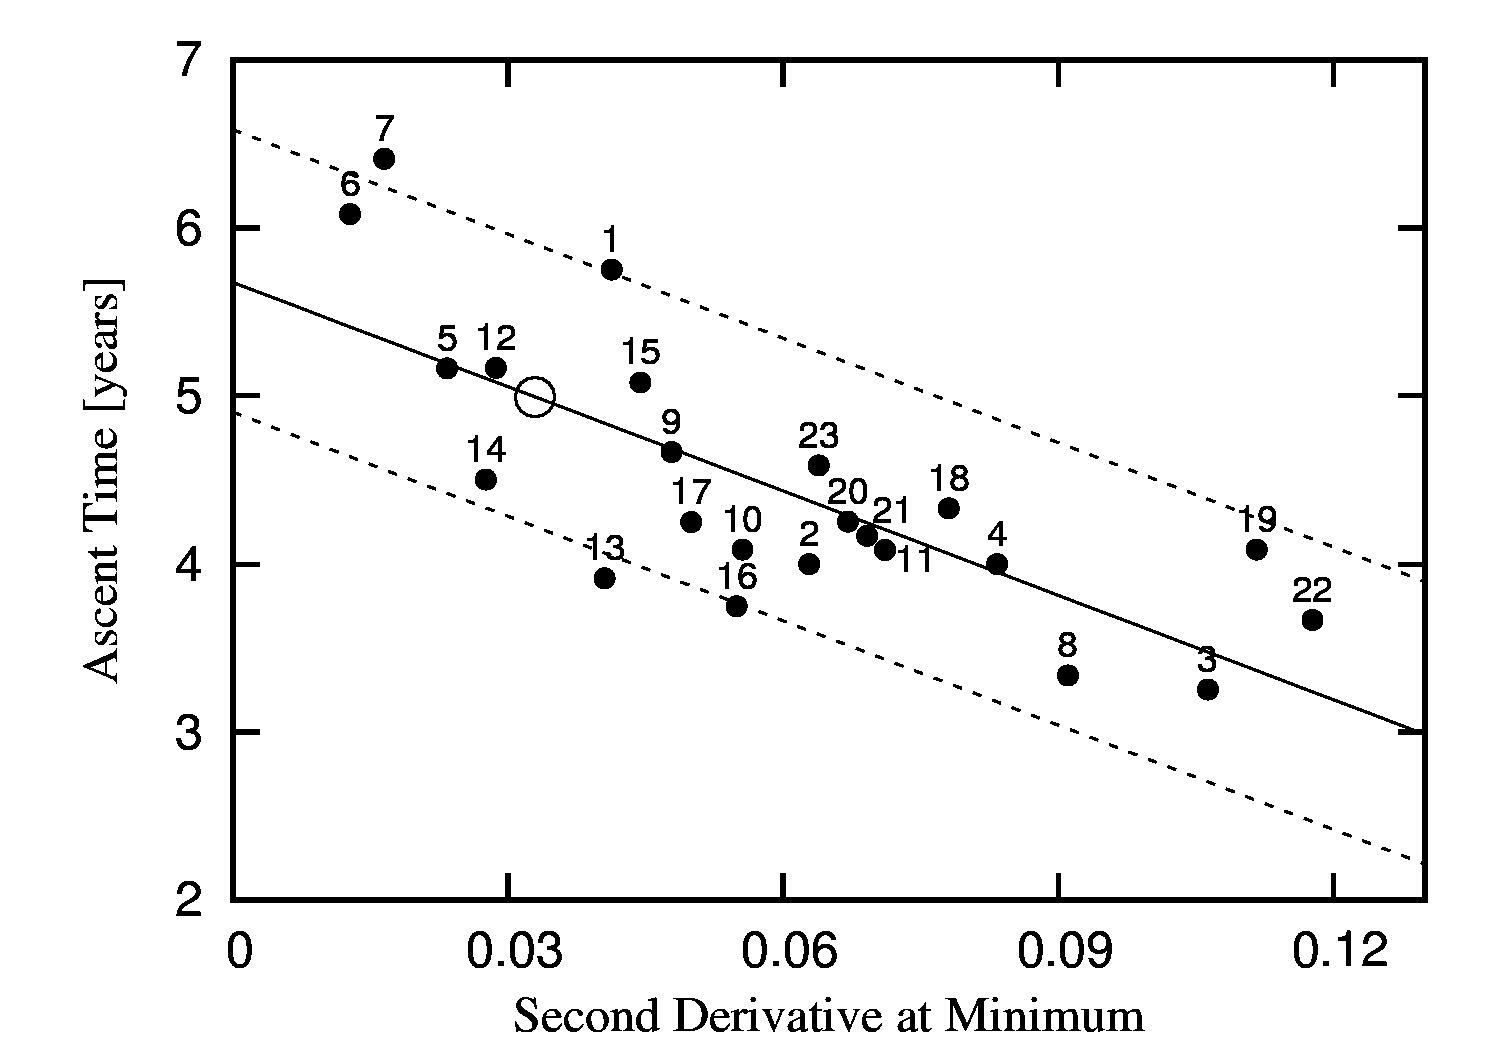
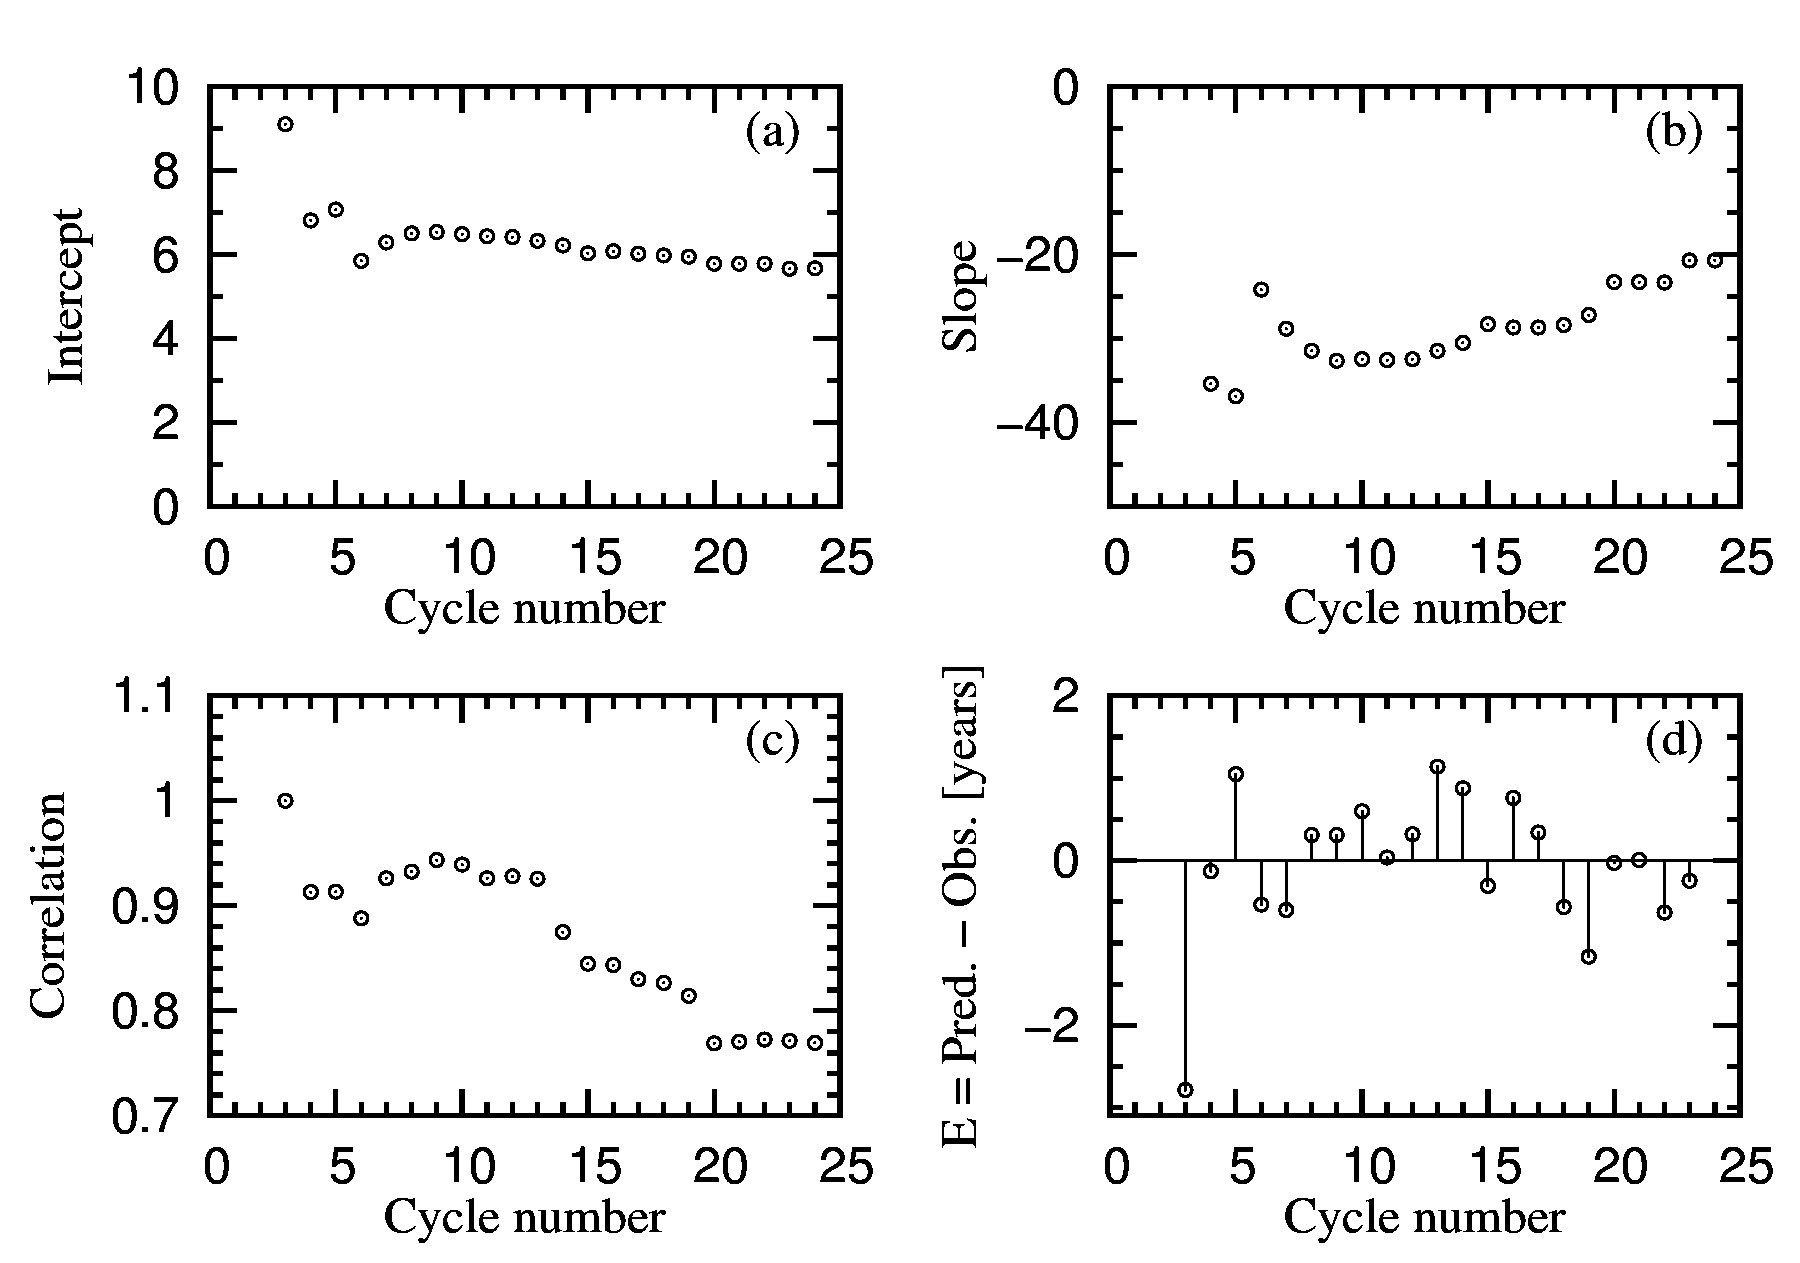
We characterise the proposed approach along the same lines employed in the previous section for the prediction of maximum cycle amplitude. In Figure \ireffig:causalAscentTime we show how the unfolding of new cycles has affected the stability of the inverse relationship between ascent time and curvature at minimum reported here. We find that the intercept has been broadly unaffected by new data. In contrast, the slope was initially much steeper than it currently is. As panel (b) of Figure \ireffig:causalAscentTime shows, Cycle 14 and more recently Cycles 19 and 22 have had a significant influence reducing the slope of the regression (the contribution of these cycles to the linear fit can be visualised in Figure \ireffig:linearFitAscentTime, where each dot is annotated by the solar-cycle number that it represents).
3.3 Total Cycle Length
ss:lengthOfCyclePrediction
Finally, we use the same technique to address the problem of predicting solar cycle length, which we compute as the temporal interval between consecutive minima in . As for the ascent time case, we prefer to measure temporal intervals on the monthly resolution of instead of the coarser one available from the yearly averages time series.
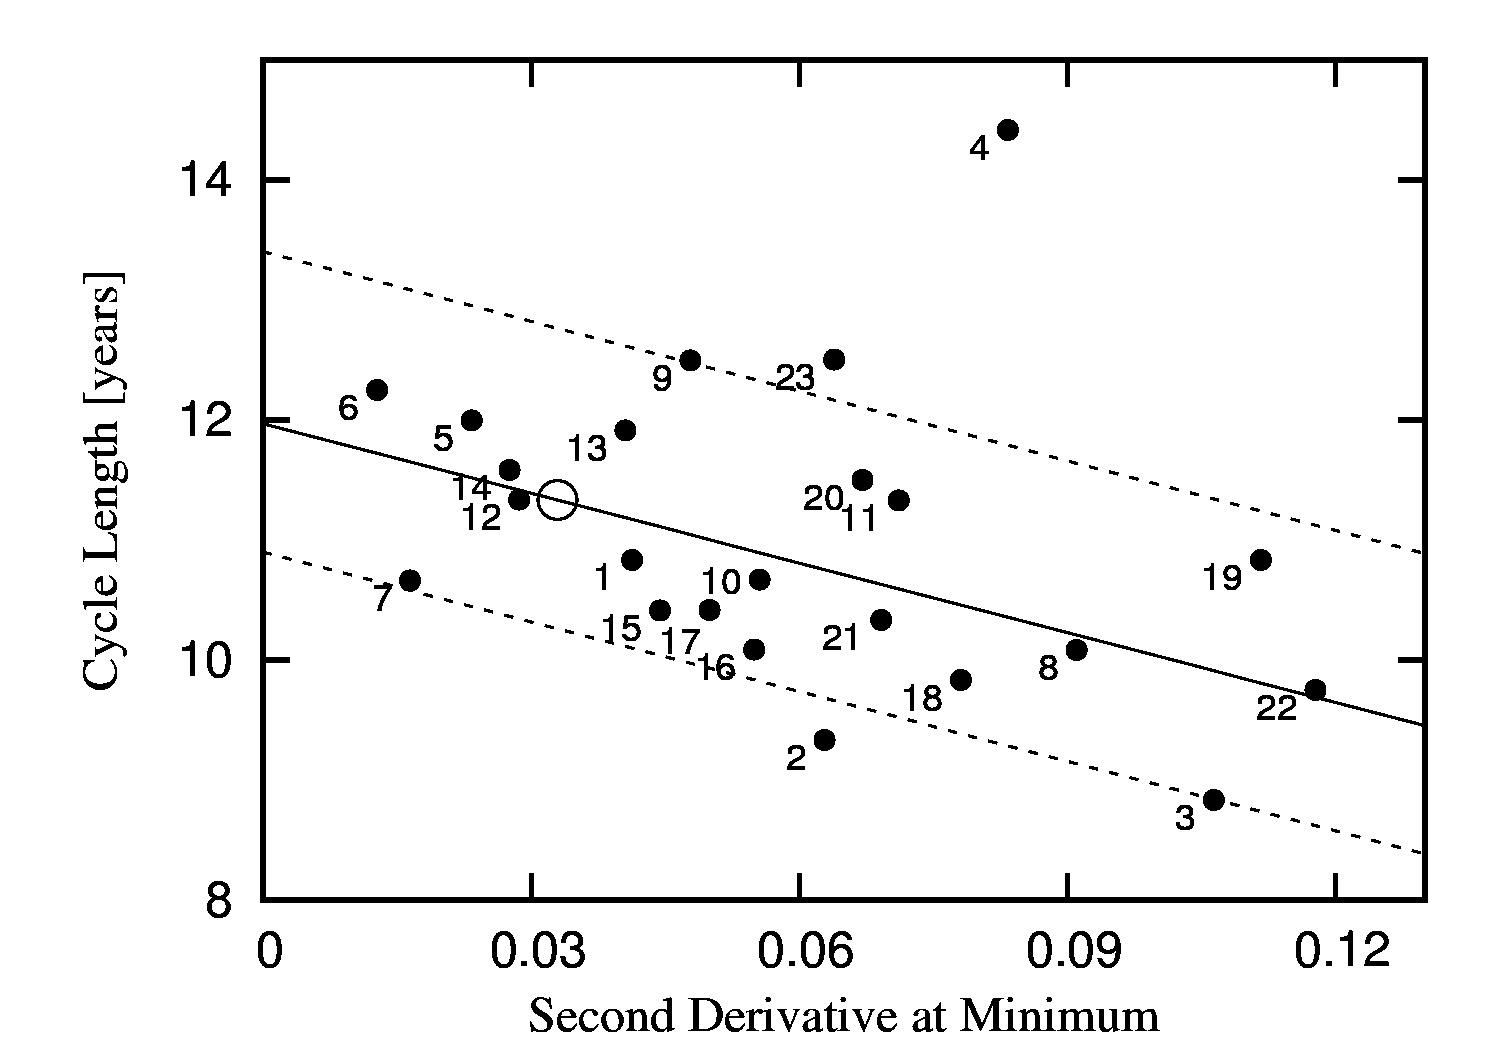
We therefore regress total cycle length to curvature at minimum. Inspection of these data, shown in Figure \ireffig:linearFitCycleLength, reveals the unusually long character of Cycle 4. Indeed, there is some controversy in the literature about the nature of this cycle. On one hand, it has been argued that the fourth solar cycle (1784 – 1798) is actually a superposition of two shorter cycles (Usoskin, Mursula, and Kovaltsov, 2001, 2003; Usoskin et al., 2009). However, arguments against this assertion have also been elaborated Krivova, Solanki, and Beer (2002); Zolotova and Ponyavin (2011). \inlineciteKrivova2002 performed statistical tests of sunspot records, 10Be, 14C, and auroral proxy data to conclude that the hypothesis of two shorter cycles is not supported by existing data. \inlineciteZolotova2011 reached the same conclusion and suggested that the length of the fourth cycle can be explained by impulse activity in the northern declining phase of the cycle. In any case, since the validity of this data point to our analysis is under question, we opt to exclude it from the model building process. Therefore, in the study of solar-cycle length versus curvature at minimum that follows below we do not include Solar Cycle 4.
Figure \ireffig:linearFitCycleLength reveals that the second derivative at the starting minimum carries information on the total length of the cycle. As it was the case for ascent time, they are inversely related – the linear correlation coefficient being in this case -0.56. This inverse relationship is again consistent with the concept that larger curvatures at the leading minima are associated with stronger, shorter cycles. In particular, for Solar Cycle 24 we obtain a prediction of 11.33 years for total length (shown with an open circle). This interval is to be counted from the most recent minimum of the time series (October 2008), which brings the predicted end to February 2020 (90% confidence interval: January 2019 to July 2021). The standard error (sample standard deviation of residuals) is ten months.
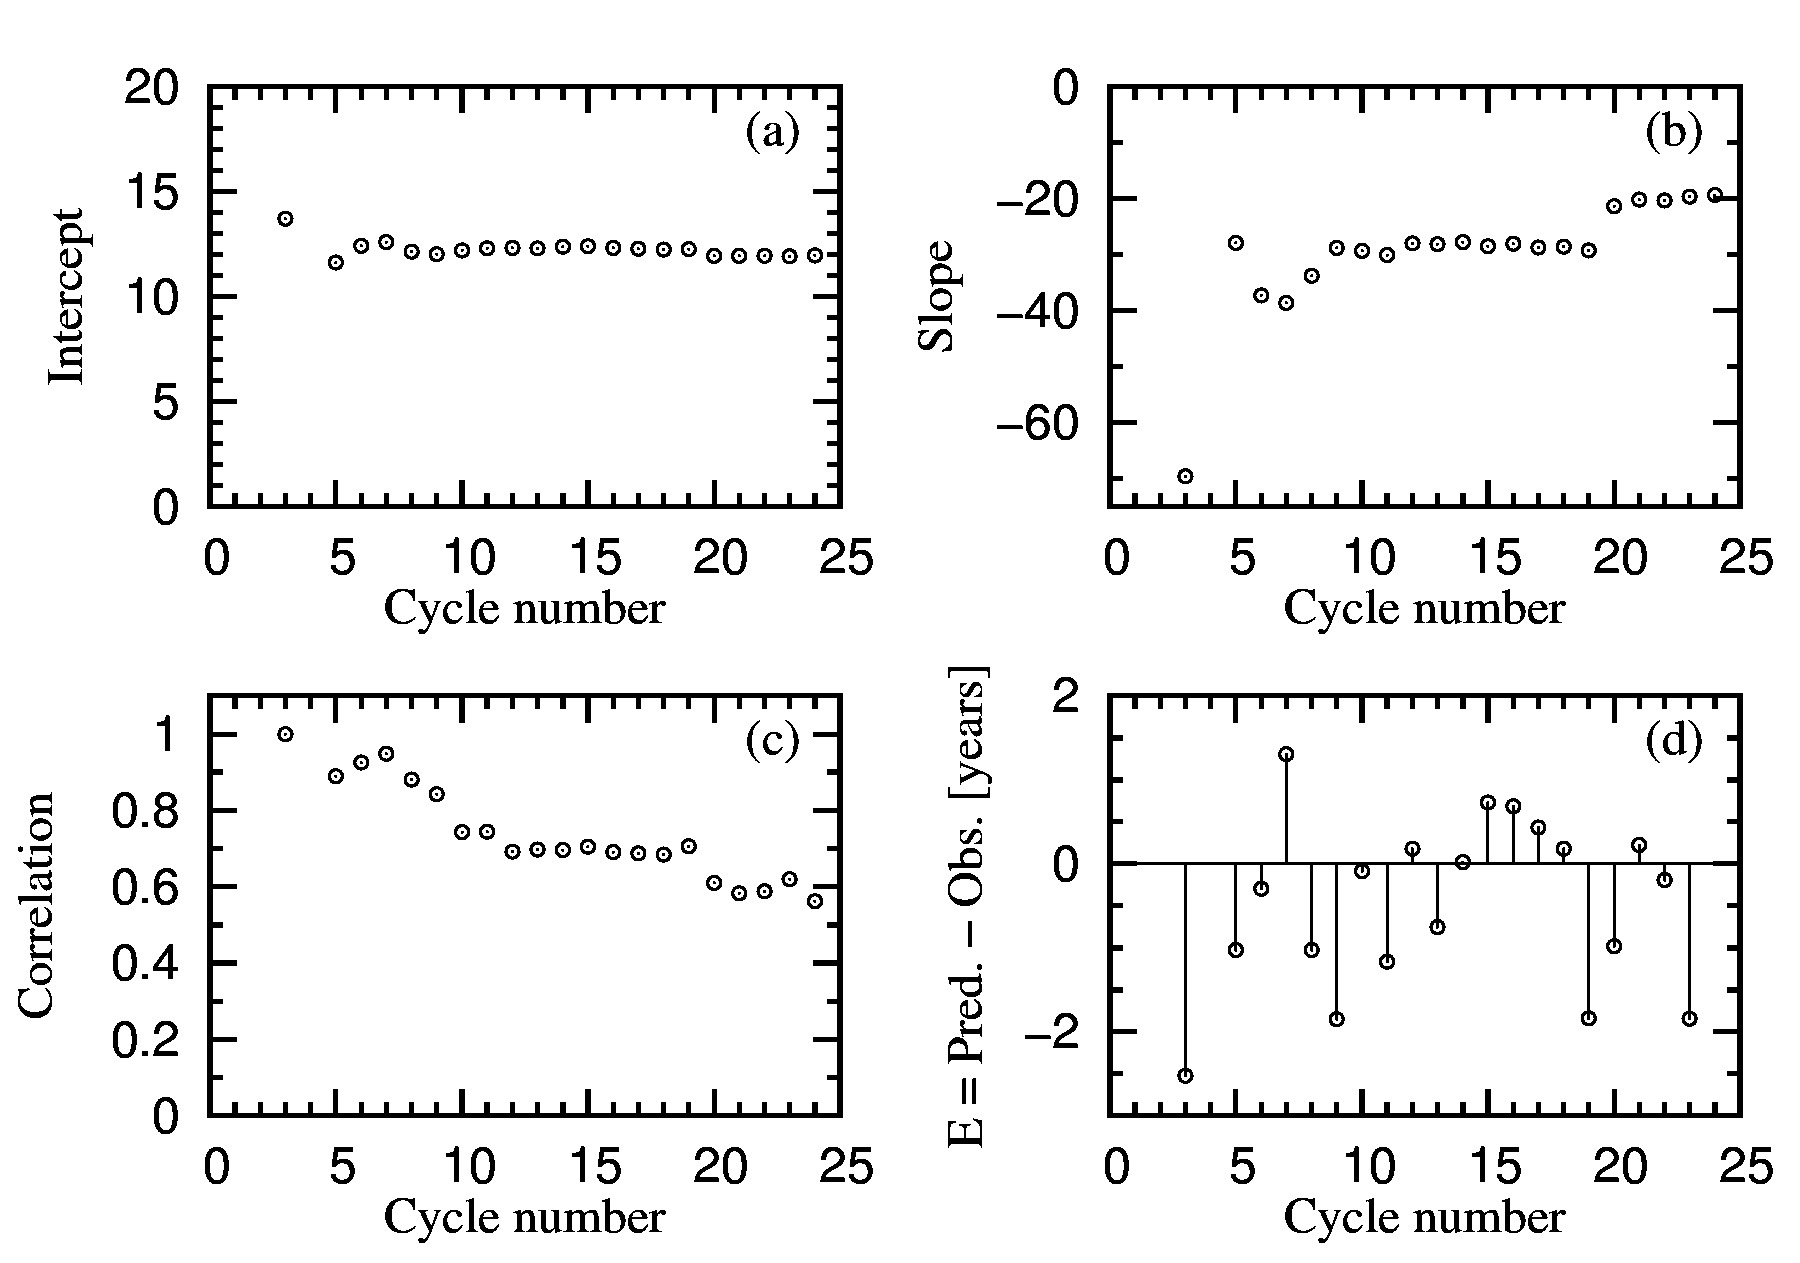
We complete the solar-cycle length study with the same incremental, causal analysis of its stability. In Figure \ireffig:causalCycleLength we show how the unfolding of new cycles has progressively shaped the inverse relationship between total length and curvature at the leading minimum reported here. We find that the intercept has been very consistent through time. As panel (b) of Figure \ireffig:causalCycleLength shows, the extreme character of Cycle 19 had a significant influence redefining the slope of the regression, which has subsequently remained stable.
3.4 Summary
ss:summary
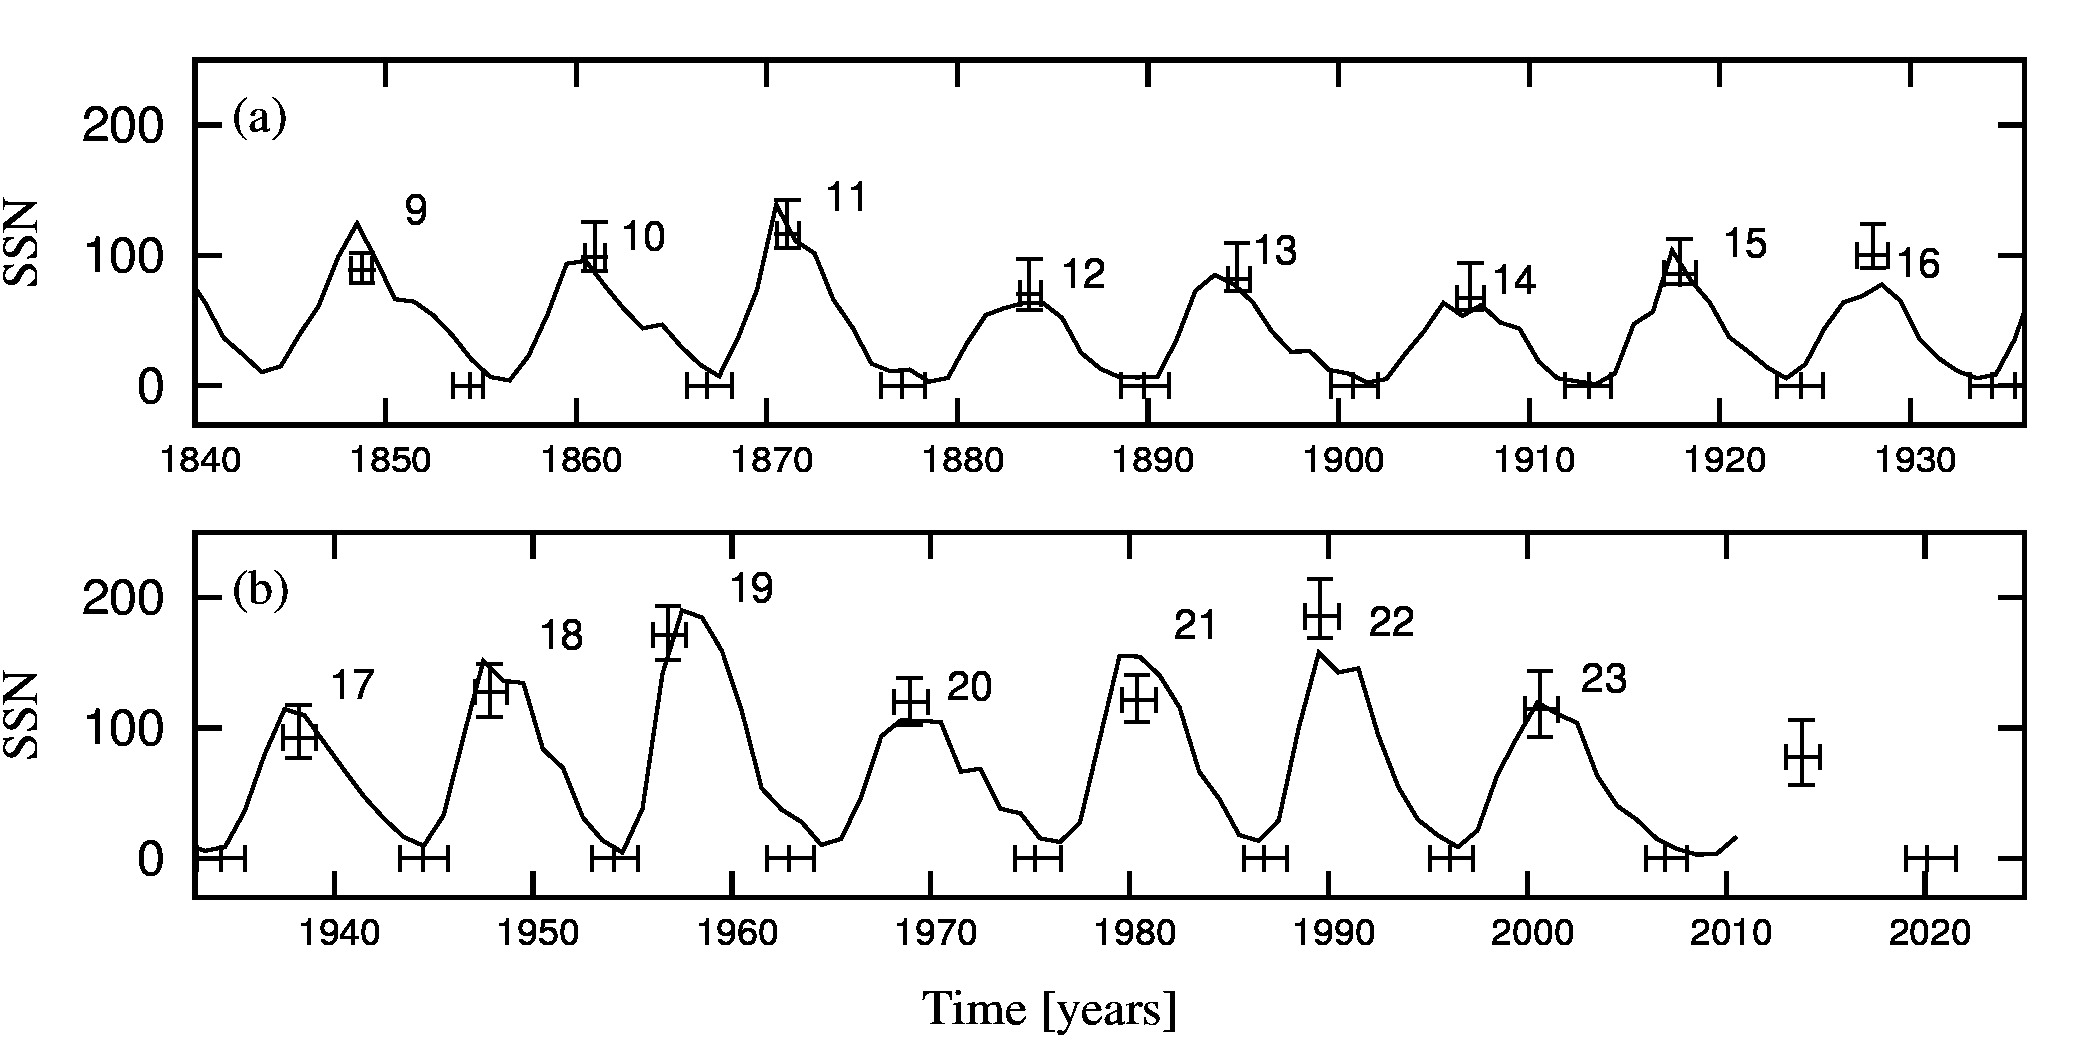
In this subsection we collect the predictions obtained above into a consolidating view of forecasted solar-cycle features through time. In Figure \ireffig:causalPredictions we plot the time series of yearly averages of sunspot numbers together with predictions elaborated with the methodology presented in this work. Forecasts have been made in a purely causal manner by always using information from the past. Every prediction (and its 90% confidence interval) is drawn from a regression to curvature at the starting minimum that only sees the available data from previous cycles. Notice the expanding character of confidence intervals as new cycles are incorporated to the proposed linear models. In the case of solar-cycle length predictions we use horizontal bars on the time axis (with an ordinate of 0). The most recent bars depict our predictions for Solar Cycle 24.
4 Conclusions
In this work we have applied a previously developed methodology for maximum solar activity prediction Verdes et al. (2000) to the case of the current Solar Cycle 24, forecasting a cycle of moderate intensity (maximum sunspot number of 78). Furthermore, we have generalised it to study the problem of maximum and subsequent minimum intensity timing. The forecast of the latter features of solar activity bears a particular relevance, amongst others, for space mission planning, and space weather and climate change analyses.
The rationale behind the proposed methodology can be summarised in the following way: a fast-rising cycle (as measured by the curvature or second derivative at its starting minimum) is likely to be more intense than a slower-rising one. By the same intuition, its ascent time and total cycle length will be shorter. We have indeed found that the curvature at the leading minimum determines the main characteristics of the unfolding cycle. We have also demonstrated the stability through time of the proposed predictive models. We believe that the approach to solar-activity forecasting presented in this work constitutes a valuable addition to the existing body of statistical prediction methods in the literature.
Acknowledgements
We would like to thank an anonymous reviewer for his useful suggestions to improve this manuscript. Financial support by CONICET, ANPCYT/MINCYT and Universidad Nacional de Rosario is gratefully acknowledged.
References
- Calvo, Ceccatto, and Piacentini (1995) Calvo, R.A., Ceccatto, H.A., Piacentini, R.D.: 1995, Neural network prediction of solar activity. Astrophys. J. Lett. 444(2), 916 – 921.
- Choudhuri, Chatterjee, and Jiang (2007) Choudhuri, A.R., Chatterjee, P., Jiang, J.: 2007, Predicting solar cycle 24 with a solar dynamo model. Phys. Rev. Lett. 98(13).
- Clilverd et al. (2006) Clilverd, M.A., Clarke, E., Ulich, T., Rishbeth, H., Jarvis, M.J.: 2006, Predicting solar cycle 24 and beyond. Space Weather 4(9).
- De Meyer (2003) De Meyer, F.: 2003, A transfer function model for the sunspot cycle. Sol. Phys. 217(2), 349 – 366. doi:10.1023/B:SOLA.0000006856.85960.2e. 2003SoPh..217..349D.
- Dikpati, de Toma, and Gilman (2006) Dikpati, M., de Toma, G., Gilman, P.A.: 2006, Predicting the strength of solar cycle 24 using a flux-transport dynamo-based tool. Geophys. Res. Lett. 33(5).
- Dikpati, Gilman, and de Toma (2008) Dikpati, M., Gilman, P.A., de Toma, G.: 2008, The waldmeier effect: An artifact of the definition of wolf sunspot number? Astrophys. J. Lett. 673(1), L99.
- Duhau (2003) Duhau, S.: 2003, An early prediction of maximum sunspot number in solar cycle 24. Sol. Phys. 213(1), 203 – 212. doi:10.1023/A:1023260916825. 2003SoPh..213..203S..Duhau.
- Grassberger et al. (1993) Grassberger, P., Hegger, R., Kantz, H., Schaffrath, C., Schreiber, T.: 1993, On noise reduction methods for chaotic data. Chaos 3(2), 127 – 142.
- Hamid and Galal (2006) Hamid, R.H., Galal, A.A.: 2006, Preliminary prediction of the strength of the 24th 11-year solar cycle. In: Proc. Internat. Astronom. Union 2, 413 – 416.
- Hathaway and Wilson (2006) Hathaway, D.H., Wilson, R.M.: 2006, Geomagnetic activity indicates large amplitude for sunspot cycle 24. Geophys. Res. Lett. 33(18).
- Hathaway, Wilson, and Reichmann (1994) Hathaway, D.H., Wilson, R.M., Reichmann, E.J.: 1994, The shape of the sunspot cycle. Sol. Phys. 151, 177 – 190. doi:10.1007/BF00654090. 1994SoPh..151..177H.
- Hathaway, Wilson, and Reichmann (2002) Hathaway, D.H., Wilson, R.M., Reichmann, E.J.: 2002, Group sunspot numbers: Sunspot cycle characteristics. Sol. Phys. 211, 357 – 370. doi:10.1023/A:1022425402664. 2002SoPh..211..357H.
- Hiremath (2008) Hiremath, K.M.: 2008, Prediction of solar cycle 24 and beyond. Astrophys. Space Sci., 1 – 5.
- Horstman (2005) Horstman, M.: 2005, Varying solar flux models and their effect on the future debris environment Projection. Orbital Debris Q. News 9, 4 – 5.
- Huber (1981) Huber, P.J.: 1981, Robust statistics, Wiley series in probability and mathematical statistics. Probability and mathematical statistics, John Wiley & Sons, Hoboken, New Jersey. ISBN 9780471418054.
- Jain (2006) Jain, R.: 2006, Prediction of the amplitude in sunspot cycle 24. 36th COSPAR 36, 642.
- Kane (1999) Kane, R.P.: 1999, Prediction of the sunspot maximum of solar cycle 23 by extrapolation of spectral components. Sol. Phys. 189(1), 217 – 224. doi:10.1023/A:1005298313886. 1999SoPh..189..217R.P..Kane.
- Kane (2007) Kane, R.P.: 2007, A preliminary estimate of the size of the coming solar cycle 24, based on Ohl’s precursor method. Sol. Phys. 243(2), 205 – 217. doi:10.1007/s11207-007-0475-4. 2007SoPh..243..205R..P..Kane.
- Kim, Wilson, and Cucinotta (2006) Kim, M.Y., Wilson, J.W., Cucinotta, F.A.: 2006, A solar cycle statistical model for the projection of space radiation environment. Adv. Space Res. 37(9), 1741 – 1748.
- Krivova, Solanki, and Beer (2002) Krivova, N.A., Solanki, S.K., Beer, J.: 2002, Was one sunspot cycle in the 18th century really lost? Astron. Astrophys. 396(1), 235 – 242.
- Lantos (2006) Lantos, P.: 2006, The skewness of a solar cycle as a precursor of the amplitude of the next. Sol. Phys. 236, 199 – 205. doi:10.1007/s11207-006-0145-y. 2006SoPh..236..199L.
- Maris and Oncica (2006) Maris, G., Oncica, A.: 2006, Solar Cycle 24 Forecasts. Sun Geospace 1, 8 – 11.
- Ossendrijver (2003) Ossendrijver, M.: 2003, The solar dynamo. Astron. Astrophys. Rev. 11, 287 – 367.
- Pesnell (2008) Pesnell, W.D.: 2008, Predictions of solar cycle 24. Sol. Phys. 252(1), 209 – 220. doi:10.1007/s11207.008.9252.2. 2008SoPh..252..209William.Dean.Pesnell.
- Savitzky and Golay (1964) Savitzky, A., Golay, M.J.E.: 1964, Smoothing and differentiation of data by simplified least squares procedures. Anal. Chem. 36(8), 1627 – 1639.
- Schatten (2005) Schatten, K.: 2005, Fair space weather for solar cycle 24. Geophys. Res. Lett. 32(21), 1 – 4.
- Svalgaard, Cliver, and Kamide (2005) Svalgaard, L., Cliver, E.W., Kamide, Y.: 2005, Sunspot cycle 24: Smallest cycle in 100 years? Geophys. Res. Lett. 32(1), 1 – 4.
- Usoskin, Mursula, and Kovaltsov (2001) Usoskin, I.G., Mursula, K., Kovaltsov, G.A.: 2001, Was one sunspot cycle lost in late xviii century? Astron. Astrophys. 370(2), L31 – L34.
- Usoskin et al. (2009) Usoskin, I.G., Mursula, K., Arlt, R., Kovaltsov, G.A.: 2009, A Solar Cycle Lost in 1793-1800: Early Sunspot Observations Resolve the Old Mystery. Astrophys. J. Lett. 700, L154 – L157.
- Verdes, Granitto, and Ceccatto (2004) Verdes, P.F., Granitto, P.M., Ceccatto, H.A.: 2004, Secular behavior of solar magnetic activity: Nonstationary time-series analysis of the sunspot record. Sol. Phys. 221(1), 167 – 177. doi:10.1023/B:SOLA.0000033361.20655.ed. 2004SoPh..221..167V.
- Verdes et al. (2000) Verdes, P.F., Parodi, M.A., Granitto, P.M., Navone, H.D., Piacentini, R.D., Ceccatto, H.A.: 2000, Predictions of the maximum amplitude for solar cycle 23 and its subsequent behavior using nonlinear methods. Sol. Phys. 191(2), 419 – 425.
- Waldmeier (1955) Waldmeier, M.: 1955, Ergebnisse und probleme der sonnenforschung, Akademische Verlagsgesellschaft, Leipzig.
- Wang et al. (2002) Wang, J.L., Gong, J.C., Liu, S.Q., Le, G.M., Sun, J.L.: 2002, The prediction of maximum amplitudes of solar cycles and the maximum amplitude of solar cycle 24. Chin. J. Astron. Astrophys. 2(6), 557 – 562.
- Zolotova and Ponyavin (2011) Zolotova, N.V., Ponyavin, D.I.: 2011, Enigma of the solar cycle 4 still not resolved. Astrophys. J. 736(2), 115.