Facultad de Ciencias Exactas, Universidad Nacional de La Plata
C.C. 67, 1900 La Plata, Argentina. 22institutetext: Departamento de Fisica Teorica and Instituto de Física Corpuscular, Universidad de Valencia-CSIC, E-46100 Burjassot (Valencia), Spain.
Nuclear and partonic dynamics in the EMC effect
Abstract
It has been recently confirmed that the magnitude of the EMC effect measured in electron deep inelastic scattering is linearly related to the Short Range Correlation scaling factor obtained from electron inclusive scattering. By using a -rescaling approach we are able to understand the interplay between the quark-gluon and hadronic degrees of freedom in the discussion of the EMC effect.
pacs:
24.85.+pQuarks, gluons, and QCD in nuclear reactions and 25.30.MrMuon-induced reactions (including the EMC effect) and 12.38.-tQuantum chromodynamics1 Introduction
Deep Inelastic Scattering (DIS) provides a tool for probing the quark momentum distribution in nucleons and in nuclei. Since the first indications that DIS structure functions measured in charged-lepton scattering off nuclei differ significantly from those measured in isolated nucleons Aubert:1983xm ; Arnold:1983mw there has been a continuous interest in fully understanding the microscopic mechanism responsible for the so called EMC effect and how it affects the momentum distribution of quarks in nuclei.
The experiment E03-103 at Jefferson Lab has provided precise measurements of the EMC effect at large , in light nuclei, 3He, 4He, 9Be and 12C Seely:2009gt . In Refs. Higinbotham:2010tb ; Weinstein:2010rt ; Piasetzky:2011zz ; Arrington:2012ax ; Hen:2012fm it was shown that the EMC effect is linearly related to the short-range correlation (SRC) scale factor . This factor follows from the experimental observation that the ratio of inclusive electron scattering cross section from target nucleus and from Deuteron scales for the Bjorken scaling variable , where , in the range at moderate and therefore it has been suggested Frankfurt:1993sp , that
| (1) |
where is the effective cross section for scattering off a correlated cluster in nucleus A. The SRC represent the high momentum components of the nuclear wave function, which can be described in terms of nucleonic degrees of freedom. They are responsible (in medium and heavy nuclei) for around % of the kinetic energy of nucleons in the nuclei Frankfurt:2009vv . Assuming that does not depend on the target nucleus then and can be connected to the number of correlated pairs in Vanhalst:2012ur . It is clear that the SRC contain no explicit quark-gluon effects and arise solely from nucleonic dynamics.
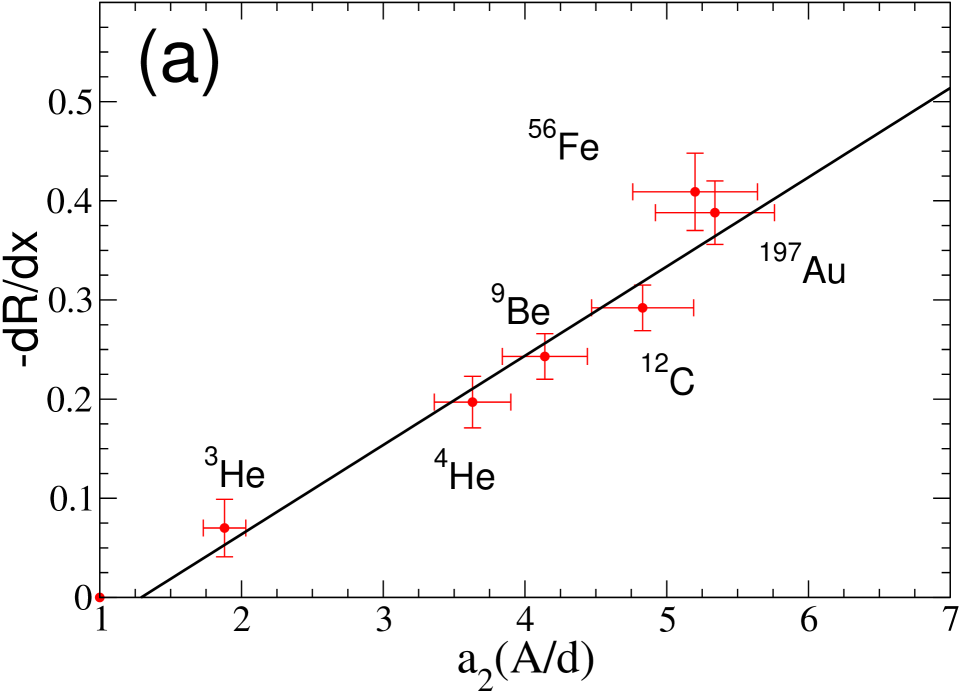
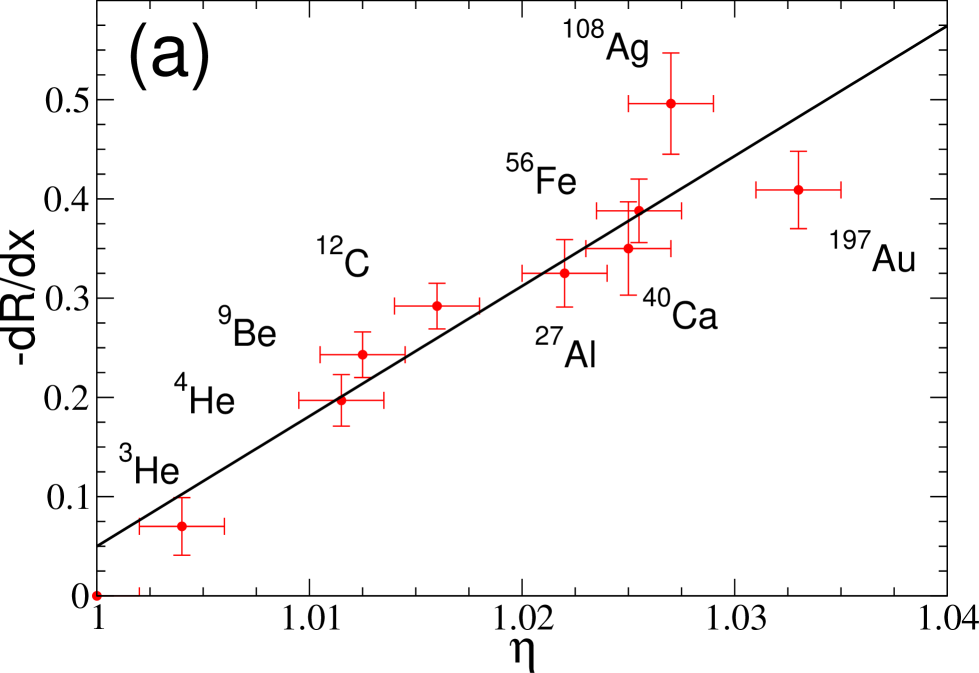
Let us show the mentioned dependence of the EMC effect by plotting its slope versus the SRC scale factor . In Fig. 1a we plot the overall fit using the data of columns 2, 4, 7 and 8 of table I in Ref. Hen:2012fm , which correspond to data from Refs. Frankfurt:1993sp , Egiyan:2005hs and Fomin:2011ng for , and Ref. Weinstein:2010rt for . We have assigned one value for each nucleus which reflects the weighted average of different independent measurements and added a uncertainty to due to the thereoretical corrections needed to extract the data. We obtain a reasonably good linear fit, with a slope of and a ,111 Note that in this analysis we include the errors in the and coordinates in the calculation of . Let and be the data points and and the corresponding errors, let be the fitted line, then . Therefore, a good fit arises when numericalrecipes . Note, that if we would consider that the coordinate has no error, as is done in fits to experimental data like in Fig. 3, we would get in this case . but discover that the high nuclei lie all above, and most of low nuclei below, the line.
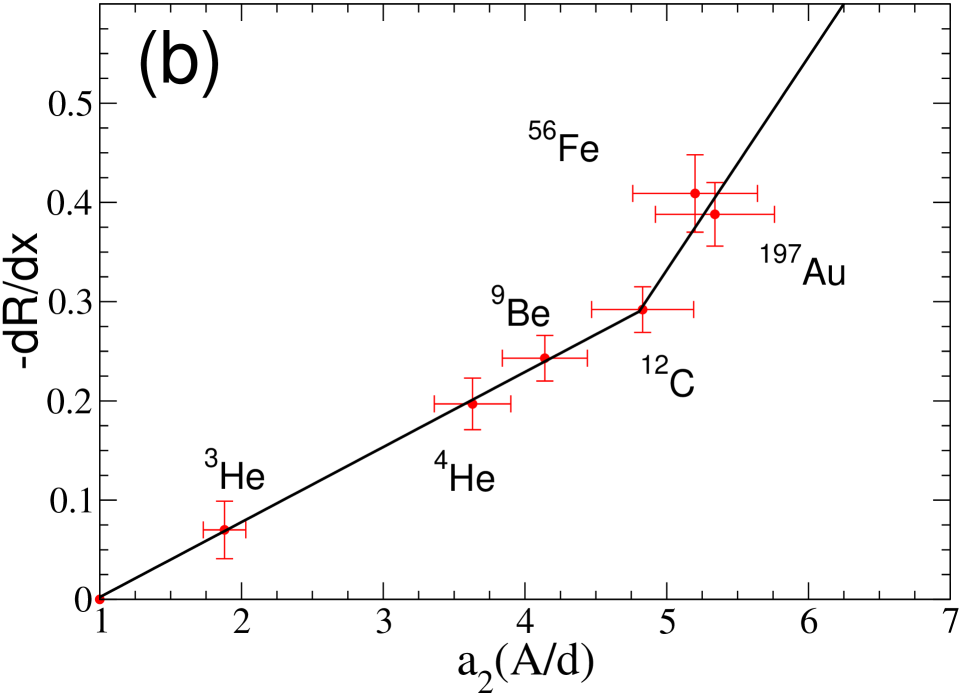
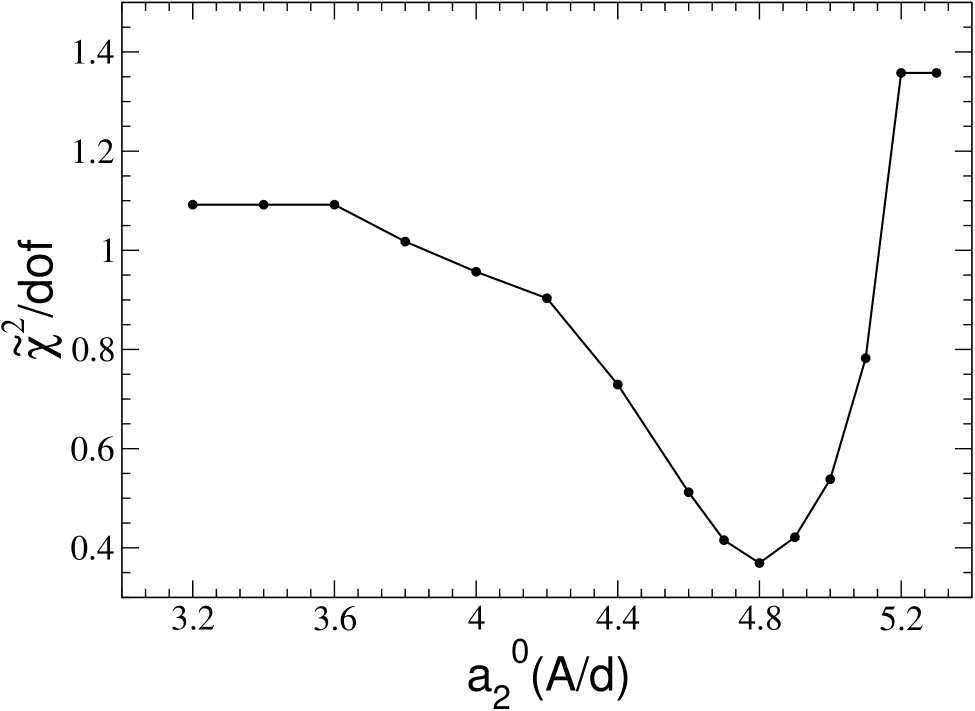
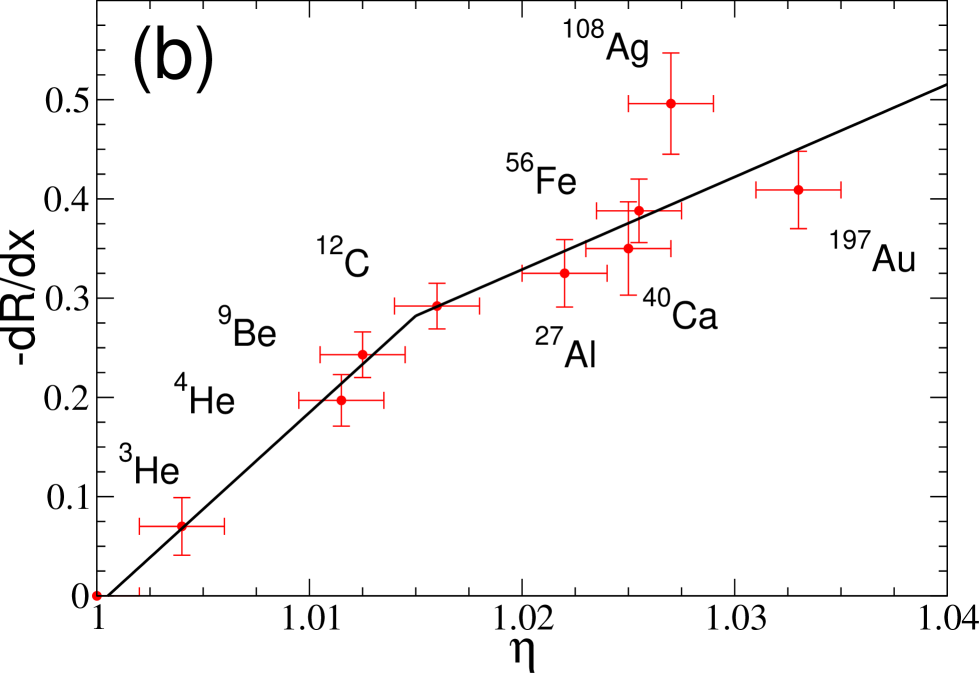
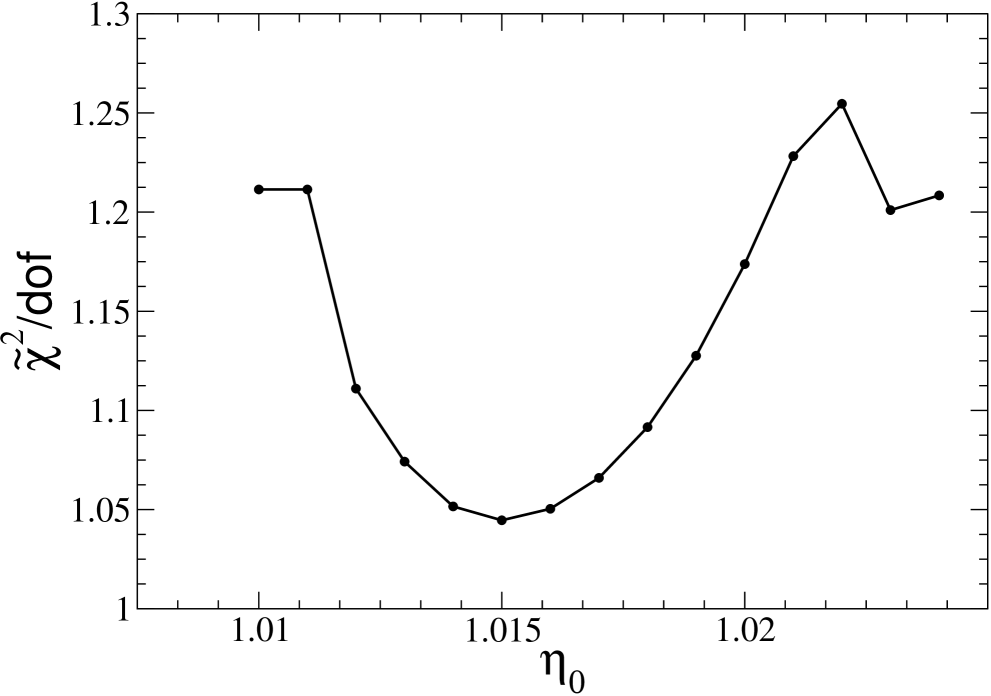
In the light of the latter observation we proceed to fit two lines one for heavy and the other for light nuclei. The position of the dividing point is obtained from minimization of and is found to correspond to 12C as shown in Fig. 1b. In Fig. 2 we show the dependence of the on the position of the dividing point, it is clearly seen that the region of 12C corresponds to the minimum of the . The fit is now, ,222With no errors for . and the slope of the straight line is steeper for heavy nuclei () than for light ones (). Therefore, we conclude that whatever physics governs these two observables has a drastic change around 12C. Regardless of this result, the fact that the EMC effect might be explained in terms of purely hadronic physics, is a matter of thought.
2 The Model
These developments moved us to reanalyze the data in a formalism with only one parameter per nucleus GarciaCanal:1984eh , related to the binding energy of nucleons in nuclei Akulinichev:1985ij ; GarciaCanal:1986xe . In this approach the EMC effect was described by suggesting that the true scaling variable for deep-inelastic scattering off nuclei should be taken to be
| (2) |
with and is the free parameter. Consequently, the ratios of the nuclear to deuteron structure functions can be written as follows
| (3) |
where is the nuclear structure function calculated using a rescaled variable and the free nucleon structure function, and is the deuteron structure function where the effects of rescaling are small. For the free nucleon structure functions we used the parametrization of Ref.Martin:2009iq .
The main issue in that work was to obtain quark distributions shifted towards lower values as compared to those corresponding to free nucleons, a mechanism which was called -rescaling. A direct connection between this -rescaling approach and the -rescaling Close:1985ji , based on the renormalization group evolution related to the perturbative quark-gluon structure of the nucleons, was already shown in Ref.GarciaCanal:1986xe .
| A | 3He | 4He | 9Be | 12C | 56Fe | 197Au |
|---|---|---|---|---|---|---|
3 Analysis of data
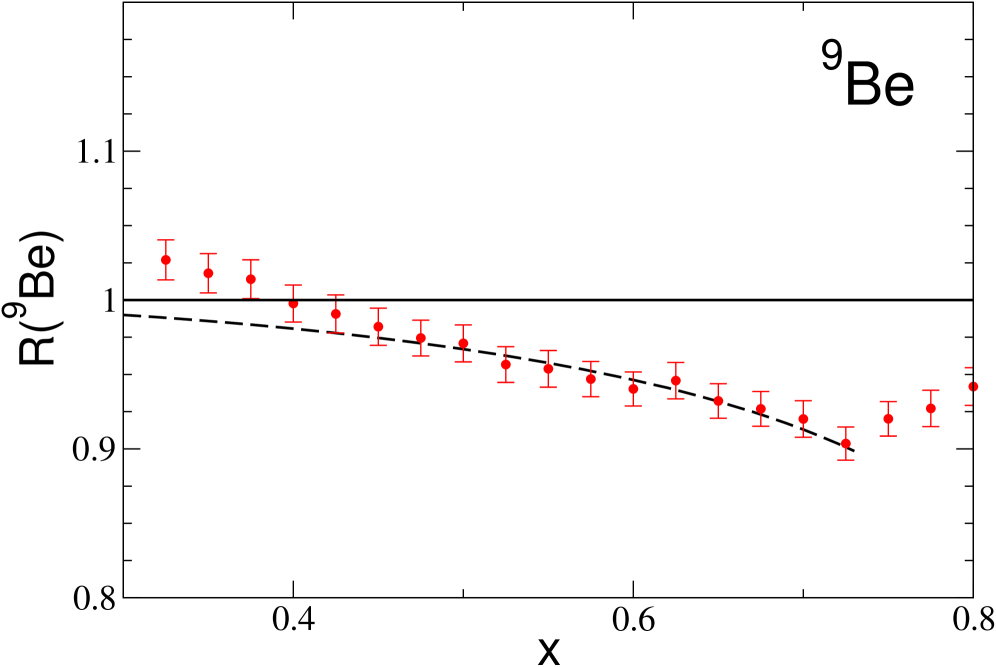
The above formalism leads to fits of very good quality for the EMC effect in the region based on the -rescaling model. We show in Fig. 3 an example of a standard fit for 9Be corresponding to a value restricted to the -region of present interest. Similar quality was obtained for all the nuclei considered. In Table 1 we summarize the values of obtained.
In order to compare our results with the SRC proposal Weinstein:2010rt , we take the values of the measured EMC slopes they quote in their Table I, corresponding also to the range . In addition to the nuclei presented in Fig.1 and Table 1 we use SLAC experimental data for the EMC ratios for 27Al, 40Ca and 108Ag Aubert:1983xm and the corresponding . We include these data to improve the statistics in the range of heavy nuclei and, as we discuss later, this allows us to present some predictions of the corresponding values.
With these experimental data and the values obtained in the fit, we produce Fig. 4a that also shows a linear dependence of the EMC slopes with the effective mass parameter . The value of the slope is and the quality of the fit is characterized by . A similar fit in terms of binding energy has been recently performed in Ref. Benhar:2012nj .
We note by looking to Fig. 4a that, even if the linear fit with one straight line is quite reasonable, a fit with a piecewise linear function consisting of two parts with different slopes, one for the light nuclei and one for the heavy as shown in Fig. 4b, might be more precise. Our statistical analysis confirms our suspicion that the two line fit is at least as good as the one with one straight line. In fact, we obtain and the corresponding slopes are for the light nuclei and for the heavy ones. One sees that the slope for the heavy nuclei is two times smaller than the slope for the light nuclei. Moreover, we realize that the transition from the region of light nuclei to that of the heavy nuclei takes place at which corresponds to carbon. This value of results from the minimization of in the fitting with a piecewise function.
In Fig. 5 we show the calculated values (divided by the number of degrees of freedom) as a function of the parameter which is the value of the parameter that divides the range of into light and heavy nuclei. This value of , comparable to the previous one, establishes that this fit might be physically motivated. The lack of data for heavy nuclei impedes a better discrimination.
Certainly, given the relation between all the various treatments mentioned before, similar plots of as a function of confinement scales GarciaCanal:1986xe ; Close:1985ji ; Close:1984zn can be produced.
We observe again that the physics one can associate with the heavy nuclei might be different from that related to light nuclei. The average nucleon interaction energy () grows faster with for the heavy nuclei than it does for the light nuclei GarciaCanal:1986xe ; Moniz:1971mt .
Thus we arrive to an impasse, we find linear correlations between both in the hadronic scheme with , and in the quark-gluon scheme with . Both schemes are able to explain the EMC phenomenon () and therefore we can associate it either to the effect of the local nuclear environment as characterized by the high momentum components of the nuclear wave function Seely:2009gt , as well as, to -rescaling through arguments based on perturbative QCD, but, and this is important, through the non perturbative parameter related to the the binding energy.
| A | 27Al | 40Ca | 108Ag |
|---|---|---|---|
| (Fig.6) | |||
| (Fig.1 ) |
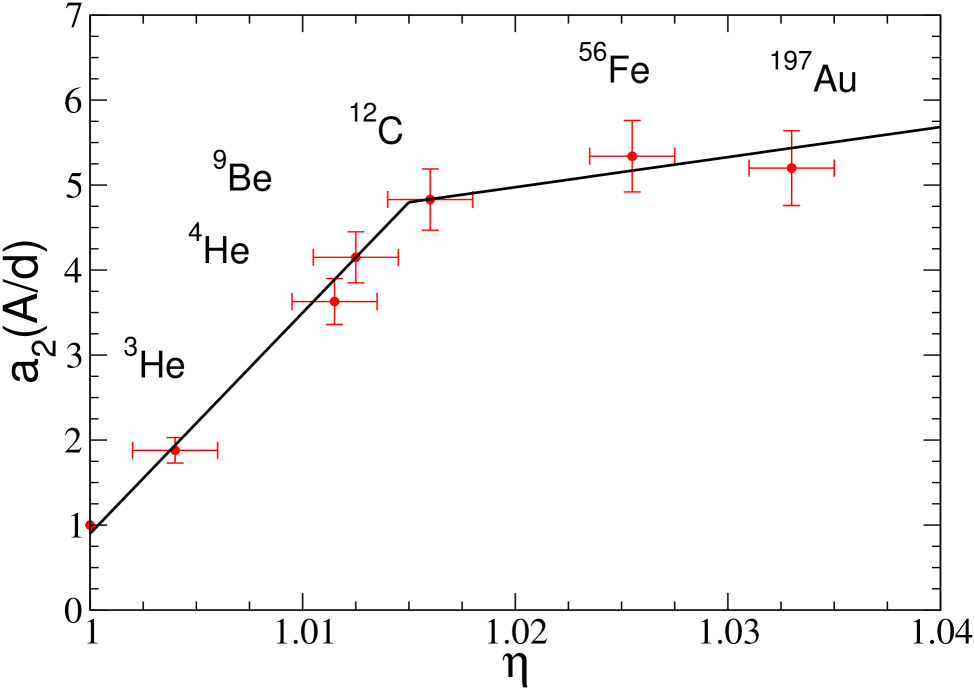
We can establish a linear relation between the parameter and the SRC scale factor , also found in ref. Vanhalst:2012zt . However, in Fig. 6 we show that this relation is better fitted again by a two linear fit. This implies that both treatments are related in a mathematical form which distinguishes between light and heavy nuclei. This plot allows us to predict the values of the scale factor for 27Al, 40Ca and 108Ag. We present these values in the Table 2, together with the predictions from the EMC slopes of the vs. parametrization in the region of heavy nuclei from the Fig.1b. The errors were estimated using the error of parameter for the former and using the known experimental error for EMC slopes for the latter. It is seen that the values of for 27Al and 40Ca agree within the error.
4 Conclusions
Before we proceed to comment on these results we would like to emphasize that the main outcome of our investigation has been to make explicit that the interesting linear correlation between the EMC effect and the SRC can be extended to a linear correlation between the EMC effect and the -rescaling parameter which leads to a linear correlation between and SRC, for us a signature of QCD-hadron duality. We have also made the observation that these linear relations might be too naive and that some high-low average dynamics might separate the EMC effect in two regimes. More data should clarify this issue and help understand QCD-hadron duality.
However, none of the shown treatments is purely QCD or purely hadronic. Both contain in their parametrizations the other component. In the case of the -rescaling the hadronic behavior enters through the parameter, an in medium hadronic property. In the case of the SRC motivated relation one should recall Weinberg’s theorem Weinberg:1978kz which implies that QCD in some kinematical regime can be understood in terms of purely hadronic degrees of freedom. The quark-gluon behavior arises through the fitting of the dynamical constants. These treatments are both highly non additive.
Fig. 6 shows a low variation of with for large , which suggests a low sensitivity of to the detailed nuclear dynamics for heavy nuclei. On the other hand, the rapid variation at low , suggests that a QCD type description might be adequate in this regime. This fit has been made assuming the , as obtained in Fig. 5, and we obtain for it.
It has been argued that one should use , where is the nucleus four momentum, rather than to represent the data in order to work in the nucleus reference frame Frankfurt:2012qs . This is precisely what Fig. 6 does. It represent the data in terms of the nucleus effective and therefore the dependence is dynamical and not kinematical.
The dependence of the EMC contribution has been obtained in a microscopic treatment of the EMC effect which separates all the various components contributing to the process, i.e. nucleon structure, equivalent photon and the hadronic components Frankfurt:2012qs . In our treatment the various dependences are implicit. Note that their scaling variable is purely perturbative not like our parameter which is non perturbative. A relation between both approaches would clarify some issues and provide the dependence. We may speculate at this point based on preliminary calculations that the low and low () regime is best suited to see the almost perturbative -rescaling behavior.
The linear correlation between the different parameters shown in here allows one to conclude that in hadronic language, as it was suggested in Seely:2009gt , the nuclear dependence of the quark distributions is directly related to the local nuclear environment of the acted nucleon, and in terms of quark-gluon language the nucleons in the medium are bound and therefore their x-rescaling parameter is larger than in the vacuum. Both statements represent a dual view of the EMC effect.
Acknowledgements.
We acknowledge useful conversations with H. Fanchiotti. We thank O. Hen for a clarifying discussion regarding the linear fits. We are thankful to J. Ryckebusch for sending their results prior to publication and for useful comments. C.A.G.C. acknowledges illuminating exchanges with R. Sassot. C.A.G.C. and T.T. have been partially supported ANPCyT Argentina. V.V. has been funded by the Ministerio de Economía y Competitividad and EU FEDER under contract FPA2010-21750-C02-01, by Consolider Ingenio 2010 CPAN (CSD2007-00042), by Generalitat Valenciana: Prometeo/2009/129, by the European Integrated Infrastructure Initiative HadronPhysics3–(Grant number 283286).References
- (1) J. J. Aubert et al. [European Muon Collaboration], Phys. Lett. B 123, (1983) 275.
- (2) R. G. Arnold, P. E. Bosted, C. C. Chang, J. Gomez, A. T. Katramatou, G. Petratos, A. A. Rahbar and S. Rock et al., Phys. Rev. Lett. 52, (1984) 727.
- (3) J. Seely, A. Daniel, D. Gaskell, J. Arrington, N. Fomin, P. Solvignon, R. Asaturyan and F. Benmokhtar et al., Phys. Rev. Lett. 103, (2009) 202301. [arXiv:0904.4448 [nucl-ex]].
- (4) D. W. Higinbotham, AIP Conf. Proc. 1374, (2011) 85. [arXiv:1010.4433 [nucl-ex]].
- (5) L. B. Weinstein, E. Piasetzky, D. W. Higinbotham, J. Gomez, O. Hen and R. Shneor, Phys. Rev. Lett. 106, (2011) 052301. [arXiv:1009.5666 [hep-ph]].
- (6) E. Piasetzky, L. B. Weinstein, D. W. Higinbotham, J. Gomez, O. Hen and R. Shneor, Nucl. Phys. A 855, (2011) 245.
- (7) J. Arrington, A. Daniel, D. Day, N. Fomin, D. Gaskell and P. Solvignon, Phys. Rev. C 86 (2012) 065204 [arXiv:1206.6343 [nucl-ex]].
- (8) O. Hen, E. Piasetzky and L. B. Weinstein, Phys. Rev. C 85, (2012) 047301. [arXiv:1202.3452 [nucl-ex]].
- (9) L. L. Frankfurt, M. I. Strikman, D. B. Day and M. Sargsyan, Phys. Rev. C 48, 2451 (1993).
- (10) L. Frankfurt, M. Sargsyan and M. Strikman, AIP Conf. Proc. 1056, (2008) 322. [arXiv:0901.2340 [nucl-th]].
- (11) M. Vanhalst, J. Ryckebusch and W. Cosyn, Phys. Rev. C 86 (2012) 044619 [arXiv:1206.5151 [nucl-th]].
- (12) K. S. Egiyan et al. [CLAS Collaboration], Phys. Rev. Lett. 96, (2006) 082501. [nucl-ex/0508026].
- (13) N. Fomin, J. Arrington, R. Asaturyan, F. Benmokhtar, W. Boeglin, P. Bosted, A. Bruell and M. H. S. Bukhari et al., Phys. Rev. Lett. 108, (2012) 092502. [arXiv:1107.3583 [nucl-ex]].
- (14) W. H. Press, S. A. Teukolsky, W. T. Vetterling, B. P. Flannery, Numerical Recipes: The Art of Scientific Computing, Third Edition (2007), Cambridge University Press.
- (15) C. A. Garcia Canal, E. M. Santangelo and H. Vucetich, Phys. Rev. Lett. 53, (1984) 1430.
- (16) S. V. Akulinichev, S. A. Kulagin and G. M. Vagradov, Phys. Lett. B 158, (1985) 485.
- (17) C. A. Garcia Canal, E. M. Santangelo and H. Vucetich, Phys. Rev. D 35, (1987) 382.
- (18) A. D. Martin, W. J. Stirling, R. S. Thorne and G. Watt, Eur. Phys. J. C 63, (2009) 189. [arXiv:0901.0002 [hep-ph]].
- (19) F. E. Close, R. G. Roberts and G. G. Ross, Phys. Lett. B 168, (1986) 400.
- (20) O. Benhar and I. Sick, arXiv:1207.4595 [nucl-th].
- (21) F. E. Close, R. L. Jaffe, R. G. Roberts and G. G. Ross, Phys. Rev. D 31, (1985) 1004.
- (22) E. J. Moniz, I. Sick, R. R. Whitney, J. R. Ficenec, R. D. Kephart and W. P. Trower, Phys. Rev. Lett. 26 (1971) 445.
- (23) M. Vanhalst, J. Ryckebusch and W. Cosyn, arXiv:1210.6175 [nucl-th].
- (24) S. Weinberg, Physica A 96, (1979) 327.
- (25) L. Frankfurt and M. Strikman, Int. J. Mod. Phys. E 21 (2012) 1230002 [arXiv:1203.5278 [hep-ph]].