Radio sources in the Chandra Galactic Bulge survey111Based on observations made with ESO Telescopes at the La Silla Paranal Observatory under programme ID 085.D-0441 and 087.D-0596
Abstract
We discuss radio sources in the Chandra Galactic Bulge survey region. By cross-matching the X-ray sources in this field with the NVSS archival data, we find 12 candidate matches. We present a classification scheme for radio/X-ray matches in surveys taken in or near the Galactic Plane, taking into account other multi-wavelength data. We show that none of the matches found here is likely to be due to coronal activity from normal stars because the radio to X-ray flux ratios are systematically too high. We show that one of the sources could be a radio pulsar, and that one could be a planetary nebula, but that the bulk of the sources are likely to be background active galactic nuclei (AGN), with many confirmed through a variety of approaches. Several of the AGN are bright enough in the near infrared (and presumably in the optical) to use as probes of the interstellar medium in the inner Galaxy.
keywords:
X-rays:stars – radio continuum:stars – Galaxy:bulge – galaxies:active1 Introduction
The Chandra Galactic Bulge Survey (GBS) is a 12 square degree, shallow (2 ksec depth) survey of the inner Galaxy (Jonker et al. 2011 – hereinafter J11). The depth of the survey is chosen so that a large number of X-ray binaries can be detected, without the X-ray binaries being overwhelmed in numbers by cataclysmic variables and coronally active stars. The survey consists of two square degree strips, centered at zero degrees Galactic longitude and 1.5 degrees Galactic latitude – the densest star fields that are not heavily affected by extinction. The goals of the survey are to understand the Galactic field’s faint X-ray source population and to identify interesting individual objects for further follow-up. Some examples of the latter are eclipsing low mass X-ray binaries for which precise masses can be measured. At the present time, results have been reported for the first 9 square degrees of the GBS (J11).
The X-ray sources in this survey should form a heterogeneous population. A simple population synthesis calculation presented in J11 for the full 12 square degrees predicted that the survey would detect about 1600 sources, of which about 700 would be non-compact stars (mostly RS CVn and W UMa stars), about 600 would be cataclysmic variables, and about 300 would be X-ray binaries. Smaller numbers of sources are expected in a wide variety of other classes (e.g. background active galactic nuclei and millisecond pulsars). The first 9 square degrees of the survey turned up 1234 X-ray sources, so the total number density of sources from the population synthesis modeling is in good agreement with the real data.
Significant amounts of multi-wavelength follow-up are needed to determine the actual fractions of sources in each category, and to identify the most interesting individual sources. Substantial progress can be made on this front by using public catalogs, and in this paper, we present the results of matching the GBS sources against the National Radio Astronomy Observatory (NRAO) Very Large Array (VLA) Sky Survey (NVSS; Condon et al. 1998) catalog, and what these sources are likely to be. A wide variety of Galactic and extragalactic classes of objects can emit in both the radio and X-ray bandpasses, and in many cases, just the ratio of radio flux to X-ray flux can dramatically limit the range of possible classes of objects, and additional constraints can come from adding photometric data from public catalogs. We also consider correlations against other radio surveys, mainly to add spectral information or data from higher spatial resolution imaging, but we use the NVSS matches as the baseline for our work on radio correlations with the X-ray sources because it is the deepest survey covering the entire GBS field.
2 The data
We take the GBS catalog from Jonker et al. (2011). Throughout this paper, we will refer to sources as CX , where is the number of the entry in the GBS catalog, rather than using a more cumbersome name based on the source’s position on the sky. We also note that the GBS catalog is sorted by numbers of source counts, so that the low number sources in the GBS catalog are the brightest ones, which may lead to the source names having a bit more value in conveying some intuition about their properties to the readers. We convert the X-ray count rates to fluxes from 0.5-8.0 keV using the same relation as in J11, ergs/sec/cm2/photon, which comes from assuming a power law spectrum with and foreground absorption with = cm-2. The counts-to-energy conversion is likely to produce no more than a factor of a few systematic uncertainty in the X-ray luminosity for the different classes of sources that could be emitting both in radio and X-rays, on the same order as the statistical uncertainties for the faintest sources in the survey. We also ignore the vignetting corrections for the sources near the edges of the field of view, but these corrections are also likely to be no more than a for off-axis angles less than 10’ (see Beckerman et al. 2003).
The NVSS covers the entire sky north of a declination of degrees at 1.4 GHz, and reaches a sensitivity level of about 2.5 mJy. The survey was obtained in D configuration with the VLA, and hence the angular resolution of the survey is about 45”. There are 629 radio sources in the NVSS in the full GBS survey region – so the NVSS source density is a bit less than half as high as the X-ray source density in the region. The positional accuracy of the bright NVSS sources is often better than 1”, but for the faintest sources in the catalog, it can be significantly worse. After inspection of a source list with a large matching radius, we decided to work with sources matching within 5”, because the number of matches started to fall off beyond that separation. There are 12 matches found, and their properties are listed in Table 1. All but one of the matches obtained here (source CX 390) are within either 1.2” or within the positional uncertainty of the NVSS.
The absolute astrometric calibration of the Chandra data is accurate to about 0.6”, based on matches between well-positioned Chandra sources and Tycho catalog sources, so we do not consider it problematic to include sources with greater than positional offsets, given that the offsets are in all cases within 0.6” of (and that with 12 real matches, it should be expected that a few of them will be at greater than 1 in any event). To estimate the number of chance superpositions, we shifted the positions of the X-ray sources by 12” and then by 24” both to the north and south, and attempted matching against the NVSS catalog. Doing so resulted in 3 matches in the four runs, so we estimate that there is likely to be approximately 1 false match in our list of likely associations. The sources matching within 1.2” are highly likely to be real matches, and probably, at most, one or two of the other matches is a chance superposition.
We have also searched against other radio catalogs made in this survey region. Where matches have been found, they are discussed within the descriptions of the individual sources. No matches were found against the survey made by Langston et al. (2000) with the NASA Green Bank Earth Station, which reached a flux density of 0.9 Jy at 8.35 GHz and 2.5 Jy at 14.35 GHz.
| GBS | CXOGBS | RA | DEC | NVSS | S1.4 | e_S1.4 | Separation | ||||
|---|---|---|---|---|---|---|---|---|---|---|---|
| 2 | J173728.3-290802 | 264.36831 | -29.13389 | 2191 | 0.1 | 0.8 | 173728-290801 | 47.4 | 1.5 | 0.1 | 10.94 |
| 40 | J174404.3-260925 | 266.01795 | -26.1571 | 35 | 0.1 | 2.4 | 174404-260924 | 7.3 | 0.5 | 0.7 | 13.56 |
| 49 | J173146.8-300309 | 262.94521 | -30.05255 | 30 | 0.2 | 0.8 | 173146-300309 | 90.5 | 2.8 | 0.5 | 13.45 |
| 52 | J174423.5-311636 | 266.09819 | -31.27687 | 29 | 0.5 | 0.8 | 174423-311636 | 424.6 | 14.9 | 0.2 | ND |
| 233 | J174206.1-264117 | 265.52569 | -26.68812 | 10 | 1.4 | 7.8 | 174206-264119 | 3.5 | 0.5 | 5.0 | 15.68? |
| 293 | J174000.6-274816 | 265.00267 | -27.8046 | 9 | 0.2 | 0.7 | 174000-274816 | 169.5 | 6.0 | 0.4 | 13.33 |
| 390 | J173607.5-294858 | 264.03134 | -29.81623 | 7 | 0.4 | 1.0 | 173607-294855 | 29.0 | 1.3 | 3.1 | 15.92 |
| 488 | J173605.3-283232 | 264.02231 | -28.54229 | 6 | 0.5 | 0.8 | 173605-283232 | 125.8 | 4.5 | 1.1 | 14.94 |
| 494 | J173458.8-301328 | 263.74511 | -30.22469 | 6 | 0.8 | 1.0 | 173458-301329 | 28.6 | 1.0 | 0.9 | 12.51? |
| 578 | J174442.3-311633 | 266.17636 | -31.2761 | 5 | 0.3 | 14.1 | 174442-311637 | 2.8 | 0.6 | 3.1 | 14.19? |
| 937 | J175359.2-281720 | 268.49683 | -28.28917 | 3 | 0.2 | 0.8 | 175359-281722 | 51.9 | 1.6 | 1.0 | 13.32 |
| 1234 | J173531.4-295145 | 263.88121 | -29.86272 | 3 | 0.5 | 5.0 | 173531-295147 | 4.7 | 0.5 | 3.3 | 15.84 |
| Source class | log () | Radio spectrum | Comments | ||
|---|---|---|---|---|---|
| Active star | -15.5 | wide range | flat | saturates at | |
| highest for RS CVn only | |||||
| Ultracool active dwarf | -15.5 to -11.5 | flat | |||
| Colliding wind binary | -5 to -7 | flat | |||
| Single massive star | -5 to -7 | +0.6 | |||
| Pre-main sequence star | -15 to -13 | usually flat | based on highly incomplete sample | ||
| Class I YSO | -15 to -13 | usually +0.6 | based on highly incomplete sample | ||
| some outliers exist in spectral index | |||||
| Class 0 YSO | undet. in X-rays | ||||
| X-ray binary | -15 to -13* | wide range | flat at low | *radio can be brighter for some HMXBs | |
| much fainter for neutron star systems, | |||||
| espec. faint for slow X-ray pulsars | |||||
| Pulsar | -16.7 to -6.7 | to | faint | Steeper than -1 | X-rays from Possenti relation, |
| so calibrated only above | |||||
| can have bright if massive companion | |||||
| Symbiotic star | to -11 | -3.4 to -8 | inverted | ||
| SNR | extended for any reasonable age; | ||||
| other properties widely variable; | |||||
| known Gal. SNRs 1 Jy | |||||
| PNe | 0 to -3 | usu. flat | Opt., IR are line dominated | ||
| PWN | -10 | faint | flat | oft. extended | |
| AGN | -9.7 to -14.9 | wide range | usu. -0.7 | rough IR, correlation, oft. ext. lobes | |
| Starburst | -10.5 | wide range | -0.7 | IR w/ | |
| Cluster of galaxies | -13 to -14 | -25.5 | steeper than -1 | mag for brightest indiv. gals. |
2.1 Optical spectroscopy
We have obtained spectra of the optical counterpart to CX 40 using the VIsible Multi-Object Spectrograph (VIMOS), the 4-channel imager and spectrograph mounted on the Nasmyth focus on the 8.6-m ESO Unit 3 Very Large Telescope at Paranal, Chile (Le Fèvre et al., 2003). For the observations we used VIMOS in MOS mode and selected the MR grism that cover the wavelength range Å and yields a 2.5 Å/pixel dispersion. A 1.0” arcsec slit width laser-cut at the source position (R.A = 266.018000, Dec = -26.156984) provided a spectral resolution of 750.
The observations for CX 40 were performed as a 1 hr service mode observing block (OB) on the night of 29 April 2011 (JD 2455680; OB ID 509202). The OB contained two spectroscopic integrations of 875 s on source, three flat-field exposures and arc lamp exposure for wavelength calibration . The data reduction was performed with the ESO-VIMOS pipeline.
2.2 Optical and infrared photometry
We acquired 8 nights of photometry, from 12-18 July 2010, with the Blanco 4.0 meter telescope at the Cerro Tololo Inter-American Observatory (CTIO). Using the Mosaic-II instrument, we observed the 9 square degree area containing the X-ray sources identified by the GBS (Jonker et al. 2011). Multiple SDSS band exposures with an integration time of 120 s of 45 overlapping fields were taken to cover the area. Typical seeing for the run was around 1”. The order in which each field was observed was randomized to minimize aliasing based on the time it took to cycle through fields. The data were reduced via the NOAO Mosaic Pipeline, which also added a world coordinate system to the images. The magnitudes produced are calibrated to USNO-B1 stars in the field by the NOAO Mosaic Pipeline. These stars are not carefully calibrated standards, and the magnitude calibration based on them carries an uncertainty of 0.5 magnitudes as quoted by the NOAO Data Handbook.
Photometry was done with Alard’s ISIS version 2.2, detailed in Alard & Lupton (1998) and Alard (2000). ISIS works by using a reference image which it then convolves with a kernel in an effort to match a subsequent image of the same field. The subsequent image is then subtracted from the convolved reference image. Since most stars are not variables, and are affected by atmospheric conditions similarly as nearby stars in the field, the convolution can match non-variable field stars from image to image. Therefore, any residual flux after subtraction is due to an inherent change in the brightness of a star. In order to save computation time, postage stamp sized cutouts of the full Mosaic images were taken around each object for processing. Any variables inside the X-ray position confidence region are considered candidate optical counterparts, though we only expect to see 20-25 chance alignments of variable optical stars and X-ray positions, given typical crowding in the fields and the abundance of variable field stars.
The result of the ISIS routine is a series of flux changes from the reference image, which are then converted to magnitudes by using IRAF to determine the number of counts from the star of interest in the reference image. Despite being in the unusual units of a change in flux, the photometry is differential because the convolution is done such that all non-variable field stars are matched between images, which has the same effect as normalizing counts to flux from comparison stars. Essentially, every star in the field becomes a comparison star.
Infrared photometric data are taken from existing catalogs. For relatively faint sources, we use the Vista Variables in the Via Lactea (VVV) survey data (Minniti et al. 2010; Saito et al. 2010; Saito et al. 2012), with flux from with the standard 2” apertures used. The uncertainties on the photometry are generally greater than the differences between the flxues from the 1” and the 2” apertures. For brighter sources, in which VVV can be saturated, we also look at the data from the 2MASS survey (Cutri et al. 1998). Details for which catalog has been used are given in the notes on the individual sources.
2.3 Radio to X-ray flux ratios
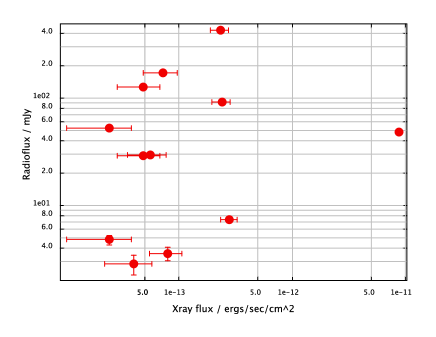
It is useful to look at the radio to X-ray flux ratios for these objects in order to be able to make a quick first cut on the classes of sources possible. Radio power is typically presented as a luminosity density (i.e. in ergs/sec/Hz), with most surveys for which standard relations are calibrated taking place at 5 GHz. Instead, we provide ratios between the X-ray luminosity and the luminosity density at 1.4 GHz, but note that the differences between the two are likely to be no more than half an order of magnitude over the range of spectral shapes typically observed in the radio – since many of the X-ray sources have fewer than 10 counts, the statistical errors on the observed ratio of X-ray flux to radio flux density will typically be larger than the uncertainties introduced due to the differences in flux density at 1.4 and 5 GHz. X-ray power is typically given as an actual flux within a broad bandpass rather than as a flux density. We plot the raw data, the X-ray fluxes versus radio flux densities, in Figure 1, rather than plotting the flux ratios. The values of are typically in the to Hz-1 range for these matches.
The data from which we find standard relations for different source classes between X-ray and radio luminosities come from a variety of sources using a variety of satellites. As a result, some measurements will be well matched to the 0.5-8.0 keV bandpass we use, while others, especially those data taken with ROSAT, will be in somewhat different bandpasses. Most of the classes of sources under consideration have spectral shapes not too different from the absorbed power law with that we use to estimate luminosities for our Chandra sources. With such a spectral shape, the corrections between e.g. the ROSAT bandpass of 0.1-2.4 keV and the Chandra bandpass of 0.5-8.0 keV are about 15%. The thermal spectra of coronally active stars also have bandpass corrections of less than about 10% for different satellites (Güdel & Benz 1993). As a result, we simply quote and use the X-ray luminosities in the bands for which the relations for the individual source classes were derived, but note that some caution should be used in excluding source classes simply because of a ratio of radio flux density to X-ray flux that is just outside the quoted boundaries for a source class.
3 Possible sources of radio and X-ray emission
A variety of classes of objects can be found to emit in both radio and X-rays, especially when the X-ray fluxes observed are rather faint. We will present a summary of the different classes of sources which are known to emit in both bands, and the typical flux ratios between radio and X-rays, as well as the typical characteristic luminosities. We also consider how data from other wavelengths (especially infrared and optical) can help characterize these sources. We present a discussion even of source classes which can be ruled out in this survey in part to create a useful resource for future studies which might have different relative depths among the X-ray, radio, and optical/infrared catalogs. Because we are focused on Galactic objects in general and the inner Galactic Bulge for the sources in this paper, we focus primarily on the infrared, rather than optical, fluxes, since the infrared measurements will suffer much less from extinction than the optical fluxes.
3.1 Non-compact stars
3.1.1 Coronally active stars
Relatively well established relations between X-ray and radio power exist for a few classes of sources. For coronally active stars, in which the X-ray and radio emission come from magnetically powered coronae on rapidly rotating late-type stars, a linear (or perhaps nearly linear) relation between X-ray and radio power has been well-established for quite some time (Güdel & Benz 1993). Typically, it is found that Hz-1, with the radio luminosity densities usually taken at 6 cm and the X-ray luminosities measured predominantly with ROSAT (0.1-2.4 keV) or Einstein (0.4-4 keV). The radio spectra are usually flat enough that the choice of frequency is not very important. The relation is the same for coronally active stars which are young single stars, and for older active stars in binaries. The W UMa stars, a class of mass-transferring binaries, are systematically underluminous in both radio and X-rays relative to coronally active binaries with similar orbital periods (Crudacce & Dupree 1984; Rucinski 1995). Algol systems are also thought to have their X-ray and radio emission dominated by coronal activity (e.g. Favata et al. 2000).
3.1.2 Coronally active ultracool dwarfs
Ultracool dwarfs (stars later than M6), appear to be overluminous in the radio relative to the X-rays by several orders of magnitude (e.g. Berger et al. 2010). It is thus possible for ultracool dwarfs to have X-ray/radio ratios in the range observed here. On the other hand, the X-ray luminosities of these objects are quite small – less than about ergs/sec, and more typically less than ergs/sec, meaning that the GBS will be sensitive to them only out to about 100 pc for the very brightest objects, and in general only within about 30 pc. These stars typically have -band absolute magnitudes of about 10, and colours of about 1.0-1.5, making them objects which should stand out well in the infrared surveys already existent in the GBS region (i.e. 2MASS for the relatively nearby objects – Cutri et al. 2003; and the Vista Variables in the Via Lactea – VVV – survey for more distant objects – Minniti et al. 2010). Many will additionally have large proper motions (of order 0.2”/year).
3.1.3 Massive stars
A variety of classes of massive stars can provide strong X-ray emission, generally with accompanying radio emission. Clark et al. (2008) provide a nice summary of the different classes of X-ray stars expected in a young massive star cluster, and much of our discussion is drawn from that work.
In massive stars, the X-rays come from shock-heated gas in the objects’ stellar winds. These shocks can be caused either by self-shocking of the wind of a single star, or by collisions of the winds of two massive stars in a binary. Single massive stars typically show ratios of to bolometric luminosity of (Long & White 1980), with the relation derived using Einstein data from 0.15-4.5 keV, so typically will be in the - ergs/sec range for OB stars. Colliding wind binaries are typically more luminous in the X-rays, due to the shocks from the wind-wind collisions (Pollock 1987), often reaching ergs/sec in an 0.8-4.0 keV band with Einstein.
Radio emission from massive stars has been reviewed by Seaquist (1993). The radio emission from single massive stars is thermal, from the photoionization of the stellar wind by the star, and typically has of ergs/sec/Hz at 6 cm, with the inverted spectrum (typically ) yielding slightly lower luminosities at 1.4 GHz. Colliding wind binaries are seen to have flatter, non-thermal spectra, with radio luminosities typically of ergs/sec/Hz (e.g. Bieging et al. 1989). Both single OB stars and colliding wind binaries are thus within the range of observed in our sample.
Massive stars will be very bright optical and infrared objects. One can take, e.g. the infrared fluxes from 2MASS (Cutri et al. 2003) for the X-ray detected Wolf-Rayet stars from Westerlund 1 (Clark et al. 2008), most of which are also radio emitters (Dougherty et al. 2010). The apparent magnitudes of these objects range from to . Given the typical extinction value in Westerlund 1 (Clark et al. 2008; Cardelli et al. 1989), which is a bit higher than the extinction to the GBS fields, and the distance of Westerlund 1 of about 5 kpc (Clark et al. 2008), a bit closer than the Galactic Centre distance, we expect that Wolf-Rayet stars in the GBS would be no fainter than about . OB stars with strong winds should be in a similar magnitude range.
3.1.4 Pre-main sequence stars and young stellar objects
Both Young Stellar Objects (YSOs) and Pre-Main Sequence (PMS) stars are known to produce radio emission. Classical (Class II) and Weak-line (Class III) T Tauri stars can also appear as relatively bright sources in the X-ray band and detectable sources in the radio. A small sample of young stellar objects and pre-main sequence stars has been observed simultaneously in the radio and X-rays by Forbrich et al. (2011). They find more than an order of magnitude of scatter in the ratio of X-ray to radio luminosity for these objects, and significant numbers of non-detections in both bands. The typical sources fall about one order of magnitude brighter in radio for a given X-ray luminosity than the standard Güdel-Benz relation for coronally active stars, so that the values range from about to . The observed sources are mostly in the - ergs/sec range in X-rays.
Additionally, the high ratio of infrared to radio/X-ray emission for pre-main sequence stars makes them unlikely to amongst the sources reported in this paper. Only the nearest PMS stars will have radio flux densities higher than the NVSS completeness limit; for example, T Tau itself has a radio flux density of only a few mJy (Scaife 2011a), and a magnitude of 5.3 (Cutri et al. 2003). This places it towards the lower end of the sources found in the NVSS, while its near infrared flux is about 6 magnitudes brighter than any of the sources we find with radio counterparts. A deeper radio survey could be expected to turn up a substantial fraction of the pre-main sequence stars in the GBS survey.
Earlier phases of protostellar evolution (Class 0/I) show strong X-ray emission more rarely (Feigelson & Montmerle 1999). Class 0 objects are deeply embedded in dense dust envelopes and have SEDs which peak in the sub-mm/FIR. Such objects have never been unambiguously detected in X-rays, although one strong candidate has been found in which the X-ray emission may result from shocking due to an abnormally fast jet being launched into the system (Hamaguchi et al. 2005). Class I objects, which have accreted more than half of their dust envelope onto the central source, are often seen to emit in X-rays ( erg s-1). Class I objects tend to have large ratios of near-infrared (and especially mid- and far-infrared) flux to X-ray flux, and generally have low radio luminosities, with ergs/sec/Hz at 15 GHz, and their radio spectra are generally rising, so that the luminosity densities will be even smaller in the 1.4 GHz NVSS band (Scaife et al. 2011b;c). The values of for the detected class I young stellar objects span the same range as for the T Tauri stars, but the class I objects are more likely to be non-detections in the Forbrich et al. (2011) sample than are the T Tauri stars.
3.2 Compact stars
3.2.1 X-ray binaries
Black hole X-ray binaries represent another possible source class of interest for our work. Gallo et al. (2003) find that , with the X-ray luminosities taken from 2-10 keV and the radio luminosity densities taken at 5 GHz. For a quiescent black hole X-ray binary at ergs/sec, the value of will then be about . Therefore, an X-ray binary would have to be overluminous in radio relative to the Gallo et al. (2003) relation by a substantial factor in order to be one of the GBS sources, since the GBS sources are all a factor of 100 higher in than the typical value.
A few binaries with neutron stars or black holes do show radio emission far in excess of the Gallo et al. (2003) relation – SS 433, Cygnus X-3, and the binaries which also emit high energy gamma-rays (see e.g. Fender 2006 for a review). As these systems are all high-mass X-ray binaries with strong stellar winds, it is likely that these sources have their jets interacting with stellar winds (or in the case of the gamma-ray sources, may be powered by the interaction of a pulsar wind with a stellar wind – Maraschi & Treves 1981). However, these sources are all still very luminous in both radio and X-rays ( ergs/sec), and hence are not likely to be relevant to the objects reported in this paper. The upcoming generation of radio telescopes will be needed to determine whether there exists a population of low luminosity X-ray binaries with radio fluxes well above the predictions of the Gallo et al. (2003) correlation.
It has, on the other hand, become clear that there exists a population of radio sub-luminous black hole X-ray binaries (e.g. Coriat et al. 2011), but these sub-luminous sources tend to exist only at relatively high fractions of the Eddington luminosity, where low mass X-ray binaries would be very bright X-ray sources in the GBS, even if they were located far past the distance to the Galactic Center, and hence would have already stood out in our survey which consists predominantly of much fainter sources. As these sources become fainter, they seem to return to the standard radio/X-ray correlation (Coriat et al. 2011; Maccarone 2011; Jonker et al 2012; Ratti et al 2012).
At the faint end of the flux distribution, where the X-ray luminosities alone would not distinguish black hole X-ray binaries from normal stellar objects, Gallo et al. (2006) found A0620-00 to be a factor of about 2 brighter in the radio than the extrapolation of the Gallo et al. (2003) relation, while Calvelo et al. (2010) found upper limits on two other quiescent black hole X-ray binaries, GRO J1655-40 and XTE J1550-564. These upper limits are marginally consistent with the Gallo et al. (2003) relation, and below the level one would expect if the radio emission were enhanced in quiescence as was suggested from the original observations of A0620-00. Miller-Jones et al. (2011) found similarly stringent upper limits on GRO J1655-40, GRO J0422+322 and XTE J1118+480 with the EVLA. Neutron star X-ray binaries at low X-ray flux levels generally lie far below the X-ray/radio relation for black holes (Migliari & Fender 2006), while cataclysmic variables lie further still below that relation (e.g. Körding et al. 2008).
3.2.2 Pulsars
Rotation-powered pulsars represent another class of objects which can display both radio and X-ray emission. The X-ray luminosities of pulsars are well correlated with their spin-down powers (Verbunt et al. 1996; Becker & Trümper 1997; Possenti et al. 2002), with the first two papers (which use ROSAT data from 0.1-2.4 keV) finding that the X-ray luminosity is typically about 0.1% of the spin-down luminosity and the latter (which uses a variety of observatories, and converts luminosities to a 2-10 keV band) finding a similar typical value, but with a steeper slope, such that the highest spin-down power pulsars are a bit brighter than 0.1% of spin-down and the lowest spin-down power are X-ray fainter than 0.1% of spin-down. The radio luminosities are not well correlated with the spin down powers, leading to substantial scatter in the ratio of X-ray to radio fluxes for pulsars. If, for example, one plots spin-down luminosity versus radio luminosity for a large sample of pulsars (e.g. Manchester et al. 2005), one sees approximately six orders of magnitude in scatter. The parameter space easily covers sources over the full range in flux densities from 1-100 mJy, and observed (or expected, based on taking 0.1% of the spin down luminosity) X-ray fluxes in the - ergs/sec/cm2 range for distances in the 1-10 kpc range – the X-ray and radio fluxes alone cannot typically rule out a pulsar nature for GBS sources. Pulsars only rarely have bright optical counterparts, even when they are in binaries, since most binary pulsars are millisecond pulsars whose companions are in the very late stages of stellar evolution after having already donated most of their masses to spin their companions up (van Kerkwijk et al. 2005). As a result a radio and X-ray source with no counterparts at other wavelengths can be a good candidate for being a pulsar, although the detection of a bright optical or infrared counterpart does not immediately rule out a pulsar nature for the X-ray and radio emission, since a small fraction of rotation powered pulsars do have high mass stars as counterparts.
3.2.3 Symbiotic stars
Symbiotic stars represent a final class of compact binary which can show strong emission at both radio and X-rays. These are typically binary systems containing a red giant or asymptotic giant branch star plus a white dwarf or a neutron star. Symbiotic stars show strong thermal radio emission with ergs/sec/Hz (Seaquist et al. 1993). X-ray emission from symbiotic stars spans a wide range in luminosities, from about ergs/sec to about ergs/sec for the white dwarf accretors which are not supersoft sources (Mürset et al. 1997). Much higher luminosities ( ergs/sec) are seen for the supersoft sources (i.e. the sources whose luminosities are expected to be dominated by steady nuclear burning on the surface of the white dwarf – Greiner 2000) and for the symbiotic X-ray binaries (i.e. those with neutron star accretors), which typically have ergs/sec (Corbet et al. 2008). Symbiotic stars can thus often come within the range of observed for our matches. Bright infrared counterparts could be taken as additional suggestive evidence for symbiotic stars – the absolute -band magnitudes of the symbiotic stars with Hipparcos parallaxes range from -0.2 to -8.1, with most of the objects at the bright end of the range (Munari et al. 1997). These absolute magnitudes correspond to apparent magnitudes in the range from about 6 to 14 at the distance of the Galactic Centre, with most symbiotic stars expected to have . We note that the faintest object in the sample, AR Pav, also has a very poorly measured parallax from Hipparcos, and that excluding it leaves the faintest object at , which corresponds to at the Galactic Center distance.
3.3 Extended Galactic objects
3.3.1 Supernova remnants and pulsar wind nebulae
Two cases for diffuse Galactic emission sources associated with compact objects may also produce strong radio and X-ray emission: supernova remnants and pulsar wind nebulae. Supernova remnants can be ruled out as candidates for being the GBS sources on the basis of their large angular sizes (and younger, more compact supernova remnants, which have smaller sizes, can be ruled out on the basis of the relative faintness of these sources – see e.g. Williams et al. 1999; Park et al. 2002). Also, nearly all known Galactic supernova remnants have radio flux densities of at least 1 Jy around 1 GHz (e.g. Green 2009). Pulsar wind nebulae can often be found to have roughly the right ratio of radio to X-ray luminosities, but pulsar wind nebulae are generally only found around the youngest pulsars, which are more X-ray luminous than all the sources with radio matches except CX 2 (e.g. Gaensler & Slane 2006), and CX 2 is a known active galactic nucleus (Marti et al. 1998 – see further discussion in section 4.1).
3.3.2 Planetary nebulae
Planetary nebulae are well known emitters of free-free radio emission (Condon & Kaplan 1998), with most of the planetary nebulae from the Strasbourg catalog (Acker et al. 1992) north of degrees being detected in the NVSS. A fraction of planetary nebulae are also seen as X-ray sources (Guerrrero et al. 2006), but typically these are found only with dedicated pointings, rather than all-sky X-ray surveys. As a result, some rather severe selection effects exist, and while one can probably make a reasonably fair estimate of the minimum , it is difficult to estimate the maximum value of . The most likely origin of the X-ray emission from planetary nebulae seems to be coronal activity of the binary companions to the white dwarfs, yielding typical X-ray luminosities of ergs/sec (Montez et al. 2010). The X-ray luminosities are typically much less than the ultraviolet luminosities, and are therefore are energetically unimportant for powering the free-free thermal emission from the nebulae, and hence should be largely uncorrelated with the radio emission. From the sample of 6 objects located north of which have been observed by Chandra or XMM, we find that the range of goes from to , but we note again that the upper end to the range is limited severely by the X-ray sensitivity. The optical and infrared magnitudes of planetary nebulae will typically be dominated by their line emission, and the magnitudes from 2MASS for Galactic planetary nebulae range from -5 to +5, with the vast majority of objects from -3 to 0 (we derive these by matching the 2MASS planetary nebula catalog of Ramos Larios & Phillips 2005 with a compilation of distances for these objects from Cahn et al. 1992).
3.4 Extragalactic sources
3.4.1 Active galactic nuclei
The primary extragalactic source for both radio and X-ray emission is active galactic nuclei, although both clusters of galaxies and starburst galaxies can be strong emitters at both radio and high energies as well. Active galactic nuclei span a large range in the ratio of X-ray to radio fluxes, whether one focuses on core luminosity, extended luminosity, or, as is the case with low angular resolution data at 1.4 GHz, like the NVSS data, mixes the two.
One can take the results of the REX survey (Caccianiga et al. 1999), to investigate the range of parameter space spanned by active galactic nuclei in X-ray to radio flux ratios. The REX project combined the NVSS sample with that of the ROSAT all-sky survey sample. The survey is over a wide field of view, and reaches a flux limit only a factor of about 10 less sensitive than that of the GBS (albeit with much worse angular resolution), and so represents a good comparison to the range we should expect for GBS-NVSS correlations. Converting the values of the spectral slopes from radio to optical and from optical to X-ray from Cacciniga et al. (1999) to the units we use here, we find that active galactic nuclei should span a range from to Hz-1 in – although the real possible range is probably slightly wider because there will be some AGN detected only as radio sources or only as X-ray sources. We note also that in some cases, the extended structure for AGN may be partially resolved out by interferometers. This is not a serious problem for our purposes in this paper, since we have found the possible range of using NVSS data, just as we use NVSS data for the work in this paper, so the effects of over-resolution should be similar for our work as for the work of Caccianiga et al. (1999).
Watanabe et al. (2003) have investigated the range of X-ray to near infrared flux for a large sample of active galactic nuclei with X-ray fluxes from 2-10 keV above about ergs/sec. They find a flux ratio of about 3 for most of the AGN, but also find values as low as 0.01 and as high as 30. Therefore, the infrared magnitude is not, in and of itself, a good indicator of whether a source is likely to be an active galactic nucleus.
3.4.2 Starburst galaxies
Starburst galaxies follow relatively clear relationships between radio and X-ray fluxes. In the radio, it has been shown that the star formation rate is yr-1, where is the 1.4 GHz luminosity density of the galaxy in ergs/sec/Hz (Yun, Reddy & Condon 2001). In the X-rays, it has been shown that the star formation rate of a galaxy in solar masses per year is well correlated with its X-ray luminosity, with (Grimm et al. 2003) fitting the relation, albeit with large scatter and a non-linear best-fit relation at low luminosities due to the stochastic effects of small numbers of bright X-ray sources. The typical for a starburst galaxy will thus be about . The starbursts would have to be relatively compact or at relatively large distances in order not to cause the X-ray emission either to be resolved, or to be so extended that the X-ray sources become undetected (as might happen at the faint end of the X-ray flux distribution). Additionally, the starbursts are a bit too X-ray bright to match well with the objects in our sample, although an outlier at low could fit with the more radio quiet matches in the sample.
Starburst galaxies can be expected to have relatively bright band emission, albeit with much scatter. We can take M 82 as a local example of a galaxy with a high specific star formation rate, and which, as an edge-on galaxy, is likely to have a rather large fraction of its band flux extincted relative to more face-on galaxies. The integrated 1.4 GHz flux from M 82 is about 8.4 Jy (White & Becker 1992), while its -band magnitude from 2MASS (Skrutskie et al. 2006) is 4.7. Scaling from these numbers, we can expect for nearly any starburst galaxy we detect with NVSS.
3.4.3 Clusters of galaxies
Clusters of galaxies can also show strong emission at both X-rays and radio. A fraction of clusters of galaxies with strong radio haloes shows of about ergs/sec/Hz, with a strong relation between cluster radio and X-ray luminosity over the range from ergs/sec, albeit with a rather small sample (Cassano 2009). The ratios of radio luminosity densities to X-ray luminosities are thus about Hz-1, meaning that all the sources we have detected are too radio loud to be clusters of galaxies. The characteristic signature would be the optical or infrared detection of a few of the galaxies in the cluster. Additionally, one would expect that either the clusters are at , or that the radio emission would be resolved in NVSS, since the clusters’ radio haloes are typically Mpc in size (Cassano 2009) – and furthermore, the clusters would be expected always to be resolved in the Chandra data. One might also expect to detect the brighter galaxies in a cluster in the infrared data if a cluster of galaxies were the emitter. E.g. M 87, the central galaxy of the Virgo Cluster, has an absolute -band magnitude of -25.3 (Skrutsie et al. 2006), so even at redshift 0.5, it would be at a magnitude of about , with K-corrections applied from Poggianti (1997). The brightest few galaxies in a rich cluster should thus be detectable in the VVV data.
3.5 Unknown source classes and transients
Some fraction of the sources in the GBS region may belong to unidentified source classes. For example, a few engimatic radio transients have been seen from surveys taken near the Galactic Center (e.g. Hyman et al. 2005; Hyman et al. 2009). These transients have been detected only at relatively low radio frequencies (235 MHz at the Giant Metre-Wave Radio Telescope and 330 MHz at the VLA), but upper limits at 610 MHz for the more recently detected of these transients indicate that it has a spectrum steeper than (Hyman et al. 2009). Since this object peaked at about 60 mJy at 235 MHz, it would have been at no more than about 2 mJy at 1.4 GHz, meaning that it would have been, at best, marginally detected in the NVSS data. Such transients should thus be rather uncommon in the NVSS data set – and a search for sources in only one of NVSS and FIRST (White et al. 1997) showed that radio transients are likely to be quite rare at 1.4 GHz in single epoch searches (Levinson et al. 2002).
At the same time, the radio and X-ray data are taken far apart in time (with the NVSS data taken mostly in 1993-6, and the GBS data taken in 2008 and 2009). Therefore, variability can add some scatter to the ratios of radio to X-ray luminosities. In principle, such variability could lead to misidentifications for a small fraction of the sources if they are highly variable, but the source classes discussed here are either low duty cycle in variability, or have small amplitudes of variability, so this is a rather unlikely possibility.
4 The matching sources and their identifications
For the 12 sources which are good candidates for having radio counterparts from NVSS, we present a case-by-case discussion of the facts at hand revelant to the source’s classification. In particular, we discuss other radio surveys, and we also discuss correlations with public infrared surveys and with our own optical variability studies and spectroscopic measurements as described above. We draw attention to the positional offsets of radio sources only for the cases where the offsets are large enough that the matches may be spurious.
4.1 CX 2 = CXO J173728.3-290802, a known Seyfert 1 galaxy
CX 2 is a known Seyfert 1 galaxy at a redshift of 0.0214 (Marti et al. 1998). Its radio flux density is mJy and its X-ray measurements are affected by pile-up. Its VVV infrared detections are and . The 2MASS magnitudes for this source are , and , and are likely to be more reliable than the pipeline VVV magnitudes for sources this bright. This object also shows optical variability of about 0.2 magnitudes in in an 7 night long campaign (see figure 2). The absolute flux-scale calibration for the r’ variability survey has not yet been completed, so the actual magnitude of the source in remains uncertain by the magnitudes uncertainty that can be obtained by calibrating against the USNO catalog; the best estimate for the mean value is 18.4.

4.2 CX 40=CXO J174404.3-260925, a new spectroscopically verified AGN
This source is detected with 35 X-ray counts and a radio flux density of 0.5 mJy in NVSS. The ratio of radio flux density to X-ray flux is thus about Hz-1. The source is also detected in the Parkes-MIT-NRAO (PMN) 4.85 GHz radio survey’s tropical region (Griffith et al. 1994) with a flux density of mJy, and a positional offset of about 62”, within the positional uncertainties at this signal-to-noise and at this frequency from Parkes. Nonetheless, both the detection from the PMN survey and its match to the GBS/NVSS source are marginal, so the 4.85 GHz radio source may be spurious or unrelated. If the match is taken to be real then the radio source must be strongly variable, or strongly self-absorbed, or a substantial fraction of the 1.4 GHz flux must have been resolved out by the NVSS, as the spectral index implied by the ratio of flux densities at the two frequencies is about +2. The source is detected in the VVV data with a positional offset less than 0.1”, at , and . Our optical variability survey shows no evidence for variability from this position, with the source at an magnitude of .
We have obtained an optical spectrum of this object (see figure 5). Since this object is located very close, on the sky, to a field star, a careful extraction was done in IRAF to maximize the contribution from the AGN relative to that of the star. The optical spectrum for this source shows a series of strong lines and blends of strong lines. The redshift for this object is determined primarily from the [O I] line at 6300 Å(rest frame), the only unblended line in the spectrum. The uncertainty of this redshift is difficult to estimate, since the only unblended line we detect at high signal to noise is the [O I] line which peaks at 6577 Åin the observed frame – rather close to the wavelength of in the rest frame, which is potential problematic given the nearby foreground star. Regardless, the uncertainty in the redshift should not affect the conclusion that the source is an active galactic nucleus.
The full width at zero intensity (FWZI) of the H+[N II] blend is 4400 km/sec, while the full width half-maximum (FWHM) for the same blend is about 1470 km/sec. The presence of telluric lines from the telluric “B” band in the same range of wavelengths as the H+[N II] blend is a cause for caution in taking too seriously any conclusions which depend strongly on the profile of this line, and especially its FWZI. The isolated [O I] line has a FWHM of 910 km/sec. It is likely that the FWHM of H itself is signficantly less than the FWHM of the blend, but the extent to which this is true cannot be quantified with these spectra. Regardless, the data suggest a Seyfert 2 interpretation of the source, but because of the foreground reddening to the source, the ratio of line strengths of [O III] to H cannot be used as an additional discriminator of source type.
The X-ray luminosity of the source, without accounting for foreground absorption, would then be ergs/sec in the 0.3-8 keV band for km/sec/Mpc, and (Spergel et al. 2003). This luminosity is at the lower end of the range typical of Seyfert galaxies (e.g. Kraemer et al. 2004), but we note that the absorption is likely to be quite strong, and has not yet been taken into account; with only 35 X-ray counts it is difficult to estimate the appropriate correction from the data.

4.3 CX 49 = CXO J173146.8-300309, a candidate AGN
This source is detected at a flux density of 902.8 mJy in the NVSS data and with 30 counts by Chandra. Its ratio of radio flux density to X-ray flux is thus about Hz-1. The source is detected in the VVV data with an offset of 0.21”, at and . -band data are missing in the region around this source position. This object also shows about 0.5 magnitudes of variability in the r’ variability survey (see figure 4), with a typical value of .

A source near this position is also detected in the zenith region of the PMN survey (Wright et al. 1996), with a 4.85 GHz flux density of 12314 mJy, and a positional offset of 98”, and is flagged as a likely extended source (although there is no evidence for extension from the NVSS catalog). Given that there is no NVSS source nearer to the PMN source than the one we have associated with CX 49, we regard the match as likely reliable. If the source is extended on the spatial scales of the 4.2’ beam size of the Parkes data, then likely the VLA resolved out some of the flux from the source in the NVSS data set, and a spectral index cannot be estimated from these data, but otherwise, the source has a flat to slightly inverted spectrum. The possible extended radio emission and bright infrared counterpart both suggest that the source is an active galactic nucleus, but the identification is insecure at this point.
4.4 CX 52 = CXO J174423.5-311636, a likely AGN
This source is detected at a flux density of mJy in NVSS, and with 29 counts by Chandra, giving a ratio of radio flux density to X-ray flux of about Hz-1. There are no optical or infrared stars near this source, indicating that it is likely in a region of high extinction – the nearest sources in the VVV catalog are more than 3” away, and all have very red colors; not surprisingly, the source is not detected in our optical variability survey. The source’s X-ray hardness ratio is 0.83, making it likely one of the hardest sources in the GBS, and while, with the relatively small number of counts, this designation cannot be secure, this finding supports the idea that the source is in a region of large foreground extinction. It is also detected at a flux density of 882 MHz in the Galactic Center 330 MHz survey of Nord et al. (2004), but with the VLA in A&B configuration, so that the beam size of those data is considerably smaller than for the NVSS data. Roy et al. (2005), using imaging data from the VLA and the Australia Telescope Compact Array with higher angular resolution than the NVSS data identify this source as a compact core plus extended emission, and hence an extragalactic object. A likely match is also found in the Nobeyama 10 GHz survey (Handa et al. 1987) – source number 4 in that catalog is about 2’ from CX 52, and appears pointlike in that survey with a flux density of 0.46 Jy. The stated positional accuracy of the Nobeyama data is about 5”, but the beam size for that survey was about 3’, and the offset may be the result of systematic errors in the source centroiding, especially given that the source appears to be extended in lower frequency data, and could perhaps be mildly extended and asymmetric in the 10 GHz data, perhaps leading to an offset against the X-ray position. The lack of any other sources in the first catalog within 3’ of the Nobeyama position strongly supports this possibility.
4.5 CX 233 = CXO J174206.1-264117
This source is detected at a flux density of 3.5 mJy in NVSS, and with 10 X-ray counts, yielding of Hz-1. The match is that with the largest separation of any match presented here, 5.0”, but given the faintness of the NVSS source and its suggestive evidence for being extended (the major axis in the NVSS catalog is inferred to be about 78”), the NVSS positional uncertainty is about 10”, so the positions are certainly consistent with one another. The nearest infrared source in VVV is 1.6” away, and has , and . Given that the source is far off-axis, the 95% positional uncertainty estimate based on the formula of Hong et al. (2005), developed to deal with the point-spread function of Chandra, is 6.1” The position of the potential infrared match is thus consistent with the X-ray source position. The spatial extent of the radio counterpart is suggestive evidence that the source is an active galactic nucleus. The optical variability survey shows a source wirh , but no evidence for variability.
4.6 CX 293 = CXO J174000.6-274816, a likely AGN
This source is detected at a flux density of 170 mJy in NVSS, and with 9 X-ray counts, yielding of Hz-1. It is also detected in the 330 MHz survey of Nord et al. (2004), with a flux density of 404 mJy. The source is identified in the radio imaging of Roy et al (2004) as a triple source, and hence is likely to be an active galactic nucleus. It has a VVV infrared counterpart 1.0” away, with , and . An optical spectrum was taken of this VVV source and showed a purely stellar spectrum with no emission lines, indicating that it is likely a chance superposition (see figure LABEL:cx293). A 10% flux drop is seen around 6564 Å, so it is clear that the source is a Galactic foreground object rather than, e.g. a background blazar, but most of the strong features in the spectrum correspond to atmospheric features that have not been removed fully. Additionally, the astrometry from our optical variability survey indicates that the source of which the spectrum was taken was probably not the real match.

4.7 CX 390 = CXO J173607.5-294858
The source is detected at a flux density of 29 mJy in NVSS and with 7 X-ray counts giving of Hz-1. The source could be a spurious match, as the offset between the X-ray and radio positions is 3.1”, despite the radio position being accurate to about 1.4”, although the 95% error circle on the X-ray position extends out to about 3.2”, using the formula of Hong et al. (2005). The X-ray source has a match in the VVV data 0.71” away, with , and . The optical counterpart of this object has and shows no evidence for variability.
4.8 CX 488 = CXO J173605.3-283232
The source is detected at a flux density of 126 mJy in the NVSS data and with 6 X-ray counts, giving of Hz-1. The source is found at a flux density of 707 mJy in the 330 MHz survey of Nord et al. (2004). The spectrum of this source is steeper than , which is the spectral criterion Nord et al. (2004) used for identifying new pulsar candidates. This source was excluded as a pulsar candidate on the basis of its having a major axis of 15.9”, just larger than the threshold of 15” used by Nord et al. (2004) to identify extended sources. The X-ray source position has a match in VVV at and , with magnitudes 15.44 and , respectively, with a positional offset of 1.2”, which casts some doubt on the possibility that the source is a pulsar, but if the infrared counterpart is a chance superposition, the source is a good pulsar candidate. The optical counterpart in our variability survey has , and shows no evidence for variability.
4.9 CX 494 = CXO J173458.8-301328
The source is detected at a flux density of 29 mJy in the NVSS data and with 6 X-ray counts, giving of Hz-1. A near infrared counterpart is found 1.8” away (but given the 0.8” statistical uncertainty on the GBS position, this is reasonably likely to be a real match), and has , and . Its 2MASS magnitudes are , and , and may be more reliable than those from VVV because of the brightness of the object – although we note that the differences are small. There is no variability detected in the optical variability survey, but a source is seen at the position. There are two possible optical counterparts in our variability survey, neither of which varies. They have magnitudes of 17.3 and 18.3.
4.10 CX 578 = CXO J174442.3-311633
The source is detected at a flux density of 2.8 mJy in the NVSS data and with 5 X-ray counts, giving of Hz-1. The offset between the X-ray and radio positions is about 3.1”, but with the nearly 20” positional uncertainty on the radio source (due both to its faintness, and its large major axis of 122” according to the NVSS catalog), the positions are quite consistent with one another, despite the relatively large offset. The nearest infrared counterpart is 1.7” away, which makes it a marginal match, given the good (0.3” statistical uncertainty, 0.6” boresight uncertainty) X-ray position; the 95% uncertainty on the X-ray source position from Hong et al. (2005) is 1.2”. It has , and . In our optical survey, the source is detected as a star, with no evidence for variability.
4.11 CX 937 = CXO J175359.2-281720, a likely AGN
This source is detected with a flux density of mJy and with 3 X-ray counts, yielding a of Hz-1. Roy et al. (2005) identify this source as a background active galactic nucleus because it is resolved into a double source with the high resolution radio imaging data. The source is identified in the PMN survey (Wright et al. 1996) as a 10412 mJy source at 4.85 GHz. Given that Roy et al. (2005) identify the source as extended, it is most likely that some radio flux is resolved out in the NVSS data, and that the spectrum is not really inverted. It is also identified at 186 mJy in the 330 MHz data set of Nord et al. (2004), with the spectral index implied from comparing the 330 MHz data with the NVSS data consistent with the expectations for a typical background active galactic nucleus. A bright infrared counterpart is seen 1.1” away, with , and from VVV, and with from 2MASS, with the 2MASS photometry at and flagged as unreliable. The source is saturated in our optical variability survey, making searches for variability from it problematic.
4.12 CX 1234 = CXO J173531.4-295145
This source is detected with a flux density of mJy and with 3 X-ray counts, yielding a of Hz-1. The match offset is about 3.3”, well within the positional accuracy of the NVSS source, but at a larger separation than most of the matches in this paper. The nearest infrared counterpart is located 1.4” from the X-ray position, and is undetected in , but found at and . In our optical variability survey, the source is swamped out by a bright, saturated star 5” away.
| GBS cat. no | log() | Comments/classification | |||
|---|---|---|---|---|---|
| 2 | ** | 47 | 10.94 | ** | known AGN, X-rays affected by pileup |
| 40 | 7.3 | 13.56 | -12.5 | spec. ver. AGN | |
| 49 | 90 | 13.45 | -11.4 | opt. var. | |
| 52 | 425 | non-det | -10.7 | AGN from ext. emission | |
| 233 | 3.5 | 15.68 | -12.3 | large offset, but large pos. uncer. | |
| 293 | 170 | 13.33 | -10.7 | triple source, likely AGN | |
| 390 | 29 | 15.92 | -11.3 | least likely match | |
| 488 | 126 | 14.94 | -10.6 | marginal extension at 330 MHz may rule out pulsar | |
| 494 | 29 | 12.51? | -11 | ||
| 578 | 2.8 | 14.19? | -12.2 | poss. ext. in NVSS | |
| 937 | 52 | 13.32 | -10.1 | double radio source, prob. AGN | |
| 1234 | 4.7 | 15.84 | -11.3 |
5 Discussion
We have considered the multi-wavelength properties of 12 X-ray sources in the Chandra Galactic Bulge survey with radio counterparts in NVSS. The lack of any very bright infrared counterparts to the X-ray/radio matches argues against any of these objects’ being pre-main sequence stars, massive stars (either single or in binaries) or symbiotic stars. Additionally, massive stars would likely be Tycho sources unless they were highly absorbed, and none of these objects matches with the Tycho catalog (R.I. Hynes et al. in prep.). The sources are all overluminous in the radio for being coronally active stars, unless they are ultracool dwarfs, or for being X-ray binaries or cataclysmic variables or background clusters of galaxies. Coronally active ultracool dwarfs can be ruled out on the basis of the lack of bright infrared counterparts, unless their proper motions are so large that the stars have left the matching regions we have used with respect to 2MASS. Starburst galaxies are also unlikely, unless the galaxies have even larger ratios of radio flux to infrared flux than that of M 82.
The lack of sources in the aforementioned classes in the current list of radio/X-ray matches does not preclude their existence among the GBS sources – some of the sources not presently detected in the radio are likely to be coronally active binaries, for example. Some clear examples of X-ray binaries are already known in the survey (J11). On the other hand, pulsar wind nebulae and supernova remnants can likely be ruled out throughout the survey region as they would be bright X-ray sources which would have been detected in the NVSS data as well, and this is relatively unsurprising given that the field is outside the Plane of the galaxy, so any such objects would have to be either very nearby or among the rare young objects at large scale-height.
The only viable classifications for the sources detected, then, are active galactic nuclei and pulsars, plus planetary nebulae – the two classes which span very large ranges in all flux ratios, and the planetary nebulae which have systematically higher ratios of radio to X-ray fluxes than the other source classes. Planetary nebula origins are disfavoured as well. Nearly all the sources have either too low a ratio of , or have radio morphology or optical variability that argue against PN origins. CX 488 has an especially steep radio spectrum not consistent with the free-free emission process that dominates the radio emission from PNe. CX 494 is a viable candidate, which could be similar to the X-ray brightest PN, BD+30∘3639. If this can be verified, then the source should be strongly emission-line dominated in optical and infrared spectra. At the present time, we do not have an optical nor infrared spectrum of this object. CX 1234 has a ratio of X-ray to radio flux which is reasonable, but its infrared flux is too faint compared to the X-ray flux to be a PNe unless it is an extreme outlier.
Two of the objects have been definitely classified as active galactic nuclei by spectroscopic follow-up (CX 2 – Marti et al. 1998 and CX 40 – this paper). Several others (CX 52, CX 293, and CX 937) show morphology in high angular resolution radio data that indicates that they are likely background active galactic nuclei (Roy et al. 2005), and the optical variability of CX 49 argues for an AGN nature for the source, given that all the classes of stellar objects which would show optical variability are ruled out by the large ratio of radio to X-ray fluxes. CX 488 represents a viable candidate for being a pulsar, although the marginal extension reported in Nord et al. (2005) does cast doubt on this interpretation.
Some of these background AGN can serve as important probes of the interstellar medium of our Galaxy. Many of them are bright enough for high resolution spectroscopy in the near infrared and/or optical, meaning that searches for absorption lines in their spectra can be used to estimate the metal abundance of the interstellar medium of the Galaxy in the inner part of the Bulge. Additionally, it has already been noted (Roy et al. 2005) that AGN behind the inner Galaxy can be used to investigate the strength and structure of the inner Galaxy’s magnetic field through radio Faraday rotation measurements.
Additionally, this method has proved to be extremely effective in identifying the background AGN in the GBS survey. The estimated number of AGN expected in the full survey was about 25 (J11), so with 3/4 of the survey taken, about 18 AGN would be expected. In principle, if the number of AGN is below the expected number of AGN (e.g. due to Poisson variations) and our still unclassified radio sources do turn out to be active galactic nuclei, we could have detected all the AGN in the survey already, but this is unlikely given that AGN can be times too faint in the radio to have been detected in these data if they are at the faint end of the X-ray flux distribution and at the radio faint end of the radio to X-ray flux ratio distribution, but it is likely that from the radio correlations we have already identified more than half of the AGN in the survey.
The addition of the NVSS data to the GBS project has thus been of significant value, even if it has not resulted in the identification of the stellar objects that are the primary motivation for the survey. It is also clear from the work here that in order to find substantial numbers of stellar objects, a deeper radio survey of this region would be needed. Such a survey could be done easily now with the improved sensitivity of the EVLA.
6 Acknowledgments
TJM thanks Anna Scaife for pointing out the existence of the high frequency published radio surveys which overlap with the GBS field, for making a visual inspection of the Nobeyama data for CX 52 and for discussion of the radio properties of protostars. This publication makes use of data products from the Two Micron All Sky Survey, which is a joint project of the University of Massachusetts and the Infrared Processing and Analysis Center/California Insitute of Technology, funded by the National Aeronautics and Space Administration and the National Science Foundation. TJM and AD thank the Science and Technology Facilities Council for support under a rolling grant to the University of Southampton. PGJ and GN acknowledge support from the Netherlands Organization for Scientific Research. RIH and CB acknowledge supprt from National Science Foundation Grant AST-0908789. DS acknowledges support from STFC through an Advanced Fellowship. SG acknowledges support through a Warwick Postgraduate Research Scholarship. RW is partially supported by a European Research Council Starting Grant.
References
- [1] Acker A. Marcout J., Ochsenbein H., Stenholm B., Tylenda R., Schohn C., 1992, The Strasbourg-ESO Catalogue of Galactic Planetary Nebulae, ESO: Garching
- [2] Alard C., Lupton R.H., 1998, ApJ, 503, 325
- [3] Alard C., 2000, A&AS, 144, 363
- [4] Becker W., Trümper J., 1997, A&A, 326, 682
- [5] Beckerman E., Biller B., Jerius D., 2003, http://cxc.harvard.edu/ccw/proceedings/03_proc/presentations/beckerman/
- [6] Berger E., et al., 2010, ApJ, 709, 332
- [7] Bieging J.H., Abbott D.C., Churchwell E.B., 1989, ApJ, 340, 518
- [8] Caccianiga A., Maccacaro T., Wolter A., Della Ceca R., Gioia I., 1999, ApJ, 513, 51
- [9] Cahn J.H., Kaler J.B., Stanghellini L., 1992, A&AS, 94, 339
- [10] Calvelo D., et al., 2010, MNRAS, 409, 839
- [11] Cardelli J.A, Clayton G.C., Mathis J.S., 1989, 345, 245
- [12] Cassano R., 2009, ASPC, in “The Low Frequency Radio Universe”, eds. D.J. Saikia, D. Green, Y. Gupta, T. Venturi, ASP: San Francisco
- [13] Clark J.S., Muno M.P., Neguerela I., Dougherty S.M., Crowther P.A., Goodwin S.P., de Grijs R., 2008, A&A, 477, 147
- [14] Condon J.J., Cotton W.D., Greisen E. W., Yin Q.F., Perley R.A., Taylor G.B., Broderick J.J., 1998, AJ, 115, 1693
- [15] Corbet R.H.D., Sokoloski J.L., Mukai K., Markwardt C.B., Tueller J., 2008, ApJ, 675, 1424
- [16] Coriat M., et al., 2011, MNRAS, 414, 677
- [17] Crudacce R.G., Dupree A.K., 1984, ApJ, 277, 263
- [18] Cutri R.M., et al., “The IRSA 2MASS All-Sky Point Source Catalog”, NASA/IPAC Science Archive
- [19] Dougherty S.M., Clark J.S., Neguerela I., Johnson T., Chapman J.M., 2010, A&A, 511, 58
- [20] Favata F., Micela G., Reale F., Sciortino S., Schmitt J.H.M.M., 2000, a&A, 362, 268
- [21] Feigelson E., Montmerle T., 1999, A&A, 37, 363
- [22] Fender R.P., 2006, in “Compact Stellar X-ray Sources”, eds W.H.G. Lewin and M. van der Klis, Cambridge University Press: Cambridge
- [23] Forbrich J., Osten R.A., Wolk S.J., 2011, ApJ, 736, 25
- [24] Gaensler B.M., Slane P.O., 2006, ARA&A 44, 17
- [25] Gallo E., Fender R.P., Pooley G.G., 2003, MNRAS, 344, 60
- [26] Gallo E., Fender R.P., Miller-Jones J.C.A., Merloni A., Jonker P.G., Heinz S., Maccarone T.J., van der Klis M., 2006, MNRAS, 370, 1351
- [27] Griffith M.R., Wright A.E., Burke B.F., Ekers R.D., 1994, ApJS, 90, 179
- [28] Green D., 2009, BASI, 37, 45
- [29] Greiner J., 2000, New Astr., 5, 137
- [30] Grimm H.-J., Gilfanov M., Sunyaev R., 2003, MNRAS, 339, 793
- [31] Güdel M., Benz A.O., 1993, ApJL, 405, 63
- [32] Guerrero M.A., Chu Y.-H., Gruendl R.A., 2006, ESASP, 604, 85
- [33] Hamaguchi K., Corcoran M.F., Petre R., White N.E., Stelzer B., Nedachi K., Kobayashi N., Tokunaga A.T., 2005, ApJ, 623, 291
- [34] Handa T., Sofue Y., Nakai N., Hirabayashi H., Inoue M., 1987, PASJ, 39, 709
- [35] Hong J., van den Berg M., Schlegel E.M., Grindlay J.E., Koenig X., Laycock S., Zhao P., 2005, ApJ, 635, 907
- [36] Hyman S., D., Lazio T.J.W., Kassim N.E., Ray P.S., 2005, Nature, 434, 50
- [37] Hyman S.D., Wijnands R., Lazio T.J.W., Pal S., Starling R., Kassim N.E., Ray P.S., 2009, ApJ, 696, 280
- [38] Jonker P.G., et al., 2011, ApJS, 194, 18
- [39] Jonker P. G., Miller-Jones J. C. A., Homan J., Tomsick J., Fender R. P., Kaaret P., Markoff S., Gallo E., 2012, MNRAS, 423, 3308
- [40] Körding E., Rupen M., Knigge C., Fender R., Dhawan V., Templeton M., Muxlow T., 2008, Science, 320, 1318
- [41] Kraemer S.B., George I.M., Crenshaw D.M., Gabel J.R., 2004, ApJ, 607, 794
- [42] Langston G., Minter A., D’Addario L., Eberhardt K., Koski K., Zuber J., 2000, AJ, 119, 2801
- [43] Levinson A., Ofek E.O., Waxman E., Gal-Yam A., 2002, ApJ, 576, 923
- [44] Long K.S., White R.L., 1980, ApJ, 239L, 65
- [45] Maccarone T.J., 2011, in The Extreme and Variable High Energy Sky, published as “Proceedings of Science” volume Extremesky2011, 14
- [46] Manchester R.N., Hobbs G.B., Teoh A., Hobbs M., 2005, AJ, 129, 1993
- [47] Maraschi L., Treves A., 1981, MNRAS, 194P, 1
- [48] Marti J. Mirabel I.F., Chaty S., Rodriguez L.F., 1998, A&A, 330, 72
- [49] Migliari S., Fender R.P., 2006, MNRAS, 266, 79
- [50] Miller-Jones J.C.A., Jonker P.G., Maccarone T.J., Nelemans G., Calvelo D.E., 2011, ApJ, 739L, 18
- [51] Minniti D., et al., 2010, New Astronomy, 15, 433
- [52] Montez R., De Marco O., Kastner J.H., Chu Y.-H., 2010, ApJ, 721, 1820
- [53] Montmerle T., Grosso N., Tsuboi Y., Koyama K., 2000, ApJ, 532, 1097
- [54] Munari U., Renzini A., Bernacca P.L., 1997, Proceedings of the ESA Symposium “Hiapparcos – Venice ’97”, ESA-Special Publication 402, eds. R.M. Bonnet et al., 413
- [55] Mürset U., Wolff B., Jordan S., 1997, A&A, 201, 210
- [56] Nord M.E., Lazio T.J.W., Kassim N.E., Hyman S.D., LaRosa T.N., Brogan X.L., Duric N., 2004, AJ, 128, 1646
- [57] Park S., Burrows D.N., Garmire G.P., Nousek J.A., McCray R., Michael E., Zhekov S., 2002, ApJ, 567, 314
- [58] Poggianti B.M., 1997, A&AS, 122, 399
- [59] Pollock A.M.T.., 1987, ApJ, 320, 283
- [60] Possenti A., Cerutti R., Colpi M., Mereghetti S., 2002, A&A, 387, 993
- [61] Ramos Larios G., Phillips J., 2005, MNRAS, 357, 732
- [62] Ratti E., et al., 2012, MNRAS, 423, 2656
- [63] Roy S., Rao A.P., Subrahmanyan S., 2005, MNRAS, 360, 1305
- [64] Rucinski S., 1995, AJ, 109, 2690
- [65] Saito R., et al., 2010, Msngr, 141, 24
- [66] Saito R., et al., 2012, A&A, 537, 107
- [67] Scaife A.M.M., 2011a, Astronomer’s Telegram 3786
- [68] Scaife A.M.M., et al., 2011b, MNRAS, 415, 893
- [69] Scaife A.M.M., et al., 2011c, MNRAS, 410, 2662
- [70] Seaquist E.R., 1993, Rep Prog Phys, 56, 1145
- [71] Skrutskie M.F., et al., 2006, AJ, 131, 1163
- [72] Smith K., Güdel M., Benz A.O, 1999, A&A, 349, 475
- [73] Spencer J.H., Schwartz P.R., 1974, ApJ, 188L, 105
- [74] van Kerkwijk M.H., Bassa C.G., Jacoby B.A., Jonker P.G., 2005, ASPC, 328, 357, “Binary Radio Pulsars”, eds F.A. Rasio, I.H. Stairs, ASP: San Francisco
- [75] Verbunt F., Kuiper L., Belloni T., Johnston H.M., de Bruyn A.G., Hermsen W., van der Klis M., 1996, A&A, 311L, 9
- [76] White R.L., Becker R.H., 1992, ApJS, 79, 331
- [77] White R.L., Becker R.H., Helfand D.J., Gregg M.D., 1997, ApJ, 475, 479
- [78] Williams R.M., Chu Y.-H., Dickel J., Petre R., Smith R.C., Tavarez M., 1999, ApJS, 123, 467
- [79] Wright A.E., Griffith M.R., Hunt A.J., Troup E., Burke B.F., Ekers R.D., 1996, ApJS, 103, 145
- [80] Yun M.S., Reddy N., Condon J., 2001, ApJ, 554, 803