Crossover behaviors in one and two dimensional heterogeneous load sharing fiber bundle models
Abstract
We study the effect of heterogeneous load sharing in the fiber bundle models of fracture. The system is divided into two groups of fibers (fraction and ) in which one group follow the completely local load sharing mechanism and the other group follow global load sharing mechanism. Patches of local disorders (weakness) in the loading plate can cause such a situation in the system. We find that in 2d a finite crossover (between global and local load sharing behaviours) point comes up at a finite value of the disorder concentration (near ), which is slightly below the site percolation threshold. We numerically determine the phase diagrams (in 1d and 2d) and identify the critical behavior below with the mean field behavior (completely global load sharing) for both dimensions. This crossover can occur due to geometrical percolation of disorders in the loading plate. We also show how the critical point depends on the loading history, which is identified as a special property of local load sharing.
pacs:
62.25.MnFracture/brittleness and 64.60.ahPercolationI Introduction
The fiber bundle model serves as a simple model for failure due to fracture. Originally starting with the textile industry first , some of its characteristic features mimic the failure processes in many disordered materials dani ; coleman ; books ; rmp1 . Also, it can have direct similarities with fiber reinforced composites (FRC), which are very useful materials for aerospace industries kun . Due to its importance in theoretical modelling of disordered materials in general and FRCs in particular, fiber bundle model have been studied in great details newman ; roux ; pradhan1 ; hemmer1 ; hansen1 ; sornette ; zapperi ; pradhan2 ; pradhan3 ; pradhan4 ; rmp2 .
The basic model is about a bunch of fibers, having different failure thresholds and hanging from a rigid plate. The fibers are also attached to a plate at the bottom, from which a load is hanging. If the threshold distribution starts continuously from zero (in most cases they do), then as soon as any load is applied, some of the weak fibers will break. The load carried by those fibers will now be redistributed among the other intact fibers and this may lead to failure of some more fibers and so on. This avalanche can stop due to one of the following two reasons: either all the fibers may break and the system undergoes complete failure, or the remaining fibers can withstand the load and the system is only partially damaged. The transition between partial and complete failure have been studied using the standard tools of phase transitions (diverging time scales, scale free behavior of avalanche size distribution, susceptibility and so on).
Depending upon the requirements and interests of study, the fiber bundle model can differ in some key aspects. The threshold distribution of the fibers can vary (uniform distribution, Gaussian, Weibull, Gumbel etc.). Although the failure point sensitively depends upon the details of these distributions, the exponents remain universal (here we use uniform distribution). Another key aspect in which the models can differ is the load sharing mechanisms. When a fiber breaks, its load is to be shared by the remaining intact fibers. But there can be many ways in which this can be done. Two extreme cases are: Global Load Sharing (GLS) and Local Load Sharing (LLS). In GLS, the load of the broken fiber is distributed equally among the rest of the fibers and in LLS it is distributed only among the nearest surviving neighbor(s). In general, the elastic properties of the bottom plate (or that of the matrix material in FRCs) are responsible for the load sharing mechanisms. The two extreme cases correspond to perfectly rigid and perfectly soft bottom plates. The real situation is, of course, somewhere between these two. Hence, there have been efforts to interpolate between the two mechanisms inter1 ; inter2 ; inter3 ; inter4 . Finally, another aspect that we want to mention here is the different loading processes. There are several ways in which the load can be increased. One way is to apply a load and then wait for the avalanche to stop. Once the avalanche stops, increase the load upto the point where the weakest surviving fiber breaks. This will start another avalanche and so on. Another way is to increase the load by a constant amount every time an avalanche stops. And finally, one can also directly apply the required load in the intact system. In GLS models, the loading mechanisms do not change the critical point. In some situations, this can be important, as we shall discuss.
In the different models, the load sharing mechanisms followed by all the fibers were same (global, local or some other intermediate rule). However, the governing factors of the load sharing mechanisms, like the elastic properties of the bottom plate, can be modified due to local disorders, i.e., the elastic properties of the bottom plate may not be homogeneous. The heterogeneity introduced by local disorders can make the load sharing mechanisms heterogeneous as well. In this study we investigate the effect of such heterogeneity. We divide the fiber into two groups, where one group follow GLS and the other follow LLS. The competing effects of these two mechanisms give rise to a cross-over behavior at a threshold value of the fraction. We determine the phase diagram and the critical behavior numerically. Also, we show that the process of loading changes the critical point in this case. We argue that spatial correlations in the presence of local load sharing gives rise to this change in critical point.
II Heterogeneous load sharing
As pointed out before, the load sharing process in the system is a manifestation of the elastic properties of the base plate. Hence, local disorders in that material may lead to heterogeneous load sharing processes. To see some effects of that we divide the system into two parts, a fraction of the fibers follow completely local load sharing process and the rest fraction follow global load sharing process. In increasing the load we have followed the direct loading mechanism, i.e., we apply a load directly in the intact fiber. Comparisons with other loading mechanisms are discussed in the later part.
We study this model both in 1d and 2d (square lattice) geometry numerically. Throughout the paper we have used uniform distribution (in the range []) of the breaking threshold for the fibers. Since this is also an interpolation mechanism ( corresponds to GLS and corresponds to LLS), we compare the results with that of ref inter2 , where a fraction of the load of the broken fiber is shared locally and the rest is distributed globally. Below we present the simulation results in one and two dimensions for this model.
II.1 Results in one dimension
In this case the fibers are arranged in a linear lattice. After applying a load on the intact fiber, we scan the lattice once and the fibers having threshold below the applied load are broken. This would create patches of broken fibers. Now, among them the fraction of load carried by the local load sharing fibers, are distributed to the nearest surviving neighbors (in this way, the load of an isolated local load sharing fiber will go to the nearest surviving neighbors) and the rest is distributed globally among the remaining fibers. This may lead to further failures and so on.
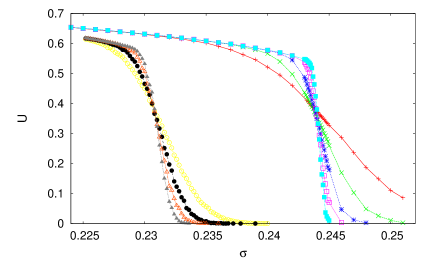
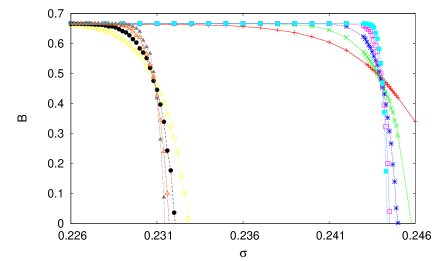
While we plot the fraction () of surviving fibers with external load, to accurately determine the critical point we also study the reduced fourth order Binder cumulant binder
| (1) |
which has the property that its value is independent of system size at the critical point. This helps in determining the critical point very accurately. In Fig. 1 we plot the fraction of surviving fibers with external load and for different system sizes (at and ). Then in Fig. 2 we plot the Binder cumulant for different system sizes (also for and ). The common crossing point, which signifies size independent value, is the critical point. In this way the phase boundary was determined.
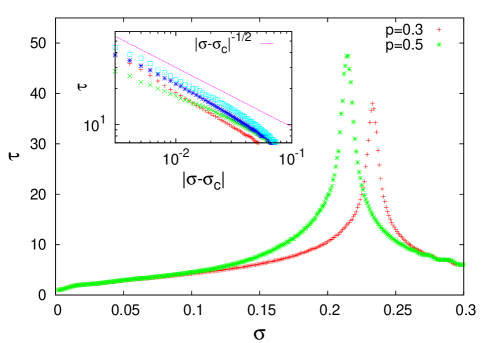
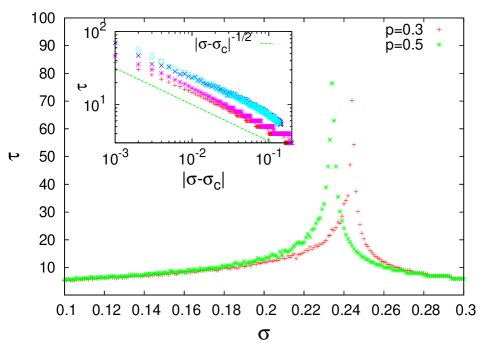
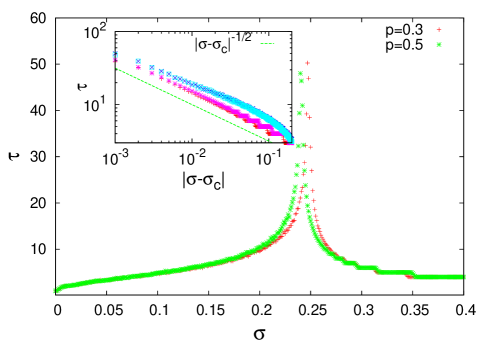
To determine the critical behavior, we plot the relaxation time in Fig. 3. The relaxation time is basically the interval between two successive load increments. In the steady state when the external load is increased, the whole lattice is scanned once and the fibers having breaking threshold below the present load per fiber are broken. The load redistribution, however, is made after one full scan of the lattice, or in other words, parallel dynamics is followed. Now, one single scan of the entire lattice is taken as one Monte Carlo time step. In this way the relaxation time is estimated as the time steps required by the system to reach a steady state after a load increment. The relaxation time is expected to diverge near the critical point as , From the simulations we see that , which is in agreement with GLS exact result . We have checked that these exponent values remain unchanged upto and beyond that no power law variation is observed. Of course is the crossover point in the phase boundary, beyond which the system fails as soon as any finite load is applied and there is no common crossing point of the Binder cumulant. This indicates that the mean field critical behavior is present upto the crossover point and beyond that it goes over to local load sharing behavior, where of course critical behavior is not present. We also note that the crossover point is almost upto the point of percolation. In one dimension, if the disorder has to percolate, its concentration will have to be unity. In this case that value is almost reached.
II.2 Results in two dimensions
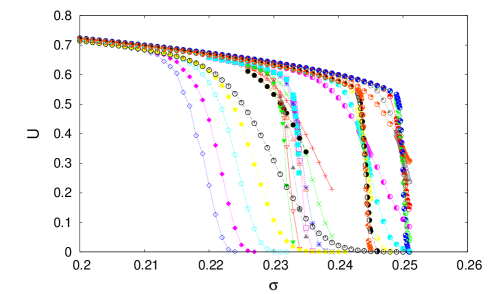
Similar to the case in one dimension, this heterogeneous load sharing mechanism can be followed in the more realistic case of two dimensions as well. In this case, after each scan of the lattice, the clusters of the broken fibers are identified. Then the fraction of the load to be shared locally is distributed along the cluster boundary and the rest is redistributed globally. As before, the load of an isolated fiber with local load sharing property will go to the surrounding cluster boundary of the patch of the broken fiber in which the isolated fiber will belong after its breaking. The fraction of surviving fibers with external load for various values are shown in Fig. 4
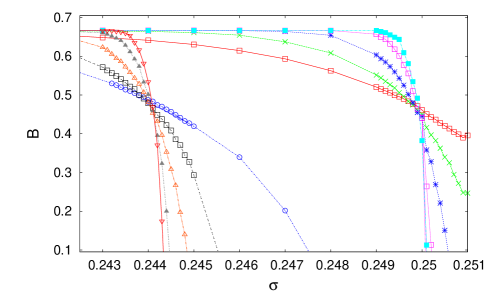
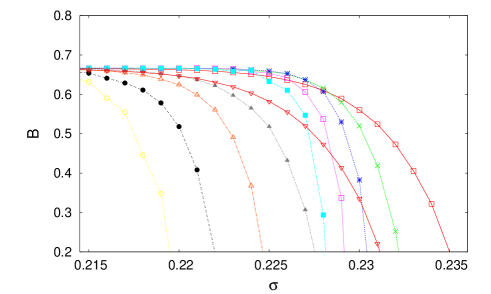
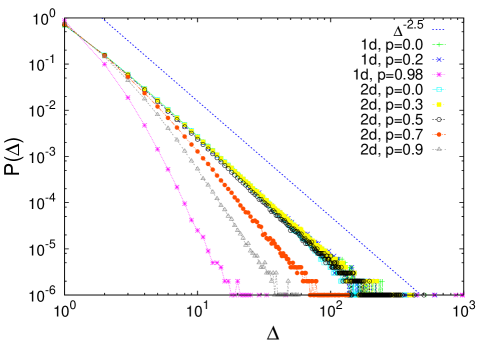
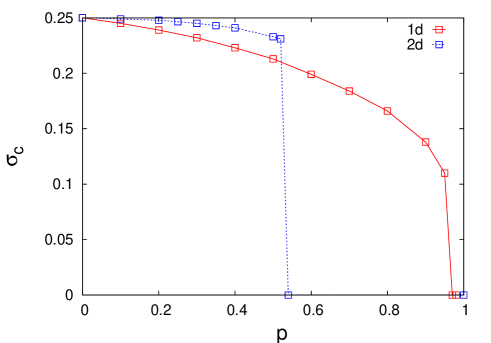
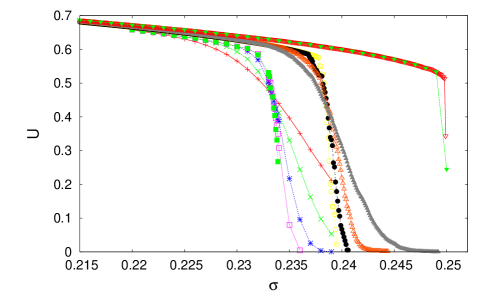
As before, one can determine the critical point by the common crossing point of the Binder cumulant for different system sizes (see Fig. 5). The critical point decreases with increasing fraction of the local load sharing fibers. But above a threshold value , there is no common crossing point of the Binder cumulant (see Fig. 6). This suggests a crossover to local load sharing. This point is also slightly below the site percolation threshold () stauffer . The critical behavior, determined from the avalanche size distribution (Fig. 7) and divergence of relaxation time (Fig. 8), is same as that of GLS model. The phase diagrams for one and two dimensions for this model is shown in Fig. 9.
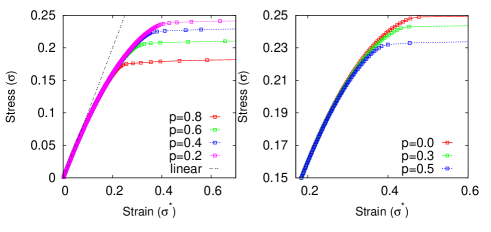
We have also shown the stress ()-strain () (with ) relation for the model (see Fig. 10). While individual fibers behaves linearly, the collective stress-strain curve is non-linear but approaches linearity as . We show the behaviours for both one and two dimensions and for different values of , which is a measure of weakness of the material, and the breakdown occurs for lower stress as is increased. The non-linearity observed here is similar in form with that seen in Red Wildmoor sandstone earling and this form seems to be better in describing the non-linearity than the one suggested in Ref. earling .
III Dependence on loading process
As mentioned before, there can be several ways in which external load can be applied in the system. The two extreme cases are (i) increasing the load upto the point when the weakest fiber breaks and (ii) applying the desired load directly on the intact fiber. Between these two ways, one can also adapt a third possibility when the load is increased by equal amount in every step (after an avalanche stops). In GLS scheme, the fraction of surviving fibers and for that matter the critical point would not depend on how one increases the load. However, the situation can change when there is local load sharing mechanism present (even partially).
In the case of our model, we have studied the three ways of increasing the load and found that the critical point differs for finite values. In Fig. 11 , we have plotted the fraction of surviving fibers for equal load increment and direct loading for . The results show that the critical point is significantly different for the two cases. We have also plotted the same cases for (GLS model) but it is clear that the load increment mechanisms have no effect on the GLS version. This is probably due to the fact that spatial correlations in avalanches are present in the local load sharing, which depends on the load increment method. But for GLS there is no spatial structure as such.
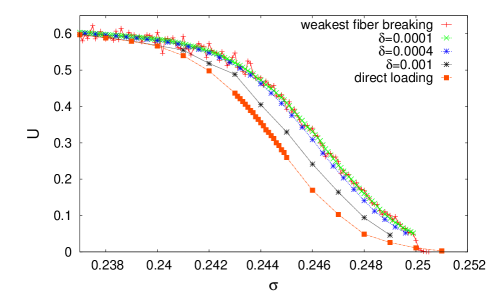
In Fig. 12 we plot, for a given system size and value, the fraction of surviving fibers for different loading methods. We find that the weakest fiber breaking and the direct loading are two limits, and equal load increment method interpolates between the two. For very small value of the fixed increment rate (), the curve is almost identical with that in weakest fiber breaking. This is because, for , the equal load increment method should be effectively same as that of weakest fiber breaking.
Finally, we note that although the critical point is dependent on the load increment mechanisms for finite values, the crossover point and the critical behavior below the crossover point is unaffected by the load sharing mechanisms. The results presented in the previous section are for direct loading, except for the avalanche size distribution, which is for weakest fiber breaking.
IV Comparison with mixed load sharing model
The present model (refer to this as ‘’ model) is also an interpolation scheme between LLS and GLS. In fact this is the heterogeneous version of the mixed mode load sharing (MMLS) model inter2 , where after failure of every fiber, a fraction of the load of a broken fiber is distributed locally and the rest is distributed globally (we refer to this as ‘g’ model). This model was studied in one dimension in Ref. inter2 . We have studied it in two dimensions as well. Although the amount of load shared locally on average is same for the two models, the local fluctuations introduced in the present version makes it significantly different from the earlier one.
The relaxation time divergence of this model in two dimensions (Fig. 13), shows the same critical behavior as that of the one dimensional version (and GLS model). In Fig. 14 we compare the phase diagrams of the two models in one and two dimension, which shows the effect of heterogeneity as the phase boundaries do not coincide. The phase boundary and critical behavior of MMLS model in one dimension was reported in ref. inter2 . Here we determine those in two dimensions.
V Summary and Discussions
There are two extreme cases of load sharing (GLS and LLS) in the fiber bundle models. Since load sharing mechanism is the only source of cooperativity in these models, in that sense the load sharing mechanisms determine the spatial fluctuations. Apart from the theoretical significances of the possible spatial correlations, the load sharing mechanism is of vital practical importance, since it determines the strength of the material (irrespective of threshold distribution).
While the completely global load sharing is idealised case, the completely local load sharing has no finite critical point. Hence, there have been several interpolation mechanisms to match realistic situations inter1 ; inter2 ; inter3 ; inter4 . However, in all such cases the load sharing methods is same throughout the sample. But here we argue that local disorders in the materials can make the load sharing spatially heterogeneous. In this regards, we have proposed a simple heterogeneous load sharing model that gives crossover behavior at a non-trivial concentration value of the disorder.
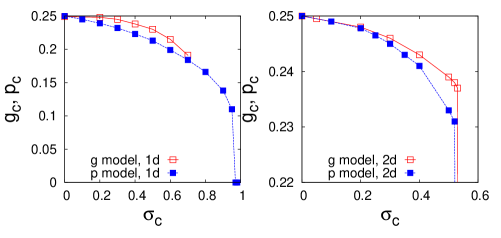
We have studied this model in both one and two dimensions. In one dimension, we have found that the critical disorder concentration at which the crossover occurs is , which is very close to the trivial percolation threshold in one dimension (unity). The phase diagram was determined using Binder cumulant. It is seen that the critical behavior, in terms of avalanche size distribution and relaxation time divergence, remains that of the GLS model upto the crossover point (see Fig. 3). The same behavior is seen in two dimensions. However, the crossover point is now , which is again close (and slightly below) the site percolation threshold in square lattice () stauffer . The fact that the crossover occurs even before the percolation may be due to the fact that even for local load sharing, the load transfer may some times be long ranged due to the absence of neighbors. Of course the percolation threshold should be the upper bound for the crossover, since beyond the percolation threshold the local load sharing fibers will form a compact cluster, the size of which will scale as the system size and therefore, that cluster will fail at any finite load due to the same reason as a fully local load sharing system always fails.
We have also noted that a finite local load sharing fraction would lead to dependence on loading history. For a GLS model, the fraction of surviving fibers and the critical point was independent of loading history. But as soon as a local load sharing fraction is introduced, these quantities become loading history dependent (see Fig. 12). This is an important factor, because in a real material it is not possible to determine the microscopic load sharing mechanism directly. But this is a macroscopic manifestation of the microscopic load sharing process. And for the strength of the material, it is very important whether the load sharing is global or local. Because, as we see from the phase diagram (see Fig. 9), the system breaks down as soon as any load is applied much before the load sharing is completely local. It is in fact close to (below) the percolation threshold in the respective lattices.
Finally, we have compared our model with another interpolation scheme, which is in fact the homogeneous version of the present model. Although the average load sharing of local and global fractions are same, due to local fluctuations in the present model, the phase boundaries are different (see Fig. 14).
In summary, we have proposed a heterogeneous load sharing mechanism for fiber bundle models to account for the local disorder concentration in the bottom plate of the fiber bundle models. For finite fraction of local load sharing, the model has loading history dependent response. We have found numerically, that the critical behavior crosses over from GLS (mean field) to LLS at some effective site percolation threshold. The critical behavior across the phase boundary (Fig. 14) is of mean field type (relaxation time divergence exponent and avalanche size distribution has an exponent ).
We acknowledge Srutarshi Pradhan for discussions and suggestions and Erling Fjær for pointing out Ref. earling . The work was finalized during both the authors’ visit to SINTEF, Norway. The authors also acknowledge participants of the INDNOR Project meeting for discussions and BKC’s JC Bose Fellowship (DST, Govt. of India) for partial support.
References
- (1) F. T. Peirce, J. Text. Inst. 17 (1926) T355.
- (2) H. E. Daniels, Proc. R. Soc. London, Ser. A 183 (1945) 405.
- (3) B. D. Coleman, J. Appl. Phys. 27 (1956) 862.
- (4) Statistical Models for the Fracture of Disordered Media, edited by H. J. Herrmann and S. Roux (North-Holland, Amsterdam, 1990); B. K. Chakrabarti and L. G. Benguigui, Statistical Physics of Fracture and Breakdown in Disordered Systems (Oxford University Press, Oxford, 1997); M. Sahimi, Heterogeneous Materials II: Nonlinear and Breakdown Properties (Springer-Verlag, New York, 2003).
- (5) S. Pradhan, A. Hansen and B. K. Chakrabarti, Rev. Mod. Phys 82 (2010) 499.
- (6) F. Kun, F. Raischel, R. C. Hidalgo and H. J. Herrmann in Modelling Critical and Catastrophic Phenomena in Geoscience: A Statistical Physics Approach, edited by P. Bhattacharyya and B. K. Chakrabarti (Springer-Verlag, Berlin), Vol. 705, p. 57 (2007).
- (7) W. I. Newman and S. L. Phoenix, Phys. Rev. E 63 (2000) 021507.
- (8) S. Roux, Phys. Rev. E 62 (2000) 6164; R. Scorretti, S. Ciliberto and A. Guarino, Europhys. Lett. 55 (2001) 626.
- (9) S. Pradhan and B. K. Chakrabarti, Phys. Rev. E 67 (2003) 046124.
- (10) P. C. Hemmer and A. Hansen, J. Appl. Mech. 59 (1992) 909.
- (11) A. Hansen and P. C. Hemmer, Phys. Lett. A 184 (1994) 394.
- (12) D. Sornette, J. Phys. A 22 (1989) L243.
- (13) S. Zapperi, P. Ray, H. E. Stanley, and A. Vespignani, Phys. Rev. Lett. 78 (1997) 1408.
- (14) S. Pradhan and B. K. Chakrabarti, Phys. Rev. E 65 (2001) 016113; S. Pradhan, P. Bhattacharyya and B. K. Chakrabarti, Phys. Rev. E 66 (2002) 016116; P. Bhattacharyya, S. Pradhan and B. K. Chakrabarti, Phys. Rev. E 67 (2003) 046122.
- (15) S. Pradhan, A. Hansen and P. C. Hemmer, Phys. Rev. Lett. 95 (2005) 125501.
- (16) S. Pradhan and B. K. Chakrabarti, Int. J. Mod. Phys. B 17 (2003) 5565.
- (17) H. Kawamura, T. Hatano, N. Kato, S. Biswas, B. K. Chakrabarti, Rev. Mod. Phys. 84 (2012) 839.
- (18) R. C. Hidalgo, Y. Moreno, F. Kun and H. J. Herrmann, Phys. Rev. E 65 (2002) 046148.
- (19) S. Pradhan, B. K. Chakrabarti and A. Hansen, Phys. Rev. E 71 (2005) 036149.
- (20) R. C. Hidalgo, S. Zapperi and H. J. Herrmann, J. Stat. Mech. 2008 (2008) P01004.
- (21) F. Raischel, F. Kun and H. J. Herrmann, Phys. Rev. E 74 (2006) 035104.
- (22) K. Binder and D. Heermann, Monte Carlo Simulations in Statistical Physics (Springer, Berlin, 1988).
- (23) D. Stauffer and A. Aharony, Introduction to percolation theory, 2nd ed. (Taylor & Francis, London, 1994)
- (24) E. Fjær, in Proceedings of the 17th US Rock Mechanics Symposium. Vail, Colorado, 6-9 June, 1999.